HAL Id: cea-00416498
https://hal-cea.archives-ouvertes.fr/cea-00416498
Submitted on 13 Sep 2019
HAL is a multi-disciplinary open access
archive for the deposit and dissemination of sci-entific research documents, whether they are pub-lished or not. The documents may come from teaching and research institutions in France or abroad, or from public or private research centers.
L’archive ouverte pluridisciplinaire HAL, est destinée au dépôt et à la diffusion de documents scientifiques de niveau recherche, publiés ou non, émanant des établissements d’enseignement et de recherche français ou étrangers, des laboratoires publics ou privés.
Spectral and temporal luminescent properties of Eu(III)
in humic substances solutions from different origins
Julien Brevet, Francis Claret, Pascal E. Reiller
To cite this version:
Julien Brevet, Francis Claret, Pascal E. Reiller. Spectral and temporal luminescent properties of Eu(III) in humic substances solutions from different origins. Spectrochimica Acta Part A: Molecular and Biomolecular Spectroscopy, Elsevier, 2009, 74 (2), pp.446-453. �10.1016/j.saa.2009.06.042�. �cea-00416498�
Spectral and temporal luminescent properties of Eu(III) in
humic substance solutions from different origins.
Julien Brevet,b Francis Claret,a,† Pascal E. Reillera,*
a Commissariat à l’Energie Atomique (CEA), CE Saclay, DEN/DANS/DPC/SECR, Laboratoire de Spéciation des
Radionucléides et des Molécules, Bâtiment 391-p.c. 33, F-91191 Gif-sur-Yvette CEDEX, France, b Université d’Evry
Val d’Essonne, Laboratoire Analyse et Environnement pour la Biologie et l’Environnement, CNRS UMR 8587, Bâtiment Maupertuis, Boulevard François Mitterrand, F-91025 Evry CEDEX, France.
Spectrochimica Acta Part A: Molecular and Biomolecular Spectroscopy 74 (2), 446-453
http://doi.org/10.1016/j.saa.2009.06.042
Abstract
Although a high heterogeneity of composition is awaited for humic substances, their complexation properties do not seem to greatly depend on their origins. The information on the difference in the structure of these complexes is scarce. To participate in the filling of this lack, a study of the spectral and temporal evolution of the Eu(III) luminescence implied in humic substances (HS) complexes is presented. Seven different extracts, namely Suwannee River fulvic acid (SRFA) and humic acid (SRHA), and Leonardite HA (LHA) from the International Humic Substances Society (USA), humic acid from Gorleben (GohyHA), and from the Kleiner Kranichsee bog (KFA, KHA) from Germany, and purified commercial Aldrich HA (PAHA), were made to contact with Eu(III). Eu(III)-HS time-resolved luminescence properties were compared with aqueous Eu3+ at pH 5. Using an excitation wavelength of 394 nm, the typical bi-exponential luminescence decay for Eu(III)-HS complexes is common to all the samples. The components τ1 and τ2 are in the same order of magnitude for all the
samples, i.e., 40 τ1 (µs) 60, and 145 τ2 (µs) 190, but significantly different. It is shown that
different spectra are obtained from the different groups of samples. Terrestrial extract on the one hand, i.e. LHA/GohyHA, plus PAHA, and purely aquatic extracts on the other hand, i.e., SRFA/SRHA/KFA/KHA, induce inner coherent luminescent properties of Eu(III) within each group. The 5D0→7F2 transition exhibits the most striking differences. A slight blue shift is observed
compared to aqueous Eu3+ (λmax = 615.4 nm), and the humic samples share almost the same λmax ≈
614.5 nm. The main differences between the samples reside in a shoulder around λ ≈ 612.5 nm, modelled by a mixed Gaussian-Lorentzian band around λ ≈ 612 nm. SRFA shows the most intense shoulder with an intensity ratio of I612.5/I614.7 = 1.1, KFA/KHA/SRHA share almost the same ratio
† Present address: BRGM, Environment and Process Division, 3 avenue Claude Guillemin, F-45060 Orleans CEDEX 2, France
I612.5/I614.7 = 1.2-1.3, whilst the LHA/GohyHA/PAHA group has a I612.5/I614.5 = 1.5-1.6. This shows that for the two groups of complexes, despite comparable complexing properties, slightly different symmetries are awaited.
KEYWORDS Humic acid, fulvic acid, luminescence, fluorescence, lanthanides, europium
1. Introduction
The complexation by natural organic matter (NOM) is expected to play an important role in the transport properties of lanthanides (Ln) and actinides (An). It has been shown that humic substances (HS), and from these extracts humic acids (HA) and fulvic acids (FA), due to their colloidal properties induce a facilitated transport of these elements [1-5]. Knowing the diversity of the humic extracts, which can only be defined after their extraction procedure [6], the relative homogeneity of their complexing behaviour towards series of metals may seem surprising [7-14]. Some differences have evidenced in the case of small organic molecules at relatively high concentration [15], which may not be relevant under natural conditions. The more striking evidence being the wide span of models proposed in the literature to represent their compositions and properties [16-18], and particularly the complexation models [7,9,11,19]. Even if these models provide efficient descriptions of the phenomenon, the structure of Ln/An(III)-HS complexes is still an open question, as the structure of these natural ligands is still under debate. Nevertheless, complexation properties of metal series, i.e., Ln(III)/An(III) on the one hand and An(IV) on the other hand, have been shown to be remarkably analogous [7,11,20-21].
The luminescence properties of Ln(III) and An(III) are a convenient way to evaluate their chemical environment, and the influence of HS on the spectra and decay time received particular attention in the past using time-resolved luminescence spectroscopy (TRLS) [21-29], or more recently at the surface of minerals using TRLS-scanning near-field optical microscopy [30]. The Ln(III)-HS luminescence enhancement compared to Ln3+ is due to an energy transfer from a triplet energy level of the ligand to the Ln(III) ion [31]; the correlation in the case of Eu(III) is not straightforward. The most outstanding property of Ln(III) and An(III) luminescence is the apparent bi-exponential decay of the complexes with humic extracts [20-21,24,28-29,32]. Concerning the particular case of Eu(III), this bi-exponential decay yields with a fast component τ1, which is faster than the Eu(H2O)n3+ decay,
and a slower one, which is more in agreement with an enhancement of the decay time due to its complexation. In addition, the hypersensitive transition (5D0→7F2) is enhanced by a factor of, e.g.,
2-4. Up to now, the crystal ligand splitting of the solution spectra has not received much attention for Eu(III)-HS complexes with the exception of the differences between carbonate and humic ligands [25], and 7F0→5D0 excitation splitting [26]. The formal identification of symmetry group would
require line narrowing experiments at low temperature, but the interpretation of such experiments induces the hypothesis that no change of structure occurs during freezing.
The aim of this study is to compare time-resolved luminescence spectra of several Eu(III)-HS complexes obtained with a 1800 lines.mm-1 grating. The luminescence decay times were calculated using a 600 lines.mm-1 grating. The link to the properties or origin of the humic extracts will be discussed. Seven different extracts were used, namely Suwannee River fulvic acid (SRFA) and humic acid (SRHA), Kleiner Kranichsee bog humic acid (KHA) and fulvic acid (KFA), Leonardite humic acid (LHA), Gorleben humic acid (GohyHA) and purified Aldrich humic acid (PAHA), in order to
cover a wide span of origin. The first four are clearly aquatic from Suwannee River (Georgia, U.S.A.) and the Kleiner Kranichsee bog (Germany), whereas the other extracts are from different parts of the planet (U.S.A., Germany, and the commercial Aldrich extract) with slightly different ‘formation modes’. These extracts will be present at the same molar to mass ratio, i.e., 10-5 mol
Eu/200 mgHS even
if the functionalities are slightly different.
2. Materials and Methods
2.1. Preparation of solutions
SRFA, SRHA, and LHA were used as received from the International Humic Substances Society. The functionalities were taken from Milne et al. for SRFA [33], and from Ritchie and Perdue for SRHA and LHA [34]. PAHA was treated following the procedure described in Kim et al. [35], with a functionality taken from Milne et al. and Kim et al. [33,36]. GohyHA was extracted from one of the deep groundwaters in the Gorleben area and was kindly provided by Manfred Wolf (Institut für Grundwasserökologie, GSF – Forschungszentrum für Umwelt und Gesundheit, Munich, Germany). Its origin, isolation, purification, characterisation, and functionality are described in detail elsewhere [37-40]. Kleiner Kranichsee bog extracts (Johanngeorgenstadt, Saxony, Germany), were kindly provided by Susanne Sachs and Katja Schmeide (Institute of Radiochemistry, Forschungszentrum Dresden, Germany). Their origin, isolation, purification and characterisation are described elsewhere [41-42].
Europium (III) stock solution was obtained from the dissolution of Eu2O3 (Johnson Matthey,
99.99%) in HClO4. The concentration ratio of 10-5 molEu/200 mgHS is sufficient to obtain a complete
complexation of Eu(III) [27,33]. The contact time between Eu and HA before TRLS analysis was 1 h.
The ionic strength was fixed with NaClO4 to 0.1 mol L-1 (M) and pH was adjusted by the addition
of freshly prepared 0.1 M NaOH and HClO4. The pH measurements were done using a
combined-glass electrode (Radiometer Analytical XC111) calibrated for its linear response with a 0.01 M HClO4
solution, an equimolar 0.02 M NaH2PO4/Na2HPO4 solution, and an equimolar 0.02 M
Na2CO3/NaHCO3 solution, all containing NaClO4 to keep [Na+] constant at 0.1 M (pH=2, 6.785, and
9.9 respectively). The electrode filling solution was modified with NaClO4 0.1 M, NaCl 10-2 M to
prevent KClO4 precipitation in the frit of the electrode.
2.2. TRLS
Eu(III) was used to probe its laser-induced luminescence properties in contact with humic substances. The observed luminescence corresponds to the 5D0→7F2 “hypersensitive” electric dipole
transition (λmax ≈ 615 nm), the 5D0→7F1 magnetic dipole transition (λmax ≈ 593 nm), and the 5D0→7F0,
forbidden for magnetic and electric reasons (λmax ≈ 580 nm) [43-44]. These emission lines come from
transitions of the 5D0 excited state (17,257 cm-1) to the ground 7Fj manifold [45].
The excitation laser beam was generated by a 355 nm tripled output of a Continuum Nd-YAG laser, coupled to an optical parametric oscillator system (Panther II, Continuum, USA). The wavelength was tuned to 394.6 nm (frequency doubling of idler), providing about 1 mJ of energy in a 5 ns pulse with a repetition rate of 10 Hz. The time-resolved luminescence signal is collected at 90° and focused into an Acton spectrometer (slit 1 mm) equipped with 600/1200/1800 lines.mm-1 gratings. Only the
600 and the 1800 lines.mm-1 (~1 and 0.2 nm resolution, respectively) were used, for decay time and spectral studies, respectively. The signal is collected during a gate width, W = 300 µs, at a gate delay, D = 10 µs, after excitation by the laser flash. To increase the signal to noise ratio, every spectrum was accumulated 1000 times. Care was taken to limit the eventual photoreaction of HS [46]. Emission spectra were recorded using a CCD camera cooled at -15°C. Before measurement the pH was adjusted to 5 to limit the hydrolysis and carbonate species of Eu(III) [47], but to favour the Eu(III)-HS complex formation; applying NICA-Donnan model parameters gives 100% Eu-HS complexation with generic data [48] and 99.1% with particular Gohy data [27,40].
3. Results and Discussions
3.1. Evolution of the decay times
All luminescence decays acquired with the 600 lines.mm-1 grating were fitted with a bi-exponential function between a delay D = 10 µs and a time interval W = 300 µs. For a fully integrative system, this decay can be described by
Fi = D D+W Foi exp– t τi dt = Foi i exp – D i 1 – exp – W i (1)
where Fi is the luminescence signal, F°i and τi are the initial luminescence and the decay time of component i, respectively.
Altering the preceding equation, in the case of a bi-exponential decay, to evidence the proportion
xi of each component, comes the following relation.
F = F°
i=1 2 xi τi exp – D i 1 – exp – W i (2)Fittings were done using a non-linear procedure, and the standard deviations were evaluated using the Microsoft Excel Macro SolverAid [49]. The different decays are reported in Figure 1 and the decay parameters are reported in Table 1. In aqueous solution, 5D0→7F1 (Figure 1), and 5D0→7F2
(data not shown) of Eu3+ (integral of the peaks) showed a clear mono-exponential decay in agreement with previous determinations, i.e., τ(7F1) = 115 ± 3 µs [50-51], which correspond to 8.7 ± 0.5 water
molecules in the first hydration sphere [52]; the decays from the two transitions were not statistically different.
Bi-exponential decays are clearly evidenced in the case of Eu(III)-HS complexes for 5D0→7F2
(Figure 1) and 5D0→7F1 (data not shown), which were not statistically different; it can be seen that
τ1<τH2O , and τ2>τH2O as for a soil HA [21], or for Tb(III)-HS complexes [32]. In the case of Cm(III),
τ1τH2O [20,24], Panak et al. noted that a τ1<τH2O was reported for a soil humic acid [24].
[53-54]. Nevertheless, ternary organic Eu(III) complexes at toluene-water interface do also evidence a τ1 < τH2O [55].
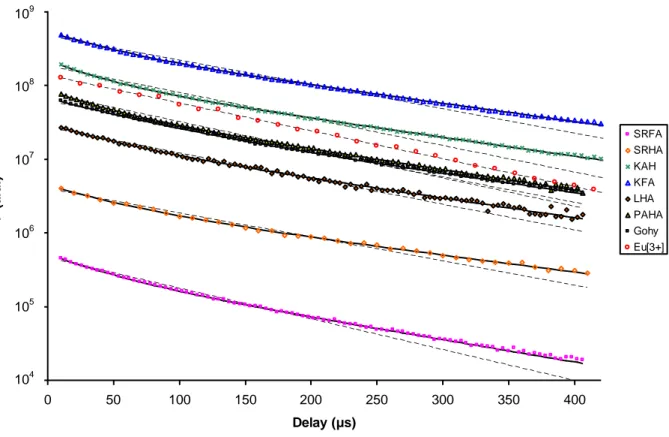
Figure 1: Eu(III) luminescence decays for different fulvic and humic acids from the area of 5D 0→7F1
(Eu3+) or 5D
0→7F2 (Eu–HS complexes), [Eu] = 10-5 M, [HS] = 200 mg.L-1, W = 300 µs, pH 5. Eu3+
(empty circle), SRFA (empty square), SRHA (empty diamond), KHA (cross), KFA (empty triangle), GohyHA (full square), PAHA (full triangle), LHA (full diamond), mono-exponential (dotted lines) and bi-exponential fits (plain lines).
Table 1. Temporal and fitting parameters for the luminescence decay of Eu(III)-HS complexes in Figure 1.
SRFA PAHA LHA KHA Gohy KFA SRHA
Monoexponential fitting τ nH2O ± 0.5 105 ± 3 9.4 114 ± 4 8.8 125 ± 3 7.9 121 ± 3 8.2 127 ± 3 7.8 131 ± 3 7.5 132 ± 6 7.5 r²a 0.9901 0.9861 0.9896 0.9873 0.9924 0.9847 0.9873 Bi-exponential fitting x 0.72 ± 0.04 0.73 ± 0.05 0.67 ± 0.08 0.77 ± 0.02 0.68 ± 0.05 0.72 ± 0.02 0.71 ± 0.11 τ1 τ2 nH2O ± 0.5 41 ± 3 144 ± 5 6.8 38 ± 2 156 ± 4 6.2 45 ± 8 165 ± 10 6.0 37 ± 2 169 ± 4 5.7 60 ± 6 172 ± 11 5.6 43 ± 2 178 ± 3 5.4 53 ± 12 191 ± 24 5.0 r²a 0.9995 0.9996 0.9983 0.9996 0.9996 0.9998 0.9986
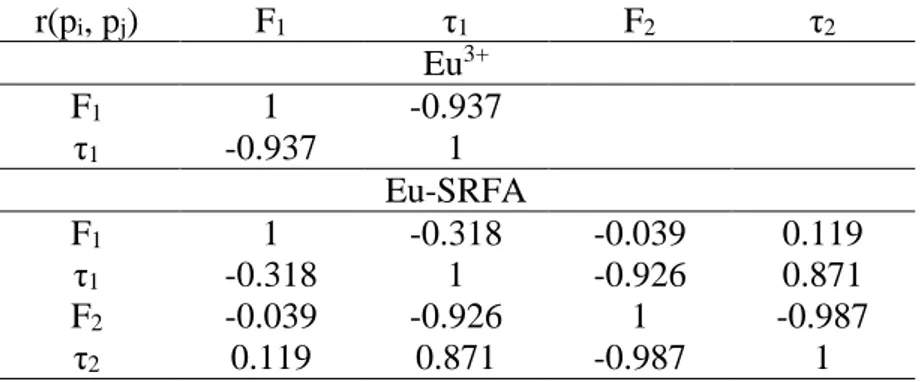
It must be noted here that the non-linear regression fitting of Equation 2 is leading to correlated parameters, even for the simple case of the mono-exponential decay of Eu3+ in aqueous solution; the correlation matrices, obtained from the variance matrices, of Eu3+ and Eu-SRFA decays are given in
0 50 100 150 200 250 300 350 400 Delay (µs) F ( a .u .) SRFA SRHA KAH KFA LHA PAHA Gohy Eu[3+] 109 108 107 106 105 104
Table 3. It can be seen that F and τ are strongly correlated. For Eu-SRFA complex, F1 is not correlated
with the other parameters, τ1 and τ2 are weakly correlated, whereas F2 is correlated with τ1 and τ2.
Some similarities and differences can be evidenced in Table 1. First, the relative importance of the fast component is about 70% within uncertainties, with the exception of KHA (x = 0.77 ± 0.02). It is noteworthy that the fast component represented around 80% for Cm(III)-GohyHA complexes [24]. As stated earlier, the fast component is always faster than the Eu(III) decay in aqueous solutions. It is difficult to directly compare the decay pattern of these two cations.
Table 3: Variance and correlation matrices for the non-linear fitting of Equation 2 for Eu3+ in aqueous
solution and for Eu-SRFA complex.
r(pi, pj) F1 τ1 F2 τ2 Eu3+ F1 1 -0.937 τ1 -0.937 1 Eu-SRFA F1 1 -0.318 -0.039 0.119 τ1 -0.318 1 -0.926 0.871 F2 -0.039 -0.926 1 -0.987 τ2 0.119 0.871 -0.987 1
The different Eu(III)-HS complexes show somewhat comparable fast decay properties, regarding the uncertainties of the fits, particularly for the most absorbing solution. The τ1 values are more or
less identical for SRFA, PAHA, KHA, LHA, and KFA. In the case of GohyHA/SRHA, τ1 values are
slightly higher but the uncertainties for SRHA do not permit to fully ascertain the trend. These values are lower than reported for a soil HA [21], i.e., τ1 ≈ 74 ± 5 µs. We should note here that this value
was obtained with a slightly different fitting procedure: τ2 ≈ 155 ± 3 µs was obtained using low
concentration of Eu(III) where τ1 was not detected, and fixing τ2 = 155 µs afterwards, τ1 ≈ 74 ± 5 µs
was obtained for higher Eu(III) concentrations.
For the slower component decay time, τ2, the increase is more evident following the same series
than for τ1, i.e., SRFA, PAHA, LHA, and KFA/GohyHA/KHA/SRHA. Here again these values can
be compared with τ2 = 155 ± 3 µs proposed otherwise [21], which is close to SRFA and PAHA values:
other data seem to be somewhat higher. Actually, it is difficult to compare with other results [32], as Eu(III)-HS data, obtained on 5D0→7F1 transition, are not available. Nevertheless, no clear tendencies
were anticipated regarding the data on Tb(III) [32], and neither can we through this study. There is no clear correlation with H/C, O/C, neither with the carboxylic nor the phenolic functionality [33-34,40-41], The known origins of the extracts, which should be reflected in the H/C vs. O/C correlation, are neither informative (data not shown).
The occurrence of a bi-exponential decay in the case of HS, even if it was observed both for Ln(III) and An(III), is still not very well understood. Whatsoever, from kinetic theory, this bi-exponential decay monitors the fact that two different species are losing energy through a first-order reaction by two radiative deactivation pathways leading to the same product [56]; the former is faster than free aqueous Eu3+, which could indicate a quenching process, the latter being slower, which is an indication of a complexation process that hinders the OH quenching.
Kumke et al. proposed a slightly different view [32]. Using a stretched exponential law, the authors proposed that the apparent bi-exponential was related (i) to the luminescence decay of the complexed Ln(III) and (ii) to a back transfer from the Ln(III) to the humic chromophore introducing a diffusion parameter in the matrix of the humic aggregate. This analysis was conducted on Tb(III) [32], as the authors did not observed bi-exponential decay of Eu(III)-HS complexes on the 5D0→7F1 band and
only shorter than τH2O decay times were noted but not reported in the text.
The energy of the 5D0 level of Eu(III), i.e., 17,257 cm-1 [57], seems too low to favour back transfer
energy to the 3ππ* states of isolated organics, i.e., around 19,000-25,000 cm-1 [32]. Nevertheless, given the available values for the average triplet state of NOM, i.e., from 14,000-15,500 to 20,500 cm-1 [58-59], it seems that the probability for a back transfer process to humic triplet state could be favourable for Eu(III).
The comparison with the empirical relationships proposed for Eu(III) [51-52] can be very difficult in the case of humic complexation because of the unknown origin of the bi-exponential decay, and because of the necessity to obtain the relation for the particular system [60]. Two hypotheses can be made: (i) the mono-exponential decay provide an average comportment of Eu(III)-HS complex, and (ii) one can consider that the bi-exponential decay is related to two different emitting species, then one can estimate the remaining hydration of the second decay which could be viewed as a complex hindered from OH quenching. Under the first hypothesis, n(H2O) from 9.4 to 7.5 is obtained. Using
the second hypothesis and the relationship proposed by Kimura et al. [52], one can obtain n(H2O)
values of 7 in the case of SRFA to 5 in the case of SRHA. This can be compared with the theoretical value of 9 water molecules in the hydration layer of Eu(III).
The quantification of the different emitting species is also very difficult. For the time being there is still a lack of information of the ‘intimate’ composition of humic substances [61]. Moreover, only a few information exists on the fluorescence yields of the different molecules that can be encountered in humic mixtures, such as precursors and degradation products of lignine for instances; a work like the one endeavoured by Marmodée et al. [62] on aromatic carboxylic ligands could be extended to these molecules.
3.2. Comparison of luminescence spectra obtained from decay time analyses.
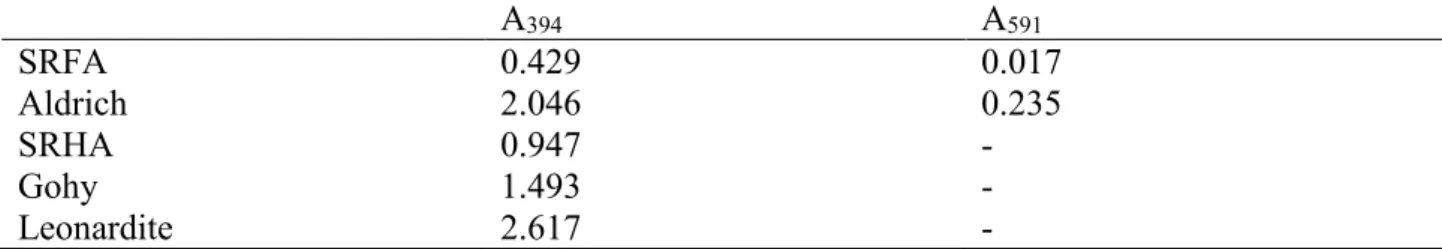
The first spectra at D = 10 µs normalized to their maximum intensity in order to ease comparisons are reported in Figure 2. The changes in luminescence intensity strongly depend on the pre-filter, absorbance of the incident laser light, and post-filter effects, absorbance of the emitted luminescence, induced by the HS extracts. As an illustration, the absorbance at λ = 394 nm and 591 nm for the 200 mgAH/L solutions is given in Table 2. A strong increase in luminescence is obtained when adding
SRFA, when a decrease in intensity is typically observed for the humic acids, due to the stronger absorbance of HA. The peak maxima of aqueous Eu3+ are around 591.8 nm for 5D0→7F1 and 615.5
nm for 5D0→7F2; the strongly forbidden 5D0→7F0 transition is barely seen around 579 nm in
agreement with direct excitation 7F0→5D0 observed otherwise [63]. The maximum intensity ratio 5D
0→7F2/5D0→7F1, noted 7F2/7F1 hereafter, is 0.31, slightly higher than previous determinations of
0.25 [64-66], suggesting a minor contribution of either EuOH+ or EuCO3+; Similar modification was
observed for the sulfate complexation of U(VI) at pH 2.7 where UO2OH+ strongly influenced the
Figure 2: Eu(III) normalized luminescence spectra in 0.1 M NaClO4 at [Eu] = 10-5 M, [HS] = 200
mgL-1, pH 5, λ
exc = 394 nm, D = 10 µs, W = 300 µs, 600 lines.mm-1 grating. Eu3+ (empty circle), and
Eu–HS complexes with SRFA (empty square), SRHA (empty diamond), KHA (cross), and KFA (empty triangle) (up), and GoHyHA (full square), Leonardite HA (full diamond), PAHA (full triangle) (down).
Table 2: Absorbance of the humic extracts solutions at 200 mg.L-1, at λ = 394 nm and 591 nm.
A394 A591 SRFA 0.429 0.017 Aldrich 2.046 0.235 SRHA 0.947 - Gohy 1.493 - Leonardite 2.617 - 570 580 590 600 610 620 630 640 Wavelength (nm) F (a .u .) Eu SRFA SRHA KHA KFA 570 580 590 600 610 620 630 640 Wavelength (nm) F (a .u .) Euaq GoHyHA LHA PAHA
The formation of Eu(III)-HS complexes induces the increase of both the hypersensitive 5D0→7F2
and forbidden 5D0→7F0 transitions, evidencing the complexation and decrease in site symmetry
[43-44]. The asymmetric ratio, 5D0→7F2/5D0→7F1, seems to be less for the SRFA compared to other
extracts [33], indicating a slightly higher symmetry of the environment; for the other samples, the
7F
2/7F1 ratios are more comparable and do seem to provide a closer type of symmetry around Eu(III).
No clear dependence of 7F2/7F1 vs. humic functionality can be evidenced. Clear differences in the
width of the 5D0→7F2 transitions can be seen between spectra of SRFA/SRHA/KHA/KFA on the one
hand and LHA/GohyHA/PAHA on the other hand, but the apparent λmax difference between the two
groups cannot be considered significant given the resolution (1 nm). The full-width at mid height is
approx. 8 nm for SRFA/SRHA/KHA/KFA and 6.5 nm for LHA/GohyHA/PAHA. For the HA
extracted from the Boom Clay formation (Belgium), FWMH was of 7 nm using the same resolution [25]. The HS originated from aquatic media, i.e., SRHA/SRFA/KHA/KFA, seem to result in a slightly different chemical environment for Eu(III) compared to the ones originated from an oxidation of organic deposits, i.e., LHA/GohyHA, and also from PAHA. Differences were also evidenced between carbonates and humic complexes of Eu(III) [25].
3.3. 5D0→7F0,1 emission spectra
The different spectra obtained with a 1800 lines.mm-1 grating (resolution 0.3 nm) are reported in Figure 3 and 4 for 5D0→7F0,1 and 5D0→7F2, respectively. All the spectra were normalized to their
respective maximum intensity in the wavelength spans. The 5D0→7F0,1 transitions for Eu3+ and
Eu(III)-HS complexes are represented in Figures 3. The strongly forbidden 5D0→7F0 transition,
typically barely seen for aqueous Eu3+ (here λmax ≈ 578.8 nm), is now as high in intensity as the 5D
0→7F1 in Eu(III)-HS complexes (actual values in Table 4). The λmax of 5D0→7F0 and FWMH are
rather constant through the two series of samples, i.e., λmax ≈ 579 nm and FWMH ≈ 1 nm, in agreement
with other determinations using direct 7F0→5D0 excitation [26,68]. One can also note that these
FWMH values are higher than the ones obtained on ‘simple’ organic complexes [69-71], or biological complexes [72], after direct 7F0→5D0 excitation. This is a further indication that HS provides a wide
distribution of complexing sites, as noted between weathering gels and glasses [73]. The decomposition in two components [26,68], is not possible due to the unfavourable signal to noise ratio at this number of accumulations. Further works are in progress to overpass this limitation.
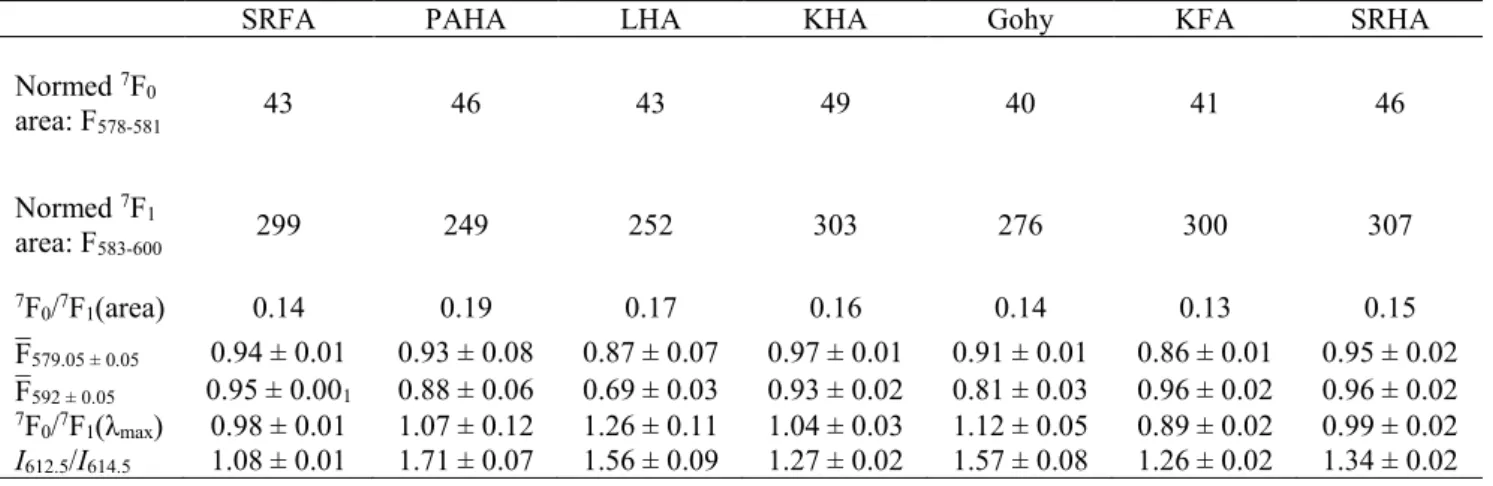
Table 4: Luminescence intensities of normalized spectra, mean luminescence intensities around the λmax and ratio of area and average maximum intensities for 5D0→7F0 (F;¯579.05 ± 0.05) and 5D0→7F1
(F;¯592 ± 0.05) transitions.
SRFA PAHA LHA KHA Gohy KFA SRHA
Normed 7F 0 area: F578-581 43 46 43 49 40 41 46 Normed 7F 1 area: F583-600 299 249 252 303 276 300 307 7F 0/7F1(area) 0.14 0.19 0.17 0.16 0.14 0.13 0.15 F¯579.05 ± 0.05 0.94 ± 0.01 0.93 ± 0.08 0.87 ± 0.07 0.97 ± 0.01 0.91 ± 0.01 0.86 ± 0.01 0.95 ± 0.02 F¯592 ± 0.05 0.95 ± 0.001 0.88 ± 0.06 0.69 ± 0.03 0.93 ± 0.02 0.81 ± 0.03 0.96 ± 0.02 0.96 ± 0.02 7F 0/7F1(λmax) 0.98 ± 0.01 1.07 ± 0.12 1.26 ± 0.11 1.04 ± 0.03 1.12 ± 0.05 0.89 ± 0.02 0.99 ± 0.02 I612.5/I614.5 1.08 ± 0.01 1.71 ± 0.07 1.56 ± 0.09 1.27 ± 0.02 1.57 ± 0.08 1.26 ± 0.02 1.34 ± 0.02
Figure 3: Eu(III) 5D
0 → 7F0 and 5D0 → 7F1 transitions in 0.1 M NaClO4 at [Eu] = 10-5 M, [HS] = 200
mg L-1, pH 5, λ
exc = 394.6 nm, D = 10 µs, W = 300 µs, 1800 lines.mm-1 grating. Eu3+ (empty circle),
and Eu–HS complexes with SRFA (empty square), SRHA (empty diamond), KHA (cross), and KFA (empty triangle) (up), and GoHyHA (full square), Leonardite HA (full diamond), PAHA (full triangle) (down).
The λmax value for the Eu(III)-HS complexes are in agreement with the maximum emission of either
a EuCl2+ complex or Eu(III) in methanol directly excited in the 7F0→5D0 transition [63,74]. This
indicates the low average charge of the complexing units, i.e., around -1 [63]. This surely will not give the charge of the ‘humic molecule’, which carries the complexing unit(s) that complexes Eu(III), but rather the sign of the functionalities themselves. From the relation between the number of coordinated ligands, CN, and the wave number, υmax, proposed for the 5D0→7F0 transition [75], i.e.,
CN = 0.237 Δυ + 0.638, values from CN ≈ 2.0 are obtained. This can also be compared with the values 7 ≤ n(H2O) ≤ 5 obtained from the τ2 evolution shown in Table 1. In the case of SRFA it means
that two water molecules would be expelled during complexation when four water molecules would be released for SRHA. One can remind that the application of the NICA-Donnan model to the Eu(III) complex with HA suggests a monodentate complex for caboxylic type of site (97% of the Eu speciation under our conditions) and a bidentate complex for phenolic type of site (2% of the speciation under our conditions) [27,48]. Hence, the release of two to four water molecules cannot
576 581 586 591 596 Wavelength (nm) F (a .u .) 576 581 586 591 596 Wavelength (nm) F ( a .u .) Eu(aq) LHA PAHA Gohy Eu(aq) KFA SRFA SRHA KHA
yet be directly related to the modelling of the speciation. Schmeide et al. [76] noted that : “if Pu(III)
ions are complexed by humic substances some of the water molecules previously attached to the Pu(III) ion in the inner coordination shell are replaced by carboxylate groups”, but no quantification
could be provided in EXAFS as the O from H2O and from a carboxylic function cannot be
discriminated. Also the steric effects cannot be ascertained yet for these extracts.
The splitting due to the crystal field of the 5D0→7F1 transition is only slightly different between
aqueous Eu3+ and Eu(III)-HS complexes as one can note a narrowing of the transition, e.g., FWMH is 6.9 and 6.2 nm for Eu3+ and Eu(III)-SRFA, respectively. The λmax does not seem to vary. This very
slight variation is in agreement with the fact that this magnetic dipole transition is not prone to variation with symmetry. The other aquatic extracts do seem to have the same λmax for the 5D0→7F1
transition. Concerning the ‘terrestrial’ extract plus PAHA, the situation is not clear as the low signal to noise ratios preclude reliable analyses. The number of accumulation was kept as 1000 in order to avoid photochemical reaction [46]. Works are in progress to overpass this limitation.
3.4. 5D0→7F2 emission spectra
The analysis of 5D0→7F2 in Figure 4 also leads to striking differences: the splits by the crystal
ligand seem to be slightly different as anticipated in Figure 2, which implies a 1.3 nm blue shift from Eu3+ to Eu(III)-HS, i.e. λmax = 615.8 nm to 614.5 nm, respectively; the lowest wavelengths in 5D0→7F2
seem to be more affected as a shoulder around 612.5 nm appears in the structure of the transition. The shoulder is enhanced in SRFA samples and I612.5/I614.5 ≈ 1.1. SRHA, KHA, and KFA are in an
intermediate situation, i.e., I612.5/I614.5 ≈ 1.3, but the lowest energy transitions (λ 613.6 nm in Figure
4) are in perfect agreement with SRFA. Finally, the shoulder is less important for GohyHA, LHA, and PAHA, i.e., I612.5/I614.5 ≈ 1.6-1.7 (Figure 4 and Table 4). This shoulder was also observed
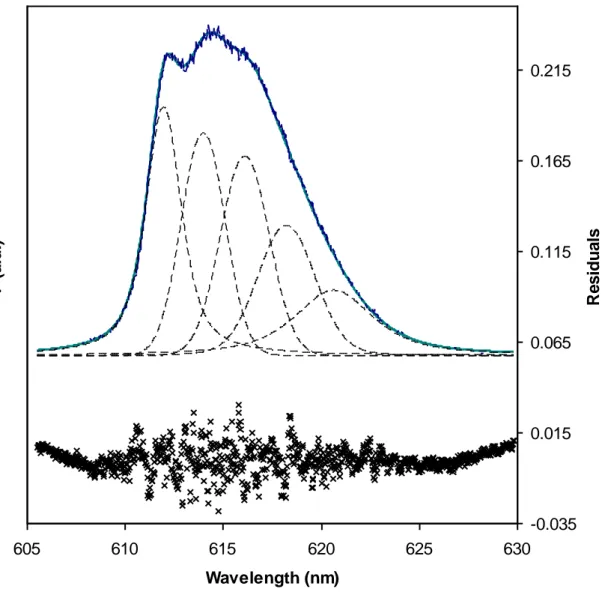
otherwise for Eu(III)-GohyHA complex [28-29], carbonate complexes [77-78], and Eu(III) in a humic-carbonate mix [25]. It is noteworthy that both LHA and GohyHA are originated from an oxidation of an organic carbon deposit [38-39], and PAHA is supposed to be originated from a peat soil and should also have a ‘terrestrial’ origin [79]. The decomposition with five mixed Guaussian-Lorentzian components results in a band around 612 nm for all the samples describing this shoulder (see Figure 5 for SRFA) as seen in the case of carbonate complexes [77-78]. These bands cannot be assigned to Stark levels under our conditions mostly because of the fitting of 4×5 parameters. The intensities when λ 615 nm are also different between SRFA/SRHA/KFA/KAH group on the one hand and Gohy/LHA/PAHA on the other hand.
Figure 4: Eu(III) 5D
0 → 7F2 transitions in 0.1 M NaClO4 at [Eu] = 10-5 M, [HS] = 200 mg L-1, pH 5,
λexc = 394 nm, D = 10 µs, W = 300 µs, 1800 lines.mm-1 grating. Eu3+ (empty circle), and Eu–HS
complexes with SRFA (empty square), SRHA (empty diamond), KHA (cross), and KFA (empty triangle) (up), and GoHyHA (filled square), Leonardite HA (filled diamond), PAHA (filled triangle) (down).
It can be hypothesized that the two groups of HS do provide slightly different symmetries for the complexation of Eu(III). For the former group, i.e., SRFA/SRHA/KHA/KFA the purely aquatic samples, the decrease seems to have a lesser influence on the geometry of the complexes. The SRFA sample seems to provide the ‘more’ symmetric environment for Eu(III). For the latter group, i.e., Gohy/LHA/PAHA which is supposed to be composed of ‘terrestrial’ samples, the symmetries seem
Eu(aq) SRFA SRHA KHA KFA 605 610 615 620 625 630 Wavelength (nm) F ( a .u .) Eu(aq) Leonardite PAHA Gohy 605 610 615 620 625 630 Wavelength (nm) F ( a .u .)
to be directly comparable with and higher than aquatic samples as the shoulder around 612 nm is less important.
Interestingly, from the point of view of the Eu(III)-HS complex symmetry, the SRFA/SRHA samples originated from a black river, which can be submitted to modification by transport in the river flow and with the interaction with river sediments and dissolved minerals, are more different than the samples from the Kleiner Kranichsee Bog, which are supposed to be less submitted to transport-mediated modifications. The same remarks apply for Gohy and LHA, which are originated from bacterial oxidation of a sedimentary carbon, or extracted from lignite, and thus less submitted to transport. These kind of changes in HS properties were also evidenced in column experiment using Aldrich HA [80], and in field studies [81-82]. This could also be related to fractionation of HS during more ‘static’ batch retention experiments on surfaces [66,79,83-85], where physical and chemical modifications of humic extracts were evidenced.
Figure 5: Decomposition of the 5D
0 → 7F2 spectrum of the Eu(III)–SRFA complex in Figure 4.
4. Conclusion
In this work, it can be seen that even if humic extracts are diverse in essence, some similarities can be found for the chemical environment of Eu(III)-HS complexes. The loss of symmetry compared to
605 610 615 620 625 630 Wavelength (nm) F (a .u .) -0.035 0.015 0.065 0.115 0.165 0.215 R e s id u a ls Theo exp P2a P2b P2c P2d P2e residuals
Eu3+ seems rather comparable for all the samples, nevertheless slight differences between two groups of HS samples can be distinguished from the widths of the transition and from shoulders reflecting the ligand splitting of Stark levels. It seems that ‘terrestrial’ extracts, do provide a similar chemical environment for the complexation of Eu(III) in terms of crystal ligand splitting and luminescence decay. Aquatic extracts do provide a somewhat different but also inner consistent chemical environment which can be slightly less symmetric compared to ‘terrestrial’ samples. Further works are in progress in order to verify the wider applicability of these observations to fractionated samples, either after static retention experiments or dynamic column experiments or HPLC fractionation.
Acknowledgments
We acknowledge Drs. T. Vercouter, S. Colette-Maatouk, and F. Viala for helpful discussions. This work was financed through the EC “FUNMIG project” (EC: FUNMIG-NUWASTE-2004-3.2.1.1-1), and the MRTRA project of the Risk Control Domain of CEA (CEA/DEN/DDIN).
References
[1] R. Artinger, B. Kienzler, W. Schüßler, J.I. Kim, J. Contam. Hydrol. 35 (1998) 261.
[2] P.W. Warwick, A. Hall, V. Pashley, N.D. Bryan, D. Griffin, J. Contam. Hydrol. 42 (2000) 19. [3] W. Schüßler, R. Artinger, J.I. Kim, N.D. Bryan,
D. Griffin, J. Contam. Hydrol. 47 (2001) 311. [4] Y. Fujikawa, J. Zheng, I. Cayer, M. Sugahara, H.
Takigami, A. Kudo, J. Radioanal. Nucl. Chem. 240 (1999) 69.
[5] P.H. Santschi, K.A. Roberts, L.D. Guo, Environ. Sci. Technol. 36 (2002) 3711.
[6] P. MacCarthy, Soil Sci. 166 (2001) 738. [7] J.I. Kim, K.R. Czerwinski, Radiochim. Acta 73
(1996) 5.
[8] K.R. Czerwinski, J.I. Kim, D.S. Rhee, G. Buckau, Radiochim. Acta 72 (1996) 179.
[9] D.G. Kinniburgh, W.H. van Riemsdijk, L.K. Koopal, M. Borkovec, M.F. Benedetti, M.J. Avena, Colloids Surf. A 151 (1999) 147. [10] P. Reiller, Radiochim. Acta 93 (2005) 43. [11] P.E. Reiller, N.D.M. Evans, G. Szabó,
Radiochim. Acta 96 (2008) 345.
[12] Y. Yamamoto, Y. Takahashi, H. Shimizu, Chem. Lett. 34 (2005) 880.
[13] O. Pourret, R.E. Martinez, J. Colloid Interface Sci. 330 (2009) 45.
[14] J.E. Sonke, V.J.M. Salters, Geochim. Cosmochim. Acta 70 (2006) 1495.
[15] T. Stumpf, T. Fanghänel, I. Grenthe, J. Chem. Soc. Dalton Trans. (2002) 3799.
[16] H.-R. Schulten, M. Schnitzer, Naturwissenschaften 82 (1995) 487. [17] R.L. Wershaw, Soil Sci. 164 (1999) 803. [18] A. Piccolo, Adv. Agron. 75 (2002) 57. [19] E. Tipping, Aquat. Geochem. 4 (1998) 3. [20] M. Morgenstern, R. Klenze, J.I. Kim, Radiochim.
Acta 88 (2000) 7.
[21] K.H. Chung, W. Lee, Y. Cho, G.S. Choi, C.W. Lee, Talanta 65 (2005) 389.
[22] G. Bidoglio, I. Grenthe, P. Qi, P. Robouch, N. Omenetto, Talanta 38 (1991) 999.
[23] V. Moulin, J. Tits, C. Moulin, P. Decambox, P. Mauchien, O. de Ruty, Radiochim. Acta 58/59 (1992) 121.
[24] P. Panak, R. Klenze, J.I. Kim, H. Wimmer, J. Alloys Compd. 225 (1995) 261.
[25] C. Moulin, J. Wei, P. van Iseghem, I. Laszak, G. Plancque, V. Moulin, Anal. Chim. Acta 396 (1999) 253.
[26] H.S. Shin, G.R. Choppin, Radiochim. Acta 86 (1999) 167.
[27] L. Marang, P.E. Reiller, S. Eidner, M.U. Kumke, M.F. Benedetti, Environ. Sci. Technol. 42 (2008) 5094.
[28] L. Marang, Influence de la matière organique naturelle sur la spéciation des radionucléides en
contexte géochimique, Ph.D. Thesis, Université Denis Diderot (Paris VII), and CEA-R-6187 Report (ISSN 0429-3460), Paris, France, 2007, p. 178.
[29] L. Marang, S. Eidner, M. Kumke, M.F. Benedetti, P.E. Reiller, Chem. Geol. 264 (2009) 154. [30] K.A. Ghaleb, F. Viala, F. Miserque, L. Salmon, P.
Reiller, G. Moutiers, Appl. Spectrosc. 62 (2008) 213.
[31] J.-C.G. Bünzli, S. Comby, A.S. Chauvin, C.D.B. Vandevyver, J. Rare Earths 25 (2007) 257. [32] M.U. Kumke, S. Eidner, T. Kruger, Environ. Sci.
Technol. 39 (2005) 9528.
[33] C.J. Milne, D.G. Kinniburgh, E. Tipping, Environ. Sci. Technol. 35 (2001) 2049.
[34] J.D. Ritchie, E.M. Perdue, Geochim. Cosmochim. Acta 67 (2003) 85.
[35] J.I. Kim, G. Buckau, G.H. Li, H. Duschner, N. Psarros, Fresenius J. Anal. Chem. 338 (1990) 245.
[36] J.I. Kim, G. Buckau, R. Klenze, D.S. Rhee, H. Wimmer, Characterisation and complexation of humic acids, Report EUR 13181, Commission of the European Communities, Brussels, 1991, p. 111.
[37] M. Wolf, G. Buckau, S. Geyer, Isolation and characterization of new batches of Gohy-573 humic and fulvic acids, in: G. Buckau (Ed.), Humic Substances in Performance Assessment of Nuclear Waste Disposal: Actinide and Iodine Migration in the Far-Field. Second Technical Progress Report, Report FZKA 6969, Forschungszentrum Karlsruhe - Institut für Nukleare Entsorgung, 2004, pp. 111.
[38] G. Buckau, R. Artinger, P. Fritz, S. Geyer, J.I. Kim, M. Wolf, Appl. Geochem. 15 (2000) 171. [39] G. Buckau, R. Artinger, S. Geyer, M. Wolf, P.
Fritz, J.I. Kim, Appl. Geochem. 15 (2000) 819. [40] L. Marang, P. Reiller, M. Pepe, M.F. Benedetti,
Environ. Sci. Technol. 40 (2006) 5496.
[41] K. Schmeide, H. Zänker, K.H. Heise, H. Nitsche, Isolation and purification of aquatic humic
substances from the Bog "Kleiner Kranishsee", in: G. Buckau (Ed.), Effects of humic substances on the migration of radionuclides: Complexation and transport of actinides. First technical progress report, FZKA Report 6124, Forschungszentrum Karlsruhe - Institut für Nukleare Entsorgung, 1998, pp. 161.
[42] S. Pompe, A. Brachmann, M. Bubner, G. Geipel, K.H. Heise, G. Bernhard, H. Nitsche, Radiochim. Acta 82 (1998) 89.
[43] B.R. Judd, Phys. Rev. 127 (1962) 750. [44] G.S. Ofelt, J. Chem. Phys. 37 (1962) 511. [45] J.-C.G. Bünzli, Luminescent probes, in: J.-C.G.
Bünzli and G.R. Choppin (Eds.), Lanthanides Probe in Life, Chemical and Earth Sciences - Theory and Practice, Elsevier, 1989, pp. 219. [46] J.M. Monsallier, F.J. Scherbaum, G. Buckau, J.I.
Kim, M.U. Kumke, C.H. Specht, F.H. Frimmel, J. Photochem. Photobiol. A 138 (2001) 55.
[47] W. Hummel, U. Berner, E. Curti, F.J. Pearson, T. Thoenen, Nagra/PSI chemical thermodynamic data base 01/01, Report NTB 02-06, NAGRA, Parkland, FL, USA, 2002, p. .
[48] C.J. Milne, D.G. Kinniburgh, W.H. van
Riemsdijk, E. Tipping, Environ. Sci. Technol. 37 (2003) 958.
[49] R. de Levie, Advanced Excel for Scientific Data Analysis, Oxford University Press, 2005. [50] J.-C.G. Bünzli, J.R. Yersin, Inorg. Chem. 18
(1979) 605.
[51] W.D. Horrocks, Jr., D.R. Sudnick, J. Am. Chem. Soc. 101 (1979) 334.
[52] T. Kimura, Y. Kato, H. Takeishi, G.R. Choppin, J. Alloys Compd. 271/273 (1998) 719.
[53] S.T. Frey, M.L. Gong, W.D. Horrocks, Jr., Inorg. Chem. 33 (1994) 3229.
[54] A.-S. Chauvin, S. Comby, B. Song, C.D.B. Vandevyver, F. Thomas, J.-C.G. Bünzli,
Chemistry - A European Journal 13 (2007) 9515. [55] M. Fujiwara, S. Tsukahara, H. Watarai, Phys.
[56] J.W. Moore, R.G. Pearson, Kinetics and mechanism, third edition, John Wiley & Sons, New York, NY, USA, 1981.
[57] E.V. Sayre, S. Freed, J. Chem. Phys. 24 (1956) 1213.
[58] A. Bruccoleri, B.C. Pant, D.K. Sharma, C.H. Langford, Environ. Sci. Technol. 27 (1993) 889. [59] R.G. Zepp, P.F. Schlotzhauer, R.M. Sink,
Environ. Sci. Technol. 19 (1985) 74.
[60] Y. Takahashi, A. Tada, T. Kimura, H. Shimizu, Chem. Lett. (2000) 700.
[61] A. Piccolo, R. Spaccini, P. Conte, G. Fiorentino, S. Baiano, A. Nebbioso, The basis of a humeomic science, in: F.H. Frimmel and G. Abbt-Braun (Eds.), 13th meeting of the International Humic
Substances Society, July 31-August 4 2006, Vol. I, Karlsruhe, Germany, Universität Karlsruhe, 2006, pp. 185.
[62] B. Marmodée, J. de Klerk, M.U. Kumke, F. Ariese, C. Gooijer, J. Alloys Compd. 451 (2008) 361.
[63] M. Albin, W.D. Horrocks, Jr., Inorg. Chem. 24 (1985) 895.
[64] G. Plancque, V. Moulin, P. Toulhoat, C. Moulin, Anal. Chim. Acta 478 (2003) 11.
[65] G. Plancque, Y. Maurice, V. Moulin, P. Toulhoat, C. Moulin, Appl. Spectrosc. 59 (2005) 432. [66] F. Claret, T. Schäfer, J. Brevet, P.E. Reiller,
Environ. Sci. Technol. 42 (2008) 8809.
[67] T. Vercouter, P. Vitorge, B. Amekraz, C. Moulin, Inorg. Chem. 47 (2008) 2180.
[68] H.S. Shin, S.W. Rhee, B.H. Lee, C.H. Moon, Org. Geochem. 24 (1996) 523.
[69] M.F. Yeh, T. Riedener, K.L. Bray, S.B. Clark, J. Alloys Compd. 303 (2000) 37.
[70] S.T. Frey, W.D. Horrocks, Jr., Inorg. Chim. Acta 229 (1995) 383.
[71] W.D. Horrocks, Jr., D.R. Sudnick, Acc. Chem. Res. 14 (1981) 384.
[72] S.E. Burroughs, G. Eisenman, W.D. Horrocks, Jr., Biophys. Chem. 42 (1992) 249.
[73] N. Ollier, G. Panczer, B. Campagnon, G. Boulon, P. Jollivet, J. Lumines. 94 (2001) 197.
[74] M. Albin, B.M. Cader, W.D. Horrocks, Jr., Inorg. Chem. 23 (1984) 3045.
[75] G.R. Choppin, Z.M. Wang, Inorg. Chem. 36 (1997) 249.
[76] K. Schmeide, T. Reich, S. Sachs, G. Bernhard, Inorg. Chim. Acta 359 (2006) 237.
[77] T. Vercouter, Complexes aqueux de lanthanides (III) et actinides (III) avec les ions carbonates et sulfates. Etude thermodynamique par
spectrofluorimétrie Laser résolue en temps et spectrométrie de masse à ionisation électrospray, Ph.D. Thesis, Evry-Val d'Essonne, Evry, 2005, p. 253.
[78] V. Philippini, Mise en évidence d'un changement de la stoechiométrie du complexe carbonate limite au sein de la série des lanthanides(III), Ph.D. Thesis, Paris-Sud XI, Orsay, France and CEA-R-6178 Report (2008), 2007, p. 166. [79] J. Hur, M.A. Schlautman, J. Colloid Interface Sci.
264 (2003) 313.
[80] W.P. Johnson, G.B. Bao, W.W. John, Environ. Sci. Technol. 36 (2002) 608.
[81] E.R. Stabenau, R.G. Zika, Mar. Chem. 89 (2004) 55.
[82] A.M. Aucour, F.A. Tao, P. Moreira-Turcq, P. Seyler, S. Sheppard, M.F. Benedetti, Chem. Geol. 197 (2003) 271.
[83] B. Gu, J. Schmitt, Z. Chem, L. Liang, J.F. McCarthy, Environ. Sci. Technol. 28 (1994) 38. [84] K. Kaiser, Org. Geochem. 34 (2003) 1569. [85] P. Reiller, B. Amekraz, C. Moulin, Environ. Sci.
![Figure 3: Eu(III) 5 D 0 → 7 F 0 and 5 D 0 → 7 F 1 transitions in 0.1 M NaClO 4 at [Eu] = 10 -5 M, [HS] = 200 mg L -1 , pH 5, λ exc = 394.6 nm, D = 10 µs, W = 300 µs, 1800 lines.mm -1 grating](https://thumb-eu.123doks.com/thumbv2/123doknet/12988914.379058/11.892.200.696.87.677/figure-eu-iii-transitions-naclo-eu-lines-grating.webp)
![Figure 4: Eu(III) 5 D 0 → 7 F 2 transitions in 0.1 M NaClO 4 at [Eu] = 10 -5 M, [HS] = 200 mg L -1 , pH 5, λ exc = 394 nm, D = 10 µs, W = 300 µs, 1800 lines.mm -1 grating](https://thumb-eu.123doks.com/thumbv2/123doknet/12988914.379058/13.892.95.714.89.843/figure-eu-iii-transitions-naclo-eu-lines-grating.webp)