HAL Id: hal-00730777
https://hal.archives-ouvertes.fr/hal-00730777
Submitted on 11 Sep 2012HAL is a multi-disciplinary open access archive for the deposit and dissemination of sci-entific research documents, whether they are pub-lished or not. The documents may come from teaching and research institutions in France or abroad, or from public or private research centers.
L’archive ouverte pluridisciplinaire HAL, est destinée au dépôt et à la diffusion de documents scientifiques de niveau recherche, publiés ou non, émanant des établissements d’enseignement et de recherche français ou étrangers, des laboratoires publics ou privés.
Binding of moesin and ezrin to membranes containing
phosphatidylinositol (4,5) bisphosphate: A comparative
study of the affinity constants and conformational
changes
Ofelia Maniti, Nada Khalifat, Kriti Goggia, Fabien Dalonneau, Christophe
Guérin, Laurent Blanchoin, Laurence Ramos, Catherine Picart
To cite this version:
Ofelia Maniti, Nada Khalifat, Kriti Goggia, Fabien Dalonneau, Christophe Guérin, et al.. Bind-ing of moesin and ezrin to membranes containBind-ing phosphatidylinositol (4,5) bisphosphate: A com-parative study of the affinity constants and conformational changes. Biochimica et Biophysica Acta:Biomembranes, Elsevier, 2012, 1818 (11), pp.2839. �10.1016/j.bbamem.2012.07.004�. �hal-00730777�
Binding of Moesin and Ezrin to membranes containing phophatidylinositol
(4,5) bisphosphate: a comparative study of the affinity constants and
conformational changes
Ofelia Maniti1, Nada Khalifat2,3, Kriti Goggia1, Fabien Dalonneau1, Christophe Guérin4, Laurent Blanchoin4, Laurence Ramos2,3, Catherine Picart1
1
CNRS UMR 5628 (LMGP), Grenoble Institute of Technology and CNRS, 3 parvis Louis Néel, F-38016 Grenoble Cedex, France
2
Université Montpellier 2, Laboratoire Charles Coulomb UMR 5221, F-34095, Montpellier, France
3
CNRS, Laboratoire Charles Coulomb UMR 5221, F-34095, Montpellier, France
4
Laboratoire de Physiologie Cellulaire et Végétale, Institut de Recherches en Sciences et Technologies pour le Vivant, CEA/CNRS/INRA/UJF, F-38054 Grenoble, France
Abstract
The plasma membrane-cytoskeleton interface is a dynamic structure participating in a variety of cellular events. Moesin and ezrin, proteins from the ezrin/radixin/moesin (ERM) family, provide a direct linkage between the cytoskeleton and the membrane via their interaction with phosphatidylinositol 4,5-bisphosphate (PIP2). PIP2 binding is considered as a prerequisite step
in ERM activation. The main objective of this work was to compare moesin and ezrin interaction with PIP2-containing membranes in terms of affinity and to analyze secondary
structure modifications leading eventually to ERM activation. For this purpose, we used two types of biomimetic model membranes, large and giant unilamellar vesicles (LUVs and GUVs). The dissociation constant between moesin and PIP2-LUVs or PIP2-GUVs was found
to be very similar to that between ezrin and PIP2-LUVs or PIP2-GUVs. In addition, both
proteins were found to undergo conformational changes after binding to PIP2-LUVs. Changes
were evidenced by an increased sensitivity to proteolysis, modifications in the fluorescence intensity of the probe attached to the C-terminus and in the proportion of secondary structure elements.
Key words: ERM proteins, phosphoinositides, membrane-protein interaction, plasma
membrane, large unilamellar vesicles (LUVs), giant unilamellar vesicles (GUVs), fluorescence spectroscopy, infrared spectroscopy, secondary structure
Introduction
Through their role of linkers between the membrane and the underlying cytoskeleton, ezrin/radixin/moesin family of proteins (ERM) organize complex membrane domains, determine cell shape, participate in fundamental processes such as adhesion, motility, blebbing, villae organization, endocytosis or exocytosis and are abundant in subcellular structures such as ruffles, microvilli, apical junction, immunological synapse, lamellipodia and pseudopodia [1, 2]. Invertebrates only express one essential isoform whereas the three isoforms are present in vertebrates but with distinct preferential localizations [2]. Ezrin was first isolated in gastric parietal cells, and is mostly present in epithelial cells, whereas moesin is predominantly found in endothelial cells, and radixin in hepatocytes [1]. Such partitioning suggests a functional diversity for the three ERM proteins. However, how the three ERM proteins can play different roles in the cell is still largely unknown. Moesin-deficient mice do not show any differences with respect to the wild type phenotype [3] and exhibit an
up-regulation of ezrin and radixin expression, while radixin-deficient mice exhibit some defects in bile canaliculi membranes [4]. This suggests that one ERM can take over functions specific to the other members of the ERM family. The only lethal mutation was that of ezrin and was linked to ezrin function in gastric epithelial cell membrane organization, as ezrin-deficient mice showed defects in the gastrointestinal tract and died within 3 weeks of age [5].
Among the ERM members, ezrin has often been associated to tumor metastasis [6-9]. Recently, Estecha and co-workers also attributed a particular role to moesin in the early steps of melanoma tumor cell invasion of 3D collagen matrices and in transmigration of endothelial cells [10]. The same study showed that ezrin and moesin are differentially distributed, with a stable cortical actin dome enriched in moesin and blebs enriched in ezrin. Ezrin and moesin have an important role in the formation of the immunological synapse [11, 12]. Both proteins are present in the distal pole complex but differences in the phosphorylation and interactions with other cytosolic proteins have been observed [12]. Moesin is also known to participate to virus entry into cells. HIV-1 envelope proteins were shown to induce ERM phosphorylation in lymphocytes. Furthermore, active moesin and to a lesser extent ezrin, was shown to drive F-actin redistribution to cell contacts during initial HIV-1 entry [13].
From a structural point of view, ERM proteins are closely related with 73 % sequence identity between ezrin and moesin and 76% between ezrin and radixin [2]. They all share three important domains : an N-terminal membrane binding domain (FERM domain), which can bind the membrane via phosphatidylinositol (4,5)-bisphosphate (PIP2), a α-helical linker
region and a C-terminal actin-binding domain (Fig. 1). All ERM proteins undergo inter-conversion between an inactive and active conformation. In the inactive (or closed) state, the FERM domain and the C-terminal domain interact, thus hiding the F-actin binding region [14]. Activation is believed to open the molecule and unmask the site of interaction with F-actin. Membrane binding, is an essential step in ERM activation [15-17] and to their localization at the membrane [18, 19]. Phosphorylation is also thought to be involved in a second step [16]. However, the molecular mechanism of this activation is not completely elucidated, so far. One of the key interaction partners at the membrane level is PIP2, a lipid
largely involved in regulating the organization and dynamics of the actin cytoskeleton (for review see [20]).
To date, very little is known about moesin affinity for lipids in vitro. Thus, a primary aim of this work was to quantify moesin binding to model membrane containing PIP2 and compare it
to the results previously obtained for ezrin [21]. Information about the secondary structure ERM protein once bound to a lipid membrane is also very scarce. In this work, conformational changes of ezrin and moesin after binding to large unilamellar vesicles (LUV) containing PIP2 were analyzed. First, we investigated whether the environment of
fluorophores (tryptophan residues and an Alexa 546 probe attached to the C-terminal end of ezrin and moesin) was modified after membrane binding. The results were in line with a less compact structure of the molecule, which was confirmed by limited proteolysis experiments. Second, infrared spectroscopy was used to quantitatively analyze the secondary structure of ezrin and moesin in solution and to compare it to that of membrane-bound proteins.
Materials and methods
Protein expression and purification
Wild-type (WT) ezrin was purified as previously described [22]. Briefly, GST-tagged ezrin gene was cloned in the pGEX2-T vector and transformed in Rosetta 2 E. Coli bacteria (VWR). Bacteria were routinely grown in Luria Bertani medium supplemented with 500 mM NaCl, 100 mg/ml ampicillin and 34 mg/ml chloramphenicol. Protein expression was induced with IPTG (0.5 mM) at a DO600 of 0.6 and bacteria were harvested by centrifugation after
overnight incubation and lysed by ultrasound in PBS pH 7.4 10 mM EDTA 0.5 mM DTT buffer. After removal of the bacterial debris, the supernatant was incubated with glutathione sepharose beads (GE healthcare) for 2 hours at 4°C. Ezrin was removed from the beads by cleaving the GST moiety with thrombin (Sigma), in a 20 mM TrisHCl pH 7.4 100 mM NaCl 0.5 mM DTT buffer. The protein was then dialysed against a 25 mM Mes pH 6.2 20 mM NaCl 0.5 mM DTT buffer. As at this point several contaminant bands being present on SDS-PAGE, the ezrin solution was further purified on an anionic exchange chromatography column (GE Healthcare) in 25 mM Mes pH 6.2 buffer using a NaCl gradient from 20 mM to 1M. Ezrin was eluted from the column at 70 mM NaCl. One liter of bacterial culture yielded about 1-2 mg of protein. WT-Moesin was prepared according to the same procedure, except anionic exchange chromatography. Indeed, after GST-tag removal, moesin was pure and did not require additional purification. One liter of bacterial culture yielded about 3-4 mg of protein.
For labeling purposes an additional cystein residue was added at the C-terminal end of the ezrin or moesin. The quick change site-directed mutagenesis kit from Stratagene (Stratagene Europe, Netherlands) was used for this purpose. Constructions were verified by sequencing. All proteins (~1mg/ml) were stored at 4°C for 4 weeks in 25 mM Mes pH 6.2 70 mM NaCl 0.5 mM DTT, 1 mM NaN3 buffer.
Vesicle preparation
Large unilamellar vesicles (LUVs) made of POPC, POPC/PIP2 95/5 (w/w), and POPC/PS
80/20 (w/w) were prepared by drying the appropriate lipid mixture in a Speedvac rotary evaporator (Eppendorf) and hydrating the lipids with the appropriate buffer for 1h30 at 37°C. Lipid emulsion was then submitted to 5 freeze-thaw cycles (5 min liquid nitrogen/10 min 37°C) followed by extrusion through a stack of two polycarbonate filters (100 nm pore diameter, 21 passages) using a miniextruder (Avanti Polar Lipids). LUVs were stored at 10 mg/ml total lipid concentration for no more than 2 weeks at 4°C.
Giant unilamellar vesicles (GUVs) were electroformed following a procedure adapted from [23]. The appropriate lipid mixtures [PC and PC/PIP2 (87/13) (w/w)] in
chloroform/methanol/water (93.5:6:0.5 v/v) at 2 mg/ml were spread on ITO-coated plates and dried under vacuum for 2h. An electroformation chamber was then formed using the ITO plates and a rubber spacer. The chamber was sealed with Vitrex paste and placed in an incubator at 38°C. An AC electrical field (10 Hz, 0.2 V) was applied before filling gently the chamber with a buffer solution (1.5 ml, pH 7.4, TRIS-HCl 2mM, EGTA 0.5 mM, sucrose 165 mM). The voltage was progressively increased from 0.2 V to 2 V within 2h30min. The voltage and frequency were subsequently kept constant at 1V and 4 Hz for 20 min before switching off the AC field. The as-formed GUVs were kept 1h in the incubator and then stored at room temperature and used for confocal imaging the same day.
Cosedimentation assays
Moesin affinity for phospholipids was determined by sedimentation assays with sucrose loaded LUVs as previously described for ezrin [21]. Sucrose-loaded LUVs were prepared in 25 mM Hepes pH 7.2, 200 mM sucrose 1 mM EDTA buffer. The cosedimentation assays were performed in 25 mM Hepes 7.2, 100 mM KCl, 1 mM EDTA buffer by varying the concentration of total lipid, while keeping the percentage of PIP2 in LUVs constant. For these
experiments, moesin concentration was kept constant at 0.4 µM. After incubation for 15 min at room temperature, the 100 µL samples were centrifuged at 16 000 x g for 1 h 30 min at 4°C. The top 80 µL of each sample were removed, supplemented with 10 µL 0.2 % Triton and considered as supernatant (SN). 10 µL of 0.2 % Triton and 60 ml of KCl buffer were used to resuspend the pellet (P). For experiments with labeled protein, SN and P intensities were
directly read in a 96 well black plate (Nunc) using TECAN infinite 1000 fluorimeter with excitation and emission slits set, respectively, at 490 and 521 nm.
Alternatively, for experiments performed using unlabeled ezrin, SN and P were analyzed on a 10% SDS-PAGE, stained using Coomassie blue. Quantification was achieved using Image J 1.36b (National Institutes of Health, Bethesda, MD) (the mean density of each band was background corrected and was checked to be in the linear range of the scanner). Since 20 µL of the supernatant were counted as pellet and since the supernatant and pellet resuspension volume were identical, the true pellet intensity was calculated using the formula:
IPellet = Imesured - 0.25 x ISN, where IPellet and ISN are the intensity of the pellet and supernatant,
respectively. The corresponding percentage of protein bound was calculated as IPellet x 100/
(IPellet + ISN)).
Quantitative confocal imaging of ezrin and moesin interaction with GUVs
Confocal microscopy observations of GUVs were carried out on a spinning disk Rapid confocal imager Ultra View ERS (Perkin Elmer) mounted on an inverted microscope with a 100x oil objective. Fluorescent images were analyzed with ImageJ software. The fluorescence intensity was normalized so that the resulting intensity was equal to 0 in the interior of the GUV (where the measured intensity was the noise signal) and equal to 1 in the external medium (where the measured intensity is the background intensity of the protein medium). Adsorption of protein on GUVs was quantified by averaging the normalized fluorescent intensity at the membrane of the GUV. Results are average values over typically 30 vesicles. Details of the visualization protocol and image analysis are given in supplementary material.
Fluorescence measurements
Tryptophan fluorescence emission spectra of WT ezrin and WT moesin (0.4 µM), and fluorescence spectra of moesin-Alexa546 and ezrin-Alexa546 (0.4 µM) were recorded in the absence or after addition of increasing amounts of PIP2-LUVs (1 mg/ml, 1.7 mg/ml and 2.3
mg/ml lipids) using a TECAN infinite 1000 fluorescence spectrometer. For tryptophan fluorescence, the excitation wavelength was set at 280 +5nm and the emission was acquired over 300-400 nm (+5nm). For Alexa546 fluorescence, the excitation wavelength was set at 540 + 5nm nm and the emission was acquired over 555-650 nm (+5nm). Each spectrum is the average of at least 9 independent measurements.
Fourier transformed infrared spectroscopy
LUVs at 20 mg/mL total lipids were prepared in a deuterated Hepes-KCl buffer. Proteins were lyophilized in a Speedvac rotary evaporator (Eppendorf, France) and resuspended in a deuterated MES-NaCl buffer. Lipids and proteins were mixed so that the final concentrations were 10 mg/ml and 1 mg/mL (14 µM), respectively for lipids and proteins. For control experiments, spectra of the LUVs suspension in the same buffer were recorded. Samples were loaded in an Aquaspec cell and analyzed using a Vertex V70 FTIR apparatus (both from Bruker Optics GmbH, Germany), continuously purged with dry air. The nominal spectral resolution was 4 cm-1. The spectra shown were corrected from the contribution of the buffer and of the residual water vapor. Every infrared spectrum was representative of at least 3 independent measurements. Deconvolution spectra were obtained with Opus software (Bruker) after determination of the peak position using the second derivative of the spectra.
Limited proteolysis experiments
Ezrin or moesin (0.8 µM) were incubated in the Hepes-KCl buffer with 2 mg/ml PIP2-LUVs
or with the appropriate volume of buffer for 15 min. Note that the concentrations of protein and LUVs were chosen such that the % of protein bound to LUVs was maximum (80%).
Proteolysis was initiated by addition of 15 µM (respectively 1.5 µM) chymotrypsin to samples containing moesin (respectively ezrin) and followed over a 90 min time period. The reaction was stopped at specified time laps by addition of 1 mM protease inhibitor (phenylemethane sulfonyl fluoride). 20 µL of each sample were run on a 10 % SDS-Page electrophoresis gel and stained with Coomassie blue. Quantification of the gels was done using ImageJ software. The percentage of intact (full length) protein at time t was calculated as the ratio between the intensity of the full length band (69 kDa for ezrin, 68 kDa for moesin) at time t over its value immediately after addition of chymotrypsin.
Results:
1. Comparative study of the binding of ezrin and moesin to PIP2
Fluorescence confocal imaging was first used to compare the binding of ezrin and moesin on the biomimetic membrane of GUVs that contain PIP2. Once immersed in a protein suspension
comprising fluorescent proteins in large excess with respect to PIP2, we found that almost all
PIP2-GUVs displayed a fluorescent membrane, whereas PC-GUVs showed no adsorption of
the fluorescent protein at the membrane. In order to assess the binding affinity of WT and fluorescent proteins for the PIP2-GUV membrane, experiments were performed by plunging the PIP2-GUVs in various protein mixtures comprising one fluorescent protein (either
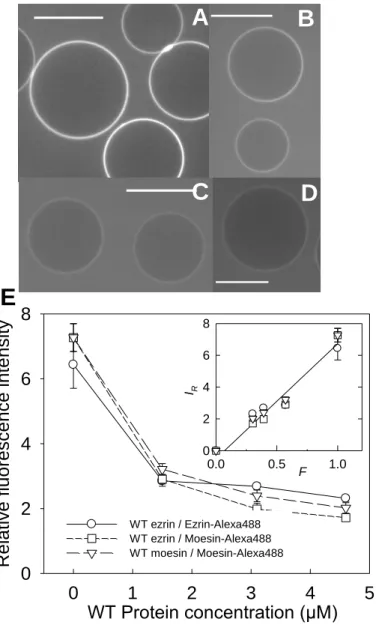
ezrin-Alexa488 or moesin-ezrin-Alexa488) at a fixed concentration of 2 µM and various concentrations of WT proteins. Typical confocal images are reported in Fig. 2A-D for mixtures of fluorescent moesin and WT ezrin prepared at increasing concentrations of WT ezrin. We observed a decrease in the fluorescence intensity at the membrane when the concentration of WT protein increased. To quantify this effect, we measured the normalized fluorescence intensity at the membrane as a function of the concentration of WT proteins (Fig. 2E). Data obtained in the experimental conditions (WT and fluorescent ezrin, WT and fluorescent moesin, and WT ezrin and fluorescent moesin) all collapsed on a unique curve. The fluorescence intensities at the membrane continuously decreased in all conditions. This is precisely what is expected if both fluorescent and WT protein interact similarly with the membrane. Interestingly, we found that the fluorescence intensity was proportional to the fraction of fluorescent protein in the protein mixture, as shown in the inset of Fig. 2E. This demonstrates that the WT and fluorescent proteins have equivalent binding affinity for the membrane of PIP2-GUVs.
To assess on a more quantitative basis the affinities between the proteins and PIP2, we used
co-sedimentation assays and measure the dissociation constant (Kd) between the protein and
PIP2-LUVs. We recently determined the Kd value for ezrin intractions with PIP2-LUVs [21].
Here, various concentrations of sucrose loaded PIP2-LUVs were incubated in a buffer
containing WT moesin at a fixed concentration (0.4 M). Centrifugation allows the vesicle-bound moesin (in the pellet) to be separated from the soluble protein (in the supernatant). Typical images of SDS-PAGE gels representing the pellets and the supernatants are shown in Fig. 3A for increasing lipid concentrations. In figure 3B the percentage of moesin bound is represented as a function of the accessible acidic lipid concentration. We found that the percentage of bound moesin increased with the increasing amount of PIP2-LUVs. The fit of
the experimental data lead to a dissociation constant Kd = (5.6 + 0.7) µM, a numerical value
equal within experimental errors to that previously determined for ezrin in the same conditions Kd = (5.9 + 0.7) µM [21]. For comparison, experiments were also performed with
LUVs composed of POPC or of a mixture of POPC and PS (80/20), a negatively charged lipid. Results are also reported on Fig. 3B. Moesin showed no affinity for pure POPC LUVs (Fig. 3, triangles) and a very low affinity, of electrostatic origin, for PS-LUVs (Fig. 3,
squares). But data are too scattered in this case to determine a dissociation constant. Our results confirm quantitatively that moesin, similarly to ezrin [21], has binding specificity for PIP2 over PS. Of note, the binding of fluorescently labeled moesin (moesin-Alexa488) to
PIP2-LUVs, as measured by the cosedimentation assay, was also quantified by
spectrofluorimetry (Fig S1 in the Supporting Material). By this method, we found that moesin-Alexa488 binds to PIP2-LUVs with a dissociation constant Kd = (10.7 + 1.8 µM), a
value comparable to that obtained with WT moesin. Thus, the cystein mutation and the labelling with the Alexa dye did not induce major modification in moesin binding to PIP2
-LUVs.
Furthermore, co-sedimentation experiments were performed using protein mixtures with increasing moesin/ezrin ratio. The fraction of moesin bound to PIP2-LUVs was equal to that
of moesin in the initial mixture (Fig S2 in the Supporting Material), which confirmed the similar affinity of ezrin and moesin for PIP2.
2. Conformational changes of ezrin and moesin after binding to PIP2-LUVs
Fluorescence and FTIR spectroscopy were used to investigate the effect of PIP2-binding on
the internal structure of the proteins and on the fluorescence of tryptophan residues and of the Alexa dye. Fig. 4 shows the evolution of the tryptophan fluorescence emission spectra of WT ezrin (A) and moesin (B) upon addition of increasing concentrations of PIP2-LUVs. We did
not detect any shift in the position of the maximum emission wavelength, but we recorded a systematic decrease in the fluorescence emission intensity. To discriminate between an effect due to scattering phenomena after addition of vesicles and a change in the environment of tryptophan residues, the quenching (at the maximum emission wavelength) was also measured after addition of equal amounts of LUVs composed uniquely of POPC with which the proteins do not interact. We found that the quenching of tryptophan fluorescence in ezrin (Fig. 4A’) or moesin (Fig. 4B’) was systematically and significantly higher after addition of PIP2-LUVs than after addition of LUVs. The low quenching in the presence of
POPC-LUVs was indeed comparable to the quenching measured after addition of buffer. Thus, our measurements indicate a specific effect of membrane binding on the environment of tryptophan residues.
In addition, we investigated whether the fluorescence of the Alexa dye, which was grafted at the C-terminus of the proteins, was affected by binding of the proteins to PIP2-LUVs. The
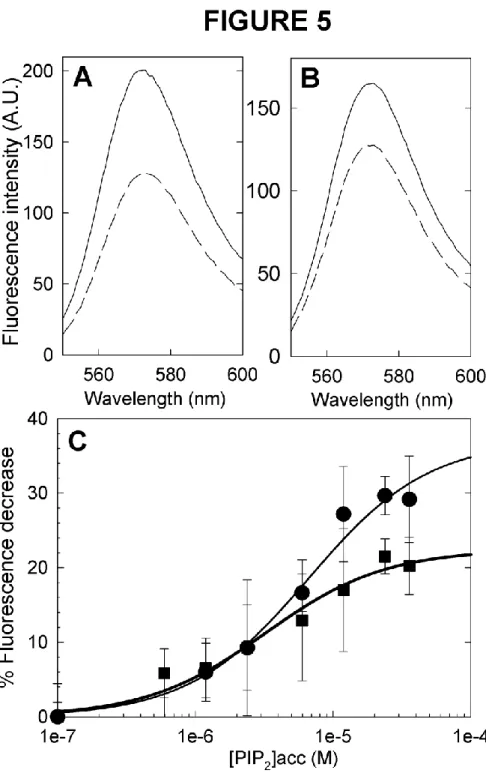
fluorophore is located at the C-terminal end of the proteins that is not expected to interact with the lipid membrane. Thus, its fluorescence is not expected to be directly affected by membrane binding. Instead, it should be sensitive to a conformational change of the protein. For both ezrin and moesin, we recorded a decrease of the fluorescence of Alexa546 after binding to PIP2-LUVs (Fig. 5A and B). The percentage of quenching as function of the
accessible PIP2 concentration in LUVs followed a sigmoidal shape (Fig. 5C), which can be
fitted using a first order ligand binding model. This yielded a dissociation constant Kd of (6.6
+ 1.8) µM for ezrin and of (3.2 + 0.7) µM for moesin. These values were comparable to the ones obtained by co-sedimentation assays.
In order to assess whether fluorophore quenching was in favor of a looser structure of the proteins, which would support the hypothesis of molecule opening after membrane binding, ezrin and moesin were submitted to the action of chymotrypsin. The action of chymotrypsin was studied on proteins in the absence of PIP2-LUVs, as well as for proteins interacting with
PIP2-LUVs. The proteolysis reaction was followed by SDS-PAGE (Fig. 6). The intensity of
the band corresponding to full length moesin (68 kDa) progressively diminished with time and completely disappeared after 60 min (Fig. 6A). Moesin digestion by chymotrypsin was
faster when the protein was bound to the PIP2-LUVs membrane. In this case, the protein was
completely degraded after 10 min (Fig. 6B). For ezrin, the same amount of chymotrypsin (15 µM) completely degraded the protein in less than 5 min (data not shown), meaning that ezrin was much more sensitive to proteolysis than moesin. The chymotrypsin concentration was thus reduced from 15 to 1.5 µM. In these conditions, ezrin was degraded in 30 min in the absence of vesicles (Fig. 6D) and in 5 to 10 min in the presence of PIP2-LUVs (Fig. 6E). The
main degradation band for both proteins was situated between 38 and 43 kDa and can be attributed to a fragment roughly corresponding to the FERM domain [15, 24]. The time evolution of the intensity of the full length protein band is plotted in Fig 6C and F, for moesin and ezrin respectively. Considering that in the initial step (over the first 5-10 min of incubation), the concentration of full length protein linearly decreased with time, the degradation rate of moesin was estimated at 0.11 mg moesin/min/nmole chymotrypsin in the absence of vesicles and at 0.19 mg moesin/min/nmole chymotrypsin in their presence. For ezrin, the degradation rate was estimated at 1.71 mg ezrin/min/nmole chymotrypsin in the absence of vesicles and at 6.19 mg ezrin/min/nmole chymotrypsin in the presence of PIP2
-LUVs. Of note, as described in the Materials and Methods section, the purification protocol of ezrin requires an additional purification step using an anionic exchange chromatography, as degradation contaminants are present after separation of the GST-tagged protein on glutathione beads. This is in line with the higher sensitivity of ezrin to proteolysis [25]. Altogether, these results indicate that both moesin and ezrin become more accessible to the action of chymotrypsin after membrane binding.
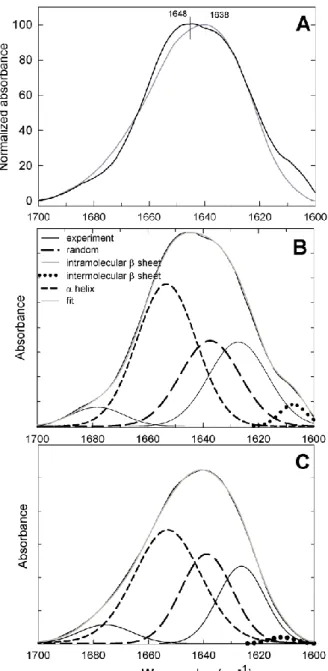
Finally, we compared the secondary structure of ezrin and moesin before and after binding to lipid membrane containing PIP2. Fig. 7A shows infrared spectra of moesin and ezrin in the
amide I region (1600-1700 cm-1) in the absence of lipids. Despite high primary sequence homology, infrared spectra of moesin and ezrin presented noticeable differences. In particular, the maximum position of the amide I band was shifted from 1638 cm-1 for moesin to 1646 cm
-1
for ezrin. Second derivatives of the spectra allowed us to locate the peak positions corresponding to four major types of secondary structures (Figure 7B and C), which are typically observed for proteins [26-28]: -helix, intramolecular -sheets (with two contributions at low and high wavenumbers), random coils and intermolecular -sheets. From the best fits of ezrin and moesin spectra (Figure 7B and C), the percentages of each type of secondary structure was calculated (Table 1). -helices represented 42 % of ezrin and 46 % of the secondary structure of moesin, respectively. An important antiparallel β-sheet contribution was also identified at 1626 cm-1 together with the corresponding high wavenumber contribution at 1678 cm-1. These accounted for 30 % of ezrin and for 27 % of moesin structural elements. A third contribution from coil structures was also present and accounted for 25 % of ezrin and 27 % of moesin secondary structure. Of note, ezrin spectrum, and to a much lower extent moesin spectrum, showed a very small shoulder at 1610 cm-1, which can be attributed to the presence of intermolecular β-sheets.
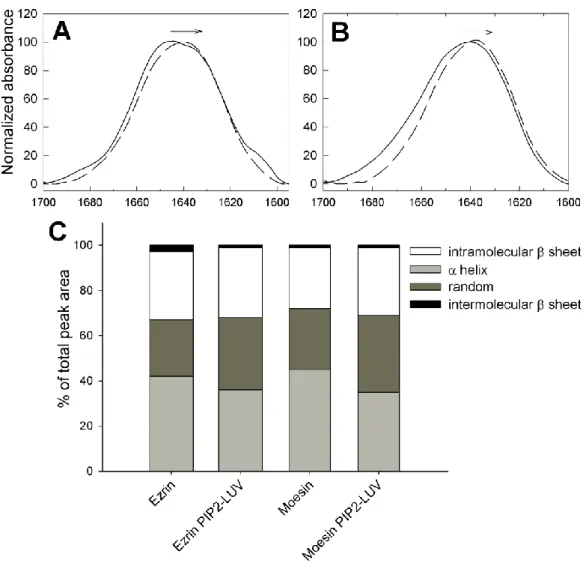
The presence of PIP2-LUVs induced noticeable changes in the infrared spectra of both
proteins (Fig. 8A and B). First, for both proteins, lipid binding resulted in an apparent shift of maximum absorption of the amide I band toward lower wavenumbers (see arrows in Figure 8A and B) together with a decrease in the contributions in the -helix region (1650-1655 cm
-1
). Deconvolution of the spectra from figure 8 A and B confirmed these observations (Figure 8C and Table 1). The content of -helices decreased from 42 to 36% for ezrin and from 46% to 35% for moesin in the presence of PIP2-LUVs. Conversely, the random coil contribution
increased from 25 to 32% for ezrin and from 27 % to 34% for moesin. The β-sheet contribution remained unchanged. Of note, the contribution at very low wavenumbers was
barely visible in the presence of PIP2-LUVs. This indicated that intermolecular β-sheet
interactions were reversible.
All together, the infrared spectra prove that conformational changes occurred after binding of ezrin and moesin to PIP2-LUVs, with a decrease of -helices and a concomitant increase of
random coils.
Discussion:
Moesin and ezrin show similar affinities for PIP2
Moesin and ezrin, two members of the ERM family of proteins, share a similar structure and a high primary sequence homology [1, 2]. However, recent reports point out differential roles in several physiological and pathological situations such as cell metastasis [10] or the formation of the immunological synapse [11, 12]. A number of biophysical studies have shed some light on ezrin interaction with membranes. We have previously shown that ezrin has a moderate but specific affinity for PIP2-containing LUVs (dissociation constant of the order of 5 µM) [21].
Ezrin interacts with a 1:1 stoichiometry with PIP2 incorporated in the membrane of LUVs and
the interaction was found to be cooperative for PIP2 inserted in solid supported bilayers [29].
Ezrin also showed the capacity of forming multimers in the presence of PIP2 added in solution
[24]. It formed ezrin-rich domains on PIP2-SLBs [29] and induced PIP2-clustering on giant
unilamellar vesicles (GUVs) [23]. These experiments on synthetic membranes suggested that ezrin could modulate PIP2 distribution at the plasma membrane. Moesin recruitment at the
membrane and its subsequent phosphorylation during Drosophila development also requires PIP2 binding [30]. In that study, co-sedimentation experiments revealed that moesin interacted
with PIP2-containing liposomes. However, to our knowledge, there was no quantitative
analysis of moesin binding to PIP2, nor comparative data on ezrin and moesin structure in
solution versus membrane-bound. Furthermore, as literature suggests that ezrin and moesin show some functional disparities, despite very similar structures, there was a call for comparing their behaviour upon membrane binding.
Therefore, in a first step, we determined the dissociation constant, Kd, for moesin and lipid
membranes made of a mixture of POPC and PIP2 (95/5 w/w). Co-sedimentation assays using
WT and fluorescent moesin, yield comparable numerical values for Kd with an average Kd =
(6.56 + 3.8) µM. Notably, the Kd value found by analysis the fluorescence of the fluorescent
tag of moesin or ezrin gave a similar value. These values were moreover comparable to those previously determined for ezrin [21]. They are also in the same order of magnitude as that of other membrane associated proteins such as a fragment from N-WASP [31] or talin [32]. The interaction of moesin with the LUV membranes was specific to PIP2. These measurements
were complemented by quantitative confocal imaging on the interaction of fluorescent proteins with the lipid membrane of GUVs made of PC/PIP2 (87/13 w/w). By using mixtures
of ezrin and moesin in different proportions, we demonstrated by quantitative confocal image analysis of PIP2-GUVs, the absence of preferential binding of one of the two proteins on PIP2
-containing membranes. The fact that both proteins bind similarly is a prerequisite to account for the fact that ezrin could take over the function of moesin in moesin-deficient mice [3]. In
cellulo, some differences in moesin and ezrin distribution have been observed. For instance, a
different behaviour between moesin and ezrin has been found during the formation of the immunological synapse [11]. In tumor cells, moesin was present at the dorsal surface of migrating cells whereas ezrin was localized in blebs [10]. We suggest that these differences in protein distribution cannot be attributed to preferential affinity for PIP2. Other protein
partners, such as transmembrane receptors that can interact with ezrin or moesin, or other cytoplasmic proteins may play a role in the specific location observed in cellulo.
Conformational changes of ezrin and moesin after membrane binding
It is generally accepted that all ERMs exist in an apparently dormant, closed conformation and that release of the C-terminal domain from the FERM domain is necessary for their full activation and for their function as membrane-cytoskeleton linkers. Membrane binding plays a crucial part in this activation process. However, the mechanisms and the structural elements involved are not completely characterized.
Tryptophan residues embedded in protein structures are known to be sensitive to the polarity of the surrounding molecules. This implies that any change in the protein conformation that affects the surroundings of these residues will be reflected by changes in the intrinsic fluorescence of these residues. This fluorescence intensity is a measure of the fluorophore quantum yield and/or in the wavelength of maximum fluorescence emission, depending on whether the tryptophan residues are exposed or buried due to the protein conformational changes. Ezrin and moesin possess 7 tryptophan residues, of which 6 are located in the FERM domain and one is located in the linker region. Upon interaction with PIP2-LUVs, no shift in
the tryptophan emission spectrum was noted, but rather a marked decrease in its fluorescence (Fig. 4), in line with previous observations on ezrin interaction with soluble PIP2 [24]. This
quenching can be interpreted as due to tryptophan residues becoming more accessible to water molecules.
Interestingly, the fluorescence emission of the Alexa546 fluorophore grafted at the C-terminus of the ezrin and moesin was also affected by binding to PIP2 membranes (Fig 5). A control experiment revealed that the fluorescence of Alexa 546 decreased with solvent polarity (data not shown). As the C-terminal region of the proteins does not directly interact with the membrane, we interpreted the decrease in the intensity of the Alexa546 as a consequence of the conformational change: upon opening of the protein, the C-terminal domain became more accessible to water molecules. Limited proteolysis experiments (Fig. 6) further support the hypothesis of molecule opening. Indeed, both ezrin and moesin were more rapidly degraded by chymotrypsin after binding to PIP2-LUVs, in line with an increased
accessibility of proteolysis sites due to this conformational change. As previously described [15, 24]The main degradation band of both proteins corresponded to the FERM domain, which indicated that the chymotrypsin sensitive regions were outside this domain. In the absence of lipids, ezrin was much more sensitive to the action of the protease than moesin. This observation can be explained by the presence of 9 aromatic residues in the linker and C-terminal domain of ezrin which are preferential cleavage site of chymotrypsin, while only 3 such residues are present in moesin primary structure. Our results are in line with those of Shcherbina et al. [25], who found an increasing sensitivity of ezrin for the protease calpain as compared to moesin.
Although the crystallographic structure of full length moesin of S. frugiperda has been solved in 2007, there is, to our knowledge, only few quantitative data available on the secondary structure of full length ezrin [33] and none available for moesin in solution. Here, using infrared spectroscopy, we obtained quantitative information on the different types of secondary structures present in the full length proteins (Fig. 7). As could be anticipated from the crystallographic structure (Fig. 1), the most prominent type of secondary structure was -helices, which represented 42 % and 46 % of ezrin and moesin. This was followed by two important contributions of -sheets and random coils, at 30% and 30-34 %, respectively. The fraction of -helices reported in the X-ray crystallographic structure of insect moesin [34] were of 49 % for -helices, 37% for random coils and 13% for -sheets. Thus, our experimental data agree with these, except that we systematically find, for moesin as well as for ezrin, a higher fraction of sheets. Of note, a recent study by circular dichroism reported
for full length ezrin values of 71 % -helix, which were above the X-ray predictions, 18% for random coils and only of 4 % sheets [33], which were both below the X-ray predictions. The most prominent change observed after binding to PIP2-LUVs was a decrease of the
proportion of -helices in favour of random coil structures (Fig. 8 and Table 1). Which protein domain is more likely to be affected? A first tempting hypothesis is the -helical linker that may unwind after molecule opening. However, the isolated linker domain of radixin was described as a stable helical rod of an unusual length [35]. Conformational changes may also take place in the FERM domain, which is directly affected by membrane binding. Comparison of crystallographic data on the FERM domain in the absence [36] or presence of the C-terminal domain [14] or of IP3 [37] showed essentially the same
organisation of the three subdomains. Important displacements were observed locally [36, 37], but not with an obvious loss of secondary structure elements. However, it is interesting to note that Kitano et al. [38] identified a “chameleon” region at the end of the radixin FERM domain. In fact, this region had the capacity to form either -sheets or -helices, depending on the environment.
We can also hypothesize that the loss of α-helical structures after membrane binding occurred in the C-terminal domain once interactions with the FERM domain are disrupted. Further experiments are however needed to investigate whether this structural change is sufficient to completely release the FERM domain from the C-terminal and allow interaction with actin filaments via amino acids located at the end of the C-term domain [39]. It remains also to be assessed whether phosphorylation on residue T559/T567 plays a major role in ERM activation, or whether, as recently suggested, regulation via PIP2 binding could be sufficient
to control moesin distribution and activity. In this case, phosphorylation on residue T559 would not be essential in the opening process [40].
To sum up, the secondary structures of moesin and ezrin showed similarities and both proteins were found to bind with similar affinities to PIP2-LUVs and PIP2-GUVs. Tryptophan and
Alexa546 fluorescence quenching points out to a change in the environment of the fluorophores after membrane binding. Ezrin and moesin bound to PIP2-LUVs were more
sensitive to proteolysis, which indicates that the two ERM proteins adopt a looser structure after binding to a lipid membrane. This is consistent with the infrared spectra of proteins interacting with PIP2-LUVs, which showed a decrease in the α-helical content together with
an increase in the random coil proportion, as compared to proteins in solution.
Acknowledgements
This work was supported by an ANR PCV 2008 grant to C.P, L.R. and L.B. and by an ERC Starting Grant 2010 (GA259370) to C.P. C.P. is a Junior Member of the Institut Universitaire de France whose support is gratefully acknowledged. The authors thank Christian Roy for fruitful discussions and technical suggestions. The authors thank E. Dambroise and D. Gulino-Debrac for Moesin cDNA construct.
References
[1] R.G. Fehon, A.I. McClatchey, A. Bretscher, Organizing the cell cortex: the role of ERM proteins, Nat Rev Mol Cell Biol, 11 (2010) 276-287.
[2] V. Niggli, J. Rossy, Ezrin/radixin/moesin: versatile controllers of signaling molecules and of the cortical cytoskeleton, Int J Biochem Cell Biol, 40 (2008) 344-349.
[3] Y. Doi, M. Itoh, S. Yonemura, S. Ishihara, H. Takano, T. Noda, S. Tsukita, Normal development of mice and unimpaired cell adhesion/cell motility/actin-based cytoskeleton
without compensatory up-regulation of ezrin or radixin in moesin gene knockout, J Biol Chem, 274 (1999) 2315-2321.
[4] S. Kikuchi, M. Hata, K. Fukumoto, Y. Yamane, T. Matsui, A. Tamura, S. Yonemura, H. Yamagishi, D. Keppler, S. Tsukita, S. Tsukita, Radixin deficiency causes conjugated hyperbilirubinemia with loss of Mrp2 from bile canalicular membranes, Nat Genet, 31 (2002) 320-325.
[5] I. Saotome, M. Curto, A.I. McClatchey, Ezrin is essential for epithelial organization and villus morphogenesis in the developing intestine, Dev Cell, 6 (2004) 855-864.
[6] B.E. Elliott, J.A. Meens, S.K. SenGupta, D. Louvard, M. Arpin, The membrane cytoskeletal crosslinker ezrin is required for metastasis of breast carcinoma cells, Breast Cancer Res, 7 (2005) R365-373.
[7] K.W. Hunter, Ezrin, a key component in tumor metastasis, Trends Mol Med, 10 (2004) 201-204.
[8] C. Khanna, X. Wan, S. Bose, R. Cassaday, O. Olomu, A. Mendoza, C. Yeung, R. Gorlick, S.M. Hewitt, L.J. Helman, The membrane-cytoskeleton linker ezrin is necessary for osteosarcoma metastasis, Nat Med, 10 (2004) 182-186.
[9] Y. Yu, J. Khan, C. Khanna, L. Helman, P.S. Meltzer, G. Merlino, Expression profiling identifies the cytoskeletal organizer ezrin and the developmental homeoprotein Six-1 as key metastatic regulators, Nat Med, 10 (2004) 175-181.
[10] A. Estecha, L. Sanchez-Martin, A. Puig-Kroger, R.A. Bartolome, J. Teixido, R. Samaniego, P. Sanchez-Mateos, Moesin orchestrates cortical polarity of melanoma tumour cells to initiate 3D invasion, J Cell Sci, 122 (2009) 3492-3501.
[11] T. Ilani, C. Khanna, M. Zhou, T.D. Veenstra, A. Bretscher, Immune synapse formation requires ZAP-70 recruitment by ezrin and CD43 removal by moesin, J Cell Biol, 179 (2007) 733-746.
[12] M.H. Shaffer, R.S. Dupree, P. Zhu, I. Saotome, R.F. Schmidt, A.I. McClatchey, B.D. Freedman, J.K. Burkhardt, Ezrin and moesin function together to promote T cell activation, J Immunol, 182 (2009) 1021-1032.
[13] M. Barrero-Villar, J.R. Cabrero, M. Gordon-Alonso, J. Barroso-Gonzalez, S. Alvarez-Losada, M.A. Munoz-Fernandez, F. Sanchez-Madrid, A. Valenzuela-Fernandez, Moesin is required for HIV-1-induced CD4-CXCR4 interaction, F-actin redistribution, membrane fusion and viral infection in lymphocytes, J Cell Sci, 122 (2009) 103-113.
[14] M.A. Pearson, D. Reczek, A. Bretscher, P.A. Karplus, Structure of the ERM protein moesin reveals the FERM domain fold masked by an extended actin binding tail domain, Cell, 101 (2000) 259-270.
[15] C. Barret, C. Roy, P. Montcourrier, P. Mangeat, V. Niggli, Mutagenesis of the phosphatidylinositol 4,5-bisphosphate (PIP(2)) binding site in the NH(2)-terminal domain of ezrin correlates with its altered cellular distribution, J Cell Biol, 151 (2000) 1067-1080.
[16] B.T. Fievet, A. Gautreau, C. Roy, L. Del Maestro, P. Mangeat, D. Louvard, M. Arpin, Phosphoinositide binding and phosphorylation act sequentially in the activation mechanism of ezrin, J Cell Biol, 164 (2004) 653-659.
[17] M. Hirao, N. Sato, T. Kondo, S. Yonemura, M. Monden, T. Sasaki, Y. Takai, S. Tsukita, S. Tsukita, Regulation mechanism of ERM (ezrin/radixin/moesin) protein/plasma membrane association: possible involvement of phosphatidylinositol turnover and Rho-dependent signaling pathway, J Cell Biol, 135 (1996) 37-51.
[18] J.J. Hao, Y. Liu, M. Kruhlak, K.E. Debell, B.L. Rellahan, S. Shaw, Phospholipase C-mediated hydrolysis of PIP2 releases ERM proteins from lymphocyte membrane, J Cell Biol, 184 (2009) 451-462.
[19] S. Yonemura, T. Matsui, S. Tsukita, S. Tsukita, Rho-dependent and -independent activation mechanisms of ezrin/radixin/moesin proteins: an essential role for polyphosphoinositides in vivo, J Cell Sci, 115 (2002) 2569-2580.
[20] J. Saarikangas, H. Zhao, P. Lappalainen, Regulation of the actin cytoskeleton-plasma membrane interplay by phosphoinositides, Physiol Rev, 90 (2010) 259-289.
[21] G. Blin, E. Margeat, K. Carvalho, C.A. Royer, C. Roy, C. Picart, Quantitative analysis of the binding of ezrin to large unilamellar vesicles containing phosphatidylinositol 4,5 bisphosphate, Biophys J, 94 (2008) 1021-1033.
[22] C. Roy, M. Martin, P. Mangeat, A dual involvement of the amino-terminal domain of ezrin in F- and G-actin binding, J Biol Chem, 272 (1997) 20088-20095.
[23] K. Carvalho, L. Ramos, C. Roy, C. Picart, Giant unilamellar vesicles containing phosphatidylinositol(4,5)bisphosphate: characterization and functionality, Biophys J, 95 (2008) 4348-4360.
[24] K. Carvalho, N. Khalifat, O. Maniti, C. Nicolas, S. Arold, C. Picart, L. Ramos, Phosphatidylinositol 4,5-bisphosphate-induced conformational change of ezrin and formation of ezrin oligomers, Biochemistry, 49 (2010) 9318-9327.
[25] A. Shcherbina, A. Bretscher, D.M. Kenney, E. Remold-O'Donnell, Moesin, the major ERM protein of lymphocytes and platelets, differs from ezrin in its insensitivity to calpain, FEBS Lett, 443 (1999) 31-36.
[26] A. Barth, Infrared spectroscopy of proteins, Biochim Biophys Acta, 1767 (2007) 1073-1101.
[27] W.K. Surewicz, H.H. Mantsch, D. Chapman, Determination of protein secondary structure by Fourier transform infrared spectroscopy: a critical assessment, Biochemistry, 32 (1993) 389-394.
[28] E. Goormaghtigh, V. Cabiaux, J.M. Ruysschaert, Determination of soluble and membrane protein structure by Fourier Transform Infrared Spectroscopy. Assignments and Model Compounds, in: H.J. Hilderson, G.B. Ralston (Eds.) Subcellular Biochemistry: Physicochemical Methods in the Study of Biomembranes, vol. 23, Plenum Press, New York, 1994, pp. 329-361.
[29] A. Herrig, M. Janke, J. Austermann, V. Gerke, A. Janshoff, C. Steinem, Cooperative adsorption of ezrin on PIP2-containing membranes, Biochemistry, 45 (2006) 13025-13034. [30] F. Roch, C. Polesello, C. Roubinet, M. Martin, C. Roy, P. Valenti, S. Carreno, P. Mangeat, F. Payre, Differential roles of PtdIns(4,5)P2 and phosphorylation in moesin activation during Drosophila development, J Cell Sci, 123 (2010) 2058-2067.
[31] V. Papayannopoulos, C. Co, K.E. Prehoda, S. Snapper, J. Taunton, W.A. Lim, A polybasic motif allows N-WASP to act as a sensor of PIP(2) density, Mol Cell, 17 (2005) 181-191.
[32] A. Seelig, X.L. Blatter, A. Frentzel, G. Isenberg, Phospholipid binding of synthetic talin peptides provides evidence for an intrinsic membrane anchor of talin, Journal of Biological Chemistry, 275 (2000) 17954-17961.
[33] S. Bosk, J.A. Braunger, V. Gerke, C. Steinem, Activation of F-actin binding capacity of ezrin: synergism of PIP interaction and phosphorylation, Biophys J, 100 (2011) 1708-1717. [34] Q. Li, M.R. Nance, R. Kulikauskas, K. Nyberg, R. Fehon, P.A. Karplus, A. Bretscher, J.J. Tesmer, Self-masking in an intact ERM-merlin protein: an active role for the central alpha-helical domain, J Mol Biol, 365 (2007) 1446-1459.
[35] K.P. Hoeflich, S. Tsukita, L. Hicks, C.M. Kay, S. Tsukita, M. Ikura, Insights into a single rod-like helix in activated radixin required for membrane-cytoskeletal cross-linking, Biochemistry, 42 (2003) 11634-11641.
[36] S.D. Edwards, N.H. Keep, The 2.7 A crystal structure of the activated FERM domain of moesin: an analysis of structural changes on activation, Biochemistry, 40 (2001) 7061-7068.
[37] K. Hamada, T. Shimizu, T. Matsui, S. Tsukita, T. Hakoshima, Structural basis of the membrane-targeting and unmasking mechanisms of the radixin FERM domain, Embo J, 19 (2000) 4449-4462.
[38] K. Kitano, F. Yusa, T. Hakoshima, Structure of dimerized radixin FERM domain suggests a novel masking motif in C-terminal residues 295-304, Acta Crystallogr Sect F Struct Biol Cryst Commun, 62 (2006) 340-345.
[39] H.S. Saleh, U. Merkel, K.J. Geissler, T. Sperka, A. Sechi, C. Breithaupt, H. Morrison, Properties of an ezrin mutant defective in F-actin binding, J Mol Biol, 385 (2009) 1015-1031. [40] C. Roubinet, B. Decelle, G. Chicanne, J.F. Dorn, B. Payrastre, F. Payre, S. Carreno, Molecular networks linked by Moesin drive remodeling of the cell cortex during mitosis, J Cell Biol, 195 (2011) 99-112.
Figure
FIGURE 1
Fig. 1: Domain structure of ezrin and moesin. (A) Domain organization and sequence
identity between human ezrin and moesin: Positively charged pairs of residues participating to PIP2 binding. Major phosphorylation site. The F-actin binding domain is located at the
end of the C-terminal domain. (B, C) Ribbon structure of dormant human ezrin (B) and moesin (C). In the absence of crystallographic structures, model structures were obtained from protein model portal based on moesin from S. frugipeda structure (2I1JA). F1, F2 and F3 are the three lobs of the FERM domain.
WT Protein concentration (µM) 0 1 2 3 4 5 R e la tiv e f lu o re s c e n c e inte n s ity 0 2 4 6 8 WT ezrin / Ezrin-Alexa488 WT ezrin / Moesin-Alexa488 WT moesin / Moesin-Alexa488 F 0.0 0.5 1.0 IR 0 2 4 6 8
A
B
C
D
E
Fig. 2. Confocal microscopy observations of the interaction of ezrin and moesin with PIP2-GUVs. (A-D) Imaging of moesin-Alexa488 binding to PIP2-GUVs. Confocal
microscopy of GUVs (equatorial section) in contact with mixtures of 2 µM moesin-Alexa488 and increasing amounts of WT ezrin: (A) 0 µM (B), 1.5 µM, (C) 3.1 µM and (D) 4.6 µM. (E). Fluorescence intensity at the GUV membrane as function of the WT ezrin, for 3 different protein mixtures: () WT ezrin/ezrin-Alexa488, () WT ezrin/moesin-Alexa488, and () WT moesin/moesin-Alexa488). Inset: same data plotted as a function of the fraction of fluorescent proteins in the protein mixture. The line is a linear fit of the data.
Fig. 3. Moesin binding to LUVs of different composition by cosedimentation assay: (A).
SDS-PAGE gel of moesin (0.4 M) incubated with increasing amounts of POPC/PIP2 LUVs
(95/5) after separation of pellet (P) and supernatant (SN). (B) Percentage of WT moesin bound to LUVs as a function of the concentration of acidic lipid: () (PC/PIP2, 95/5), X axis
is the accessible concentration in PIP2, [PIP2]acc, calculated assuming that the PIP2 molecules
are equally distributed in the two membrane leaflets and that only the molecules in the outer leaflet are accessible to the proteins; () (PC/PS, 80/20), X axis is the accessible concentration in PS, [PS]acc ; (), PC, X axis is the accessible lipid concentration. The curves
are the least squares fits of the data, which yield the value of the affinity constant Kd (points
Fig. 4. Quenching of tryptophan fluorescence emission after protein binding to PIP2
-LUVs. Fluorescence emission spectra of ezrin (A) and moesin (B) in the absence or presence
of increasing amounts of PIP2-LUVs. The protein concentration was fixed at 0.4 µM and the
LUV concentration varied between 1 and 2.3 mg/ml, corresponding to 23 to 56 µM accessible PIP2. (A'-B') Quenching of tryptophan after addition of increasing concentrations of PIP2
Fig. 5. Quenching of Alexa546-label fluorescence emission after protein binding to PIP2
-LUVs. Typical fluorescence emission spectra of ezrin (A) and moesin (B) in the absence
(solid) or presence (long dash) of 1 mg/ml PIP2-LUVs. C. Quenching of ezrin (
) and moesin() fluorescence after addition of increasing amounts of PIP2-LUVs as a function of
accessible PIP2 concentration. The symbols are experimental data and the lines are best fits
75 38 43 28 Time (min) 1 5 10 20 30 60 90 Size (kDa) 75 43 28 38
B
1 5 10 20 30 60 90 75 38 43 28D
10 1 5 20 30 60 90 75 43 28 38E
MOESIN EZRIN 10 1 5 20 30 60 90A
Time (min) 0 20 40 60 80 100 % o f fu ll le n g th m o e si n 0 20 40 60 80 100 C Time (min) 0 20 40 60 80 100 % o f fu ll le n g th e zr in 0 20 40 60 80 100 F+ PIP2-LUVs + PIP2-LUVs
Fig. 6. Digestion of moesin and ezrin by chymotrypsin. Moesin (A-C) or ezrin (D-F)
degradation in the absence (A, D) or presence of PIP2-LUVs (B, E). Evolution of the intensity
of full length moesin (C) or ezrin (F) band as a function of the time elapsed since addition of chymotrypsin. Experiments were performed in the absence (
) or presence of PIP2-LUVsFig. 7. Comparative analysis of moesin and ezrin secondary structure by FTIR spectroscopy. (A). Infrared spectra of ezrin (black line) and moesin (gray line) in the amide I
region. (A’). Amide I band with fitted component peaks for ezrin (B) and for moesin (C). Experimental spectrum (thick black line), sum of fitted components (gray line), -helices (short dash), antiparallel β sheets (thin black line), random coils (long dash), intermolecular β sheets (dotted line).
Fig. 8. Secondary structure modifications of moesin and ezrin in presence of PIP2-LUVs.
Infrared spectra of ezrin (A) and moesin (B) in the absence (solid line) or presence of PIP2
-LUVs (dashed line) in the amide I region. (C) Relative contribution to the peak area of the main types of secondary structures obtained by deconvolution of the spectra shown in A and B.