HAL Id: cea-02339851
https://hal-cea.archives-ouvertes.fr/cea-02339851
Submitted on 29 Nov 2019
HAL is a multi-disciplinary open access
archive for the deposit and dissemination of
sci-entific research documents, whether they are
pub-lished or not. The documents may come from
teaching and research institutions in France or
abroad, or from public or private research centers.
L’archive ouverte pluridisciplinaire HAL, est
destinée au dépôt et à la diffusion de documents
scientifiques de niveau recherche, publiés ou non,
émanant des établissements d’enseignement et de
recherche français ou étrangers, des laboratoires
publics ou privés.
Damage characterization of (U,Pu)O_2 under
irradiation by Molecular Dynamics simulations
Hector Balboa, Laurent van Brutzel, Alain Chartier, Yann Le Bouar
To cite this version:
Hector Balboa, Laurent van Brutzel, Alain Chartier, Yann Le Bouar. Damage characterization of
(U,Pu)O_2 under irradiation by Molecular Dynamics simulations. Journal of Nuclear Materials,
Elsevier, 2018, 512, pp.440-449. �cea-02339851�
Damage characterization of (U,Pu)O
2under irradiation by Molecular Dynamics
simulations
Hector Balboaa, Laurent Van Brutzela,∗, Alain Chartiera, Yann Le Bouarb
aDen-Service de la Corrosion et du Comportement des Mat´eriaux dans leur Environnement (SCCME), CEA, Universit´e Paris-Saclay, F-91191, Gif-sur-Yvette,
France
bLab. d’ ´Etude des Microstructures, CNRS, ONERA, Universit´e Paris-Saclay, 29, avenue de la division Leclerc, BP 72, 92322, Chˆatillon, France
Abstract
Molecular dynamics simulations have been carried out to investigate the primary radiation damage in (U1−y,Puy)O2solid solution
for various temperatures and plutonium contents. This radiation assessment consists of four different studies: 1) defect formation energies; 2) Frenkel pair recombination; 3) displacement cascades; and 4) the dose effect modelled by the Frenkel pair accumulation method. Two empirical potentials - coined by Cooper and Potashnikov - are used. Overall, results obtained with both potentials show the same trend. However, kinetics of point defect recombination are significantly slower with Cooper potential implying creation of small disordered region with high energy displacement cascades. The evolution of the primary damage with increasing dose follows the same steps as those found previously in pure UO2. First, point defects are created. Subsequently, they cluster
and form small Frank loops, which in turn transform and grow into unfaulted loops. We demonstrate also that higher temperatures accelerate the production of dislocations shifting their creation to lower doses. The effect of plutonium content is also evidenced, especially with Cooper potential. It shows that the dislocation density decreases when the plutonium content increases.
Keywords: Molecular dynamics, MOX fuel, irradiation, assessment
1. Introduction
Nuclear fuel containing mixed oxide (MOX) pellets has been largely used during almost the entire history of the nuclear in-dustry. MOX fuel pellets are made from a mixture of uranium (U) and plutonium (Pu) oxides. This type of fuel has been cho-sen as an alternative for the widely used UO2based fuel because
it provides a solution for some of the problems coming from the “once-through cycle”. It can be seen as a more efficient way of using the natural U since the majority of it is composed by the Pu-producing238U. Reprocessing and recycling of fuel can
de-crease the volume of waste stored and reduce the time frame of storage. Finally, MOX is the most probable fuel for future fast breeder reactors.
Safety analyses are required by regulatory bodies to ensure that MOX fuel can be burned safely in reactors. They require to take into account the thermo-mechanical properties of MOX as a function of irradiation, dose and Pu content. It is known that MOX thermo-mechanical properties vary with respect to irradiation [1–3], yet, detailed description of this phenomena is rather sparse due to the great difficulties of carrying out ex-periments in such materials (high toxicity and radiation levels). In order to circumvent the problems, atomistic simulations can bring valuable information and increase the scope of knowledge in the understanding of radiation-induced defects.
Atomistic simulations via molecular dynamics (MD) have proved to be a useful tool to simulate ballistic damage in UO2
∗
Corresponding author. Tel.:+33-169087915; Fax: +33-169089221 Email address: [email protected] (Laurent Van Brutzel)
by means of displacement cascades studies [4–7]. Moreover, MD simulations using the Frenkel pair accumulation (FPA) technique [8, 9] allows us to go further in picturing the dose effect and have been tested for different oxides [10] and UO2
[11]. Therefore, we will present in this paper MD ballistic ra-diation damage characterization of (U,Pu)O2solid solution, for
several Pu contents, temperatures, and radiation doses.
However, in order to implement the FPA method in MOX a comprehensive basic assessment is required. This radiation assessment consists of four different studies: 1) defect forma-tion energies; 2) Frenkel pair recombinaforma-tion; 3) displacement cascades; and 4) Frenkel pair accumulation. It is worth high-lighting that transport properties such as activation energies of diffusion are also important to assess in order to complete the behaviour under irradiation. This property is not included in our assessment since it has been covered by several authors in previous works [12, 18]. With the MD method, actinide atoms are often simulated in the approximation of rigid ions and pair interactions. For the MOX fuel, several interatomic potentials can be found in literature, with various domains of validity. It is worth highlighting that this method is highly dependent on the choice of the interatomic potentials. For this reason, the sets of interatomic potentials used herein were chosen based on an assessment of thermomechanical properties previously com-pleted [13]. Two sets of empirical potentials were used in order to compare results and to have a broader insight.
This article is decomposed as follow. The first section on method gives a brief description of the empirical potentials and the systems used herein. Section 3.1 provides some point defect
formation energies in order to assess the empirical potentials. Section 3.2 examines the results on the lifetimes of Frenkel pairs, which are of importance for the two next following sec-tions. Section 3.3 presents the primary damage state obtained via displacement cascades. Finally, section 3.4 discusses the effect of irradiation dose on the evolution of the microstructure using the Frenkel pair accumulation method.
2. Computational method
The LAMMPS code [14] is used to obtain each one of the properties presented in this paper. Three temperatures 30, 300, and 1600 K are explored and Pu contents varies from pure UO2
(urania) to pure PuO2 (plutonia) with intermediates. System
sizes depend on each study and range from thousands (7 × 7 × 7 fluorite structure unit cells) to several million (70 × 70 × 70 fluorite structure unit cells) atoms. In all the cases we use peri-odic boundary conditions in order to avoid surface effects. Be-fore each simulation, an initial relaxation process is completed under the NPT thermodynamic ensemble using the Parrinello-Rahman’s algorithm [15] for 20 ps in order to reach the desired temperature and pressure (0 GPa).
According to the conclusions of our previous assessment on interatomic potentials describing MOX [13], two potentials have been selected and are coined hereafter by Potashnikov [16] and Cooper [17, 18]. The first, was fitted to the evolution of lat-tice constant in the entire range of temperatures (up to the melt-ing point), while the second focuses on reproducmelt-ing accurately the mechanical behaviour and has been fitted on experimental data for single crystal elastic constants. Both provide good re-sults for structural (lattice parameter, thermal expansion) and thermodynamics properties (heat capacity) over a large range of temperature from 300 K to melting point and for the full range of Pu content from pure urania to pure plutonia. Elastic stiffness constants are best reproduced with Cooper potential, which provides the closest results to the Fink’s recommenda-tion [19]. Furthermore, Cooper potential renders a plastic-like behaviour during crack propagation while Potashnikov poten-tial presents a brittle-like behaviour. Complete specifications of each potential can be found in our prior assessment [13].
In order to have enough statistics, different initial configu-rations are studied. The (U1−yPuy)O2 compound is taken as
a continuous solid solution. In a first approximation, the Pu atoms are distributed randomly inside the supercell on the 8a Wyckoff sites corresponding to the fluorite cations sites. In or-der to facilitate the assessment, the same random configurations are used for both potentials.
Individual conditions (temperature, pressure, Pu content, thermodynamic ensemble, etc.) and a description of each spe-cific study will be specified in the next chapter.
3. Results and discussion 3.1. Defect formation energies
Ballistic effects of irradiation result primarily in the produc-tion of intrinsic point defects, which may further anneal or clus-ter. It is then important to assess their formation energies. In our
MD simulations the number of atoms remains constant. There-fore, during a collision sequence when an atom is dislodged from its crystallographic position it creates both a vacancy and an interstitial, which is called a Frenkel pair (FP). Thus, we consider this defect as the basic unit defect in our study. In MOX, since its structure can be represented as the intercon-nection between a primitive-cubic anion sublattice embedded in a face-centered cubic cation lattice, two types of FPs can be found: cation and anion. They will be coined hereafter respec-tively C-FP and O-FP. The second type of defect studied in this section is the neutral Schottky defect (SD). It implies two oxy-gen vacancies and one cation vacancy. Indeed, this defect has been found by positron annihilation spectroscopy to be the pre-dominant defect detected in the α irradiated UO2[20].
Authors of the interatomic potentials used herein have al-ready calculated part of these defect formation energies but us-ing different approaches and mainly for urania and plutonia. Hence, in order to assess both potentials consistently for dif-ferent Pu contents, we calculate for both potentials formation energies of C-FP, O-FP, and SD defects for 0, 25, 50, and 100 Pu contents.
The formation energy of each defect is calculated by mini-mization of the energy at 0 K. This method uses an optimini-mization of the ion coordinates of the defected supercell using a conju-gate gradient algorithm, more specifically the version of Polak-Ribiere available within the LAMMPS code. The defect for-mation energy is simply calculated by computing the difference between the energy per atom of the defectless system and the energy per atom of the system containing the defect as follow:
Ef = EdefectN−1 −
N −1 N E
N
bulk (1)
The FP is created by separating the vacancy and the inter-stitial in the supercell. The SD is created by simply removing one cation and two oxygen atoms. Thus, the resulting super-cell will be a neutrally charged crystal with periodically copied defects. For each family of defect two types are initiated ac-cording to the separation distance between the vacancy and the interstitial and the three vacancies for the FP and the SD re-spectively. The first type corresponds to the bounded defect where the point defect (vacancy or interstitial) are connected, namely first nearest neighbour. Three different bounded Schot-tky defects are possible with the crystallographic orientation of the cubic structure. They are noted SDh1 0 0i, SDh1 1 0i and SDh1 1 1i. Concerning the bounded FP, it is found that the first nearest neighbour recombines instantly during the relaxation. For this reason, bounded FP energies are calculated for the sec-ond nearest neighbour sites. Conversely, the secsec-ond type corre-sponds to the distance between point defects at the infinite. To calculate these values the size of the supercell is gradually in-creased from n= 4 to n = 18 units cells. For each supercell size we separate the point defects with the maximal distance within the simulation box. Subsequently, the defect formation energy is calculated and reported as a function of their separation dis-tance. As previously shown by Potashnikov et al. [21], the defect formation energies decreases as the inverse of the sepa-ration distance. Therefore, one can extrapolate the values of the
defect formation energy at an infinite separation. These values are noted as FP∞ and SD∞.
In the case of MOX, numerous configurations for the cation arrangements are possible. Instead of studying each configura-tion systematically, we rather assess seven configuraconfigura-tions with Pu atoms randomly distributed. The defect formation energy is then averaged over the seven configurations including the type of cation used for the defect creation (i.e., either U or Pu). This provides an indication of the effect of the local surrounding on the defect formation energies. All the defect formation ener-gies with their standard deviation when applicable are reported in Table 1.
Overall, the defect formation energies are consistent for both potentials and our results show similar trends than previous cal-culations with the same potentials [17, 21]. The C-FP forma-tion energies are higher than the SD formaforma-tion energies which is slightly higher than the O-FP formation energies. This or-der is in agreement with ab initio calculations in UO2[22–25].
For the SD defect, the SDh1 1 1i configuration which possesses the longest distance between the oxygen vacancies shows the lowest energy. This is in agreement with previous MD simu-lations in UO2[17] but in contradiction with ab initio
calcula-tions with smaller supercells for which the SDh1 1 0i is the most favourable [26].
Due to the large fluctuation in the formation energies for MOX, the Pu content influence must be taken with care. How-ever, results obtained for pure urania and plutonia show for both potentials that C-FP formation energies increase from urania to plutonia whereas O-FP and SD formation energies decrease.
3.2. Frenkel pairs recombination
During displacement cascades numerous FPs with small dis-tances between the interstitial and the vacancy are created. In UO2most of them do not survive and recombine within a few
picoseconds [4, 6]. Assessing the lifetime of such defects is important to interpret the results of displacement cascades and set the parameters for the point defect accumulation method. In this section, we investigate the lifetimes of close C-FPs for both potentials at three temperatures T = 30, 300 and 1600 K, and for five Pu contents: 0, 25, 50, 75, 100%. Previous studies have suggested that the anions sublattice recover accordingly to the cation sublattice [9]. Also, we have just verified that for the first and the second neighbour the O-FP recombine spontaneously.
To calculate the recovery time of the defect, the supercell is first relaxed for 5 ps in the NPT ensemble in order to find the temperature dependent lattice parameter. Subsequently, a C-FP is created and the system is relaxed under NPT ensemble during 100 ps. If annealing of the C-FP occurs, the time of recombination is recorded. The time of 100 ps for the relaxation is chosen according to the previous studies of FPs recovery in UO2, for which most of the lifetimes are found under this time
limit [27, 28].
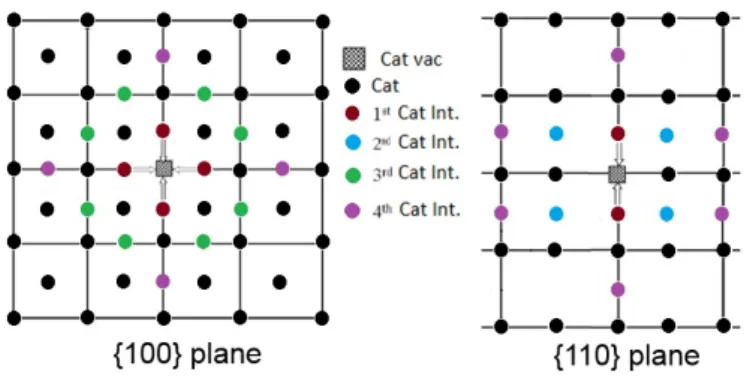
The FPs are classified according to the distance between the interstitial and the vacancy as first-, second-, third- and fourth-nearest neighbours as shown in Figure 1. Due to the fluorite symmetry, there are: 6 first, 8 second, 24 third, and 48 fourth
possible nearest neighbours for the C-FPs. For simplicity, we limit the number of third- and fourth-nearest neighbours stud-ied to 8 (all shown in Figure 1). For each MOX case, seven different configurations with Pu randomly distributed are inves-tigated. The time of recovery is then averaged over 56 (7 × 8) for MOX cases and 8 for pure urania and plutonia. If for a specific microstructure there is no recombination, the case is simply excluded from the average. Therefore, the resulting life-time corresponds to the lowest limit of the recombination life-time. Nevertheless, it gives an indication of whether recombination may occur or not. Table 2 compiles all the results of the aver-aged lifetimes with their standard deviation. The symbol, , corresponds to spontaneous recombination i.e., inferior to 1 ps whereas the symbol, >, signifies that no recombination takes place within the 100 ps of the simulation for all the cases stud-ied (i.e., 56 for MOX and 8 for pure compounds).
Figure 1: Schematic diagram of the {1 0 0} and {1 1 0} planes showing the possi-ble crystallographic position for the cation interstitials in a fluorite-like lattice. The positions are classified as 1st, 2nd, 3rd, and 4thnearest neighbour according
to their distance to the vacancy.
From these results of the recombination lifetimes, we can conclude that: 1.- First-nearest neighbours always recombine instantaneously (recombination occurs in less than 1 ps) for all cases. 2.- In contrast, second-nearest neighbours do not recom-bine for all cases. This is due to the energy barrier imposed by the oxygen laying between the interstitial and the vacancy, as already seen in previous studies in fluorite-like structure us-ing rigid ion interatomic potentials [29]. 3.- For the third- and fourth-nearest neighbours the recombination process is rather complex and involves two or three successive replacements as previously shown in UO2[27, 28]. Furthermore, there is a clear
dependence on the temperature. At higher temperatures, the process of recombination is more probable, indicating a ther-mal activated process. 4.- The recombination process is more probable and occurs at lower temperatures for Potashnikov po-tential than for Cooper popo-tential. 5.- Concerning the Pu content, for Cooper potential it seems that the recombination processes are facilitated with the increase of the Pu content. For Potash-nikov potential this tendency is less pronounced especially for the third-nearest neighbours.
Overall, recombination of C-FPs falls into two regimes: first, a spontaneous regime where recombination events occur in less than 1 ps and second, a thermally activated regime. This is
im-Table 1: Formation energies of Frenkel pairs and Schottky defects.
Defect energy Cooper Potashnikov
(eV) UO2 U0.75Pu0.25O2 U0.5Pu0.5O2 PuO2 UO2 U0.75Pu0.25O2 U0.5Pu0.5O2 PuO2
C-FP∞ 15.4 15.6±0.7 15.5±0.8 15.9 15.5 15.7±0.3 15.8±0.3 16.4 C-FP 11.0 11.5±0.8 11.0±0.5 11.8 12.0 12.4±0.3 12.5±0.3 13.2 O-FP∞ 5.9 5.8±0.1 5.6±0.1 5.5 4.1 4.0±0 4.0±0 3.9 O-FP 4.9 4.8±0.2 4.8±0.1 4.5 3.3 3.3±0.1 3.3±0.1 3.3 SD∞ 10.9 11.0±0.7 10.5±0.9 10.0 9.7 9.7±0.3 9.6±0.3 9.5 SDh1 0 0i 6.2 6.5±0.6 5.8±0.6 5.9 5.6 5.8±0.3 5.6±0.3 5.8 SDh1 1 0i 5.3 5.5±0.6 5.0±0.6 5.0 5.0 5.2±0.3 5.0±0.3 5.1 SDh1 1 1i 5.0 5.4±0.7 4.7±0.6 4.8 4.8 5.0±0.3 4.9±0.3 5.0
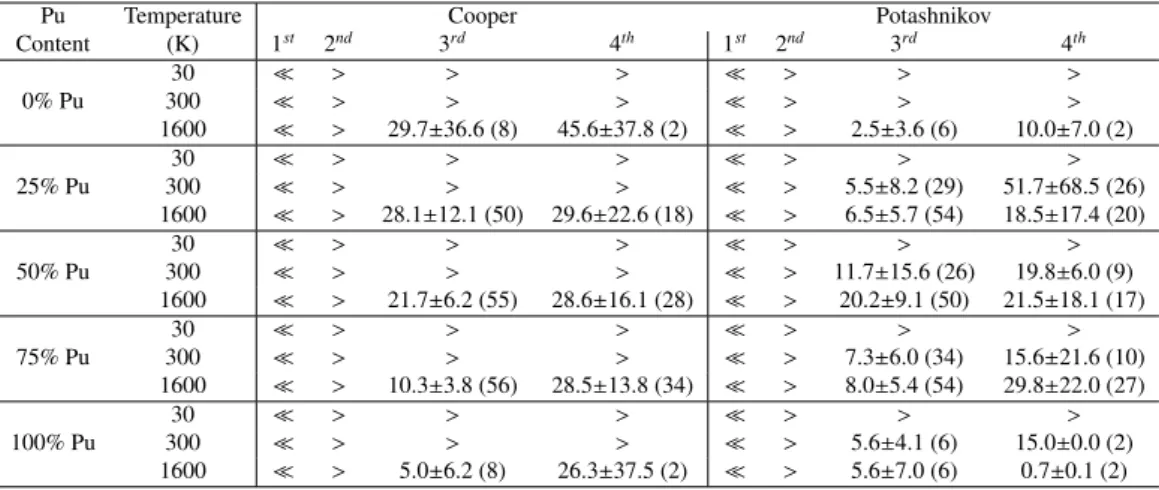
Table 2: Recombination times in ps for C-FPs for both Cooper and Potashnikov potentials at different Pu contents and temperatures. The symbol, , corresponds to a spontaneous recombination (less than 1 ps) and the symbol, >, signifies that no recombination takes place within the 100 ps of the simulation. The number in parenthesis corresponds to the number of recombination that occurs over the 56 MOX cases and the 8 pure compound cases studied.
Pu Temperature Cooper Potashnikov
Content (K) 1st 2nd 3rd 4th 1st 2nd 3rd 4th 0% Pu 30 > > > > > > 300 > > > > > > 1600 > 29.7±36.6 (8) 45.6±37.8 (2) > 2.5±3.6 (6) 10.0±7.0 (2) 25% Pu 30 > > > > > > 300 > > > > 5.5±8.2 (29) 51.7±68.5 (26) 1600 > 28.1±12.1 (50) 29.6±22.6 (18) > 6.5±5.7 (54) 18.5±17.4 (20) 50% Pu 30 > > > > > > 300 > > > > 11.7±15.6 (26) 19.8±6.0 (9) 1600 > 21.7±6.2 (55) 28.6±16.1 (28) > 20.2±9.1 (50) 21.5±18.1 (17) 75% Pu 30 > > > > > > 300 > > > > 7.3±6.0 (34) 15.6±21.6 (10) 1600 > 10.3±3.8 (56) 28.5±13.8 (34) > 8.0±5.4 (54) 29.8±22.0 (27) 100% Pu 30 > > > > > > 300 > > > > 5.6±4.1 (6) 15.0±0.0 (2) 1600 > 5.0±6.2 (8) 26.3±37.5 (2) > 5.6±7.0 (6) 0.7±0.1 (2)
portant for the parameter of our next study using accumulation of FPs. The relaxation time between integration of FPs will be set to 2 ps, which gives enough time for spontaneous recombi-nation.
3.3. Primary damage state
The primary damage state is studied via simulations of dis-placement cascades. The first step of the disdis-placement cascade method consists of relaxing the supercell under constant tem-perature and zero pressure during 25 ps. The collision se-quence starts by choosing a cation (Pu or U), which is coined hereafter PKA for Primary Knock-on Atom to mimic a recoil nucleus. Subsequently, kinetic energy is given to the PKA. The system is then relaxed under the microcanonical ensem-ble for around 50 ps. Three PKA energies are studied: 5, 10 and 75 keV. The size of the supercell is chosen so that it con-tains all the cascade body to avoid cascade self-interaction due to the use of the periodic boundary conditions. For instance, it is 38 × 38 × 38 nm for 75 keV PKA the maximum size reached. Moreover with this box size, at the end of the cascade just a small increase of temperature occurs, less than 150 K. There-fore, no significant change is expected for the recombination or diffusion process of point defects. Hence, no rescaling tem-perature layer is implemented to release this excess of thermal energy. Due to computational time, only three Pu contents are assessed: 0, 50 and 100%. For 5 and 10 keV PKA energies,
15 different cascades are studied for each Pu content. Initial PKA orientation and localisation vary between each cascade in order to increase statistics. Pu atoms are randomly distributed in the supercell. Due to the intensive computational time, only 5 cascades with PKA energy of 75 keV for each Pu content are studied.
The end of the cascade is reached when the temperature of the simulation box is constant. At that point, we analyse the number of permanently displaced atoms i.e., atoms that has been moved by more than 0.1 nm from their initial crystallo-graphic position and the number of defects namely the number of FPs. This is achieved by the Wigner-Seitz cell analysis pro-vided by the OVITO software [30]. With the same software, further analysis is completed via dislocation analysis (DXA) [31] with the cation sublattice to identify disordered regions i.e., regions where cation structure is not fcc structure.
A general cascade behaviour is observed. Within the first picosecond, the PKA suffers several collisions releasing its ki-netic energy in the form of a large amount of atomic displace-ments in all directions. These atomic displacedisplace-ments induce a temporary local disorder of the crystal in the core of the cas-cade. Numerous FPs are created during this stage. Subse-quently, the system evolves releasing energy in the form of ther-mal vibrations, causing a drastic increase of the local tempera-ture. This last stage is usually named the thermal spike. Con-sequently, numerous recombination events take place, which
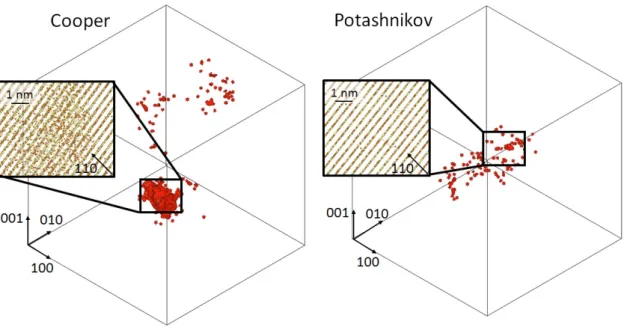
mainly leads to the reconstruction of the fluorite lattice leaving only a few remaining point defects. However, for the cascades initiated at 75 keV with Cooper potential, this recovery stage does not lead to full reconstruction of the fluorite structure. In-stead, a large disordered region with no crystallographic atomic structure of several nanometers (> 5 nm) is found at the cascade core. An illustration of this disordered region is shown in fig-ure 2. In contrast, only a few point defects remain for cascades initiated with the same energy with Potashnikov potential.
This behaviour can originate from two reasons. First, the ki-netics of recovery for the high disordered structure is too long compared to the time frame of the MD simulation. Second, the disordered structure is more energetically favourable. The lat-ter seems unlikely because the fluorite structure has been found by Cooper et al. [17] to have the lowest cohesive energy com-pared to some other crystallographic structures and because up to 10 keV PKA reconstruction of the fluorite structure is ob-served.
Figure 3 shows the number of displaced cations and anions as a function of PKA energy. The error bars correspond to the standard deviation from the average over the 7 different mi-crostructures. This number is compared to the theoretical num-ber of displaced atoms estimated by the Kinshin-Pease linear law [32]:
Ndisp.KP = EPKA 2Ed
(2) herein, EPKA, is the initial kinetic energy of the projectile and
Ed is the threshold displacement energy in the material. The
value of Edis taken as classically equal to 40 eV and 20 eV for
the cations and the anions respectively [33].
Both potentials show similar results. The number of dis-placed atoms is higher than the theoretical estimation, except for cations at 5 keV PKA, indicating that the Ed for the
empir-ical potentials are probably lower than the ones used in equa-tion 2. Furthermore, the ratio between the number of displaced anions and the number of displaced cations is approximatively equal to 4.3 and 5.5 for Cooper and Posthnikov potentials re-spectively. Consequently, the anion sublattice is more affected than the cation sublattice by the cascade event. We also find no influence of the Pu content on those results.
The numbers of remaining FPs at the end of the cascades are reported in figure 4. They compare with the theoretical linear law proposed by Norgett, Robinson, and Torrens (NRT) [34] who rescale the Kinshin-Pease equation by a factor 0.8 as fol-low:
NFPNRT= 0.4EPKA Ed
(3) For both potentials no significant influence of the Pu content is observed. The number of FPs found at the end of the cas-cades is significantly lower than the one estimated with the NRT law. This difference resides from the fact that realistically the NRT law does not include the defect recombination dur-ing thermal spikes as demonstrated with very high energy cas-cades in UO2by Crocombette et al. [7]. However, the number
of FPs is significantly higher with Cooper potential especially at high energy PKA. This is directly linked to the disordered
structure mentioned above in which most of the atoms are de-tected as defects. The ratio between the number of O-FPs and C-FPs is close to 3.1 and 2.2 for Cooper and Potashnikov po-tentials respectively. These ratios are close to the stoichiometry and lower than those found for the number of displaced atoms. This suggests that the oxygen defects recombine with a higher rate than the cation defects and follow the cation disorder. It also shows that recombination of defects is more effective with Potashnikov potential in agreement with results presented in section 3.2. All these results confirm that the long-time kinetics of defect recovery with the Cooper potential play a crucial role and this explains the unexpected formation of the disordered region found at high energy PKA.
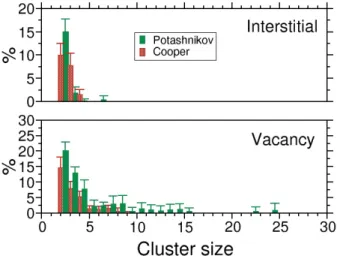
Spatial repartition of point defects at the end of the cascade is determined with a cluster analysis. We define a cluster as connected defects of the same type (vacancy or interstitial). The number of members of each cluster defines its size. Figure 5 shows the ratio in percentage between the number of defects in cluster of a fixed size and the total number of defects as a function of cluster size. Only the results from 10 keV PKA are presented because of the presence of disordered regions at high energy with the Cooper potential. Furthermore, for both potentials no significant difference is found with the different Pu contents. Therefore, the results of the three Pu content are brought together to increase the statistics. Is it also important to highlight that these figures do not show the contribution of single point defect which contribute to the majority of defect. Hence, the total shown in the figures does not reach 100%. The error bars correspond to the standard deviation of the different values averaged over the 7 different microstructures.
Overall, both potentials show the same behaviour even if it is more predominant for Potashnikov potential. Only small in-terstitial clusters containing up to 4-5 inin-terstitials are found. Conversely, large vacancy clusters up to 22 vacancies corre-sponding to nanocavities of 1 nm size are found. One possible explanation for this behaviour comes from visual inspection of the spatial repartition of defects. It shows that vacancy clus-ters are consistently found in the core of the cascade whereas interstitial clusters are located preferentially at the periphery. Consequently, all remaining vacancies are close to one an other and are more likely to form clusters.
3.4. Dose effect
Displacement cascades provide characterization of the pri-mary damage state, which mainly consist of the creation of few point defects as shown in previous section 3.3. Therefore, in order to study the dose effect (accumulation of damage) on the MOX microstructure, we use the defect accumulation method. With this method we introduce periodically and consistently FP defects, while the structure is continuously allowed to relax un-der constant pressure and temperature. The FPs are randomly introduced with minimum distance between the vacancy and the interstitial greater than 1.4 Å. In section 3.2, we showed that the oxygen sublattice seems to follow the cation disorder, consequently only C-FPs (i.e., U or Pu) are introduced in order to reduce the computational time.
The time between two subsequent C-FP introductions is set to 2 ps. This time corresponds with the first regime of
recom-Figure 2: Snapshots of the defect analysis at the end of the cascade initiated with 75 keV PKA for Cooper (left) and Potashnikov (right) potentials for 50% Pu content. The red zone marked the regions where structure departs from perfect fluorite structure. The insets represent close-up visualisation of the atoms in a 0.5 nm thick layer in the main disordered region.
Figure 3: Evolution of the number of (a) cation and (b) anion displaced atoms at the end of displacements cascades as a function of PKA energy for both potentials (C for Cooper and P for Potashnikov) and the three Pu contents. The black doted line corresponds to the theoretical number of displaced atoms estimated with the Kinshin-Pease law.
bination discussed in section 3.2. Thus, we allow the system to have spontaneous recombination events. At each C-FP in-troduction sequence i.e., every 2 ps, 700 FPs are created for Potashnikov potential and 300 for Cooper potential. These numbers have been chosen to minimize the computational time and to ensure that within the time-lapse between two FP intro-ductions the system is relaxed. Namely, the temperature and the pressure are back to the desired values. Because the de-fect recombination time is higher for Cooper potential (see sec-tion 3.2), less FPs can be introduced within the same time val. An alternative could have been to increase this time inter-val, but the computational time to reach equivalent dose would have been out-of-range. To verify that this difference in dose rate does not affect the result, we carried out one simulation with Potashnikov potential introducing 300 FPs every 2 ps. Re-sults show no difference between the two dose rates.
Due to the high increase in energy arising from each FP
in-Figure 4: Evolution of the number of (a) cation and (b) anion FPs present at the end of displacements cascades as a function of PKA energy for both potentials (C for Cooper and P for Potashnikov) and the three Pu contents. The black doted line corresponds to the theoretical number of FPs estimated with the NRT law.
troduction, the NPT relaxation is done with the Berendsen al-gorithm provided by the LAMMPS code [35]. Two different temperatures are investigated 300 and 1600 K as well as three Pu contents 0%, 50%, and 100% for both potentials. In all the cases studied herein, the size of the system includes 40×40×40 fluorite unit cells, involving 256 000 cations.
A common way to measure irradiation dose on materials is the use of displacement per atom (dpa). This is also a very simple metric from the atomistic simulations point of view. It is defined simply by the number of displacements (on average) of one atom, which exactly corresponds to what is simulated with the FPA method. Since only C-FPs are created, we ex-press the dose in displacement per cation (dpc) rather than the classic dpa. Therefore, for each C-FP introduction, the dose is increased by 1.17 × 10⁻³and 2.73 × 10⁻³dpc for Cooper and Potashnikov potentials respectively.
on-the-Figure 5: Distribution of point defects in cluster (interstitial and vacancy) as a function of their size for Cooper and Potashnikov potentials calculated from 10 keV PKA cascades.
fly using OVITO software. We determined the dislocation den-sity with the DXA algorithm and examined the point defects with Voronoi cell analysis. This last method has been chosen rather than the Wigner-Seitz cell analysis because numerous disoriented fluorite subdomains appear during the simulation. Consequently, the reference grid used for the Wigner-Seitz cell analysis does not apply anymore.
Figures 6 and 7 display snapshots of the damage as a function of dose expressed in dpc obtained with Cooper and Potashnikov potentials respectively for MOX with 50% Pu at 1600 K. Only, dislocations and main cluster of defects are reported in these figures for clarity. Overall, both potentials show the same gen-eral trend for the evolution of the microstructure with the dose. However, differences appear in the quantification of the damage and the dose at which it occurs. The evolution of the system fol-lows 3 main stages. First, point defect concentration increases without formation of a dislocation (see snapshot 0.2 dpc with cooper potential). Subsequently, at about 0.5 dpc for Cooper and 0.1 dpc for Potashnikov Frank loops with Burger’s vec-tor1/3h1 1 1i nucleate from interstitial clustering. This point is
illustrated by the fact that the concentration of interstitials de-creases at the dose at which loops nucleate while concentration of vacancies still increases (see fig 8 and 9). As the dose in-creases, these loops transform into perfect loops with Burger’s vector1/2h1 1 0i. However, for Cooper potential the number of
Frank loops is considerably smaller, which suggests that most of the perfect loops are created directly. Finally, these perfect loops grow and organise themselves into dislocation lines (last snapshots). This same behaviour was found in UO2 with MD
simulations [11] and observed experimentally [36, 37]. It is worth noting that for Cooper potential, contrary to what is observed at high energy cascades, no large high disordered region (> 5 nm) is found. Only, small (1-2 nm) regions com-posed of defect clusters along with prismatic dislocations are found. This leads us to believe that, like for the other potential, radiation-induced microstructure likely involves point defects
and dislocations instead of highly disordered area. In that case, it could indicate that with Cooper potential the kinetics of re-covery for the high disordered structure is too long compared to the time-frame of the MD simulation.
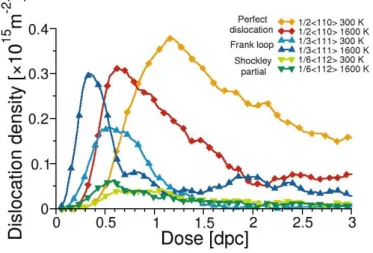
Temperature plays an important role in the evolution of the extended defects. With Cooper potential no dislocation forma-tion is observed at 300 K whereas some appear for 1600 K. For Potashnikov potential some quantitative differences occur. Fig-ure 8 shows the evolution of the dislocation densities as a func-tion of dose obtained at 300 and 1600 K using the same initial configuration (50% Pu content) with Potashnikov potential. For both temperatures, one can observe easily the same sequence of the different types of dislocation appearing as the dose in-creases. First, Frank loops nucleate, peak and decrease abruptly corresponding to the increase of perfect loop density. This transformation is corroborated by the appearance of Shockley partials (Burger’s1/6h1 1 2i) at the dose where Frank loops
de-crease and perfect loops inde-crease. At the higher dose the density of perfect loops stabilize and a steady state appears. This be-haviour is shifted to lower doses as the temperature increases . Peaks of Frank loop and perfect loop density appear succes-sively at 0.4 and 0.8 dpc for 1600 K whereas they appear at 0.6 and 1.2 dpc for 300 K. Moreover, at 1600 K Frank loops are sill present at high doses with density oscillating around 5 × 10¹⁴m−2while they are almost non-existent at 300 K. This
suggest that at high temperature Frank loops are still created in-side the nano-domains delimited by the unfaulted dislocations. This behaviour changes with temperature has been observed ex-perimentally in UO2[36]. In this irradiation study performed at
-180 and 600◦C, the dose at which the loops transform into lines decreases with increasing temperature and loop growth does not occur for the low temperature. The authors suggest that this off-set in the defect changes is attributed to higher defect mobility under irradiation as the temperature rises.
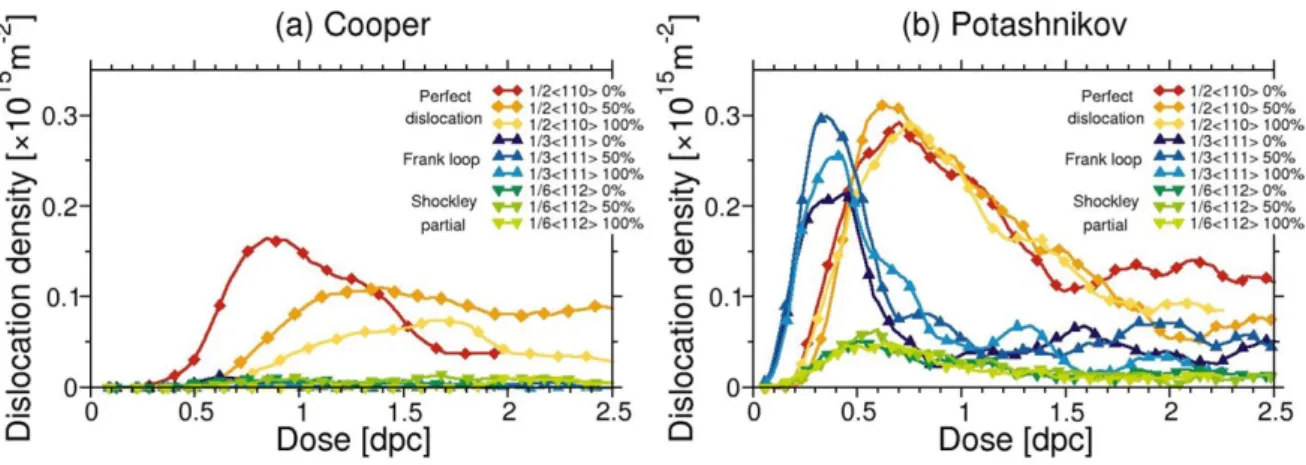
We discuss in the following the influence of the Pu content on the primary radiation damage. Figure 9 shows the evolution of the density of dislocations as a function of dose obtained with Cooper and Potashnikov potentials at 1600 K. A clear trend is found with Cooper potential. The dislocation density decreases as the Pu content increases and peaks of density shift to higher dose with increasing Pu content. Therefore, the creation of dis-locations is easier in urania than in MOX or plutonia. It is worth noting that for this potential few Frank loops nucleate implying direct creation of perfect loops. With Potashnikov potential, the Pu influence on the dislocation density is less significant, even if above 2 dpc the density of1/2h1 1 0i dislocations seems
slightly higher for the MOX than for plutonia.
Dependency on Pu content can also be found with the evo-lution of the number of point defects (vacancy and interstitial). Figure 10 displays this evolution carried out at 1600 K for both potentials as a function of dose. For both potentials, a simi-lar trend is observed. The number of vacancies and intersti-tials slightly increases as Pu content increases. Since interstitial defects feed dislocations, this behaviour corroborates previous conclusion stating that less dislocations are formed as Pu
con-Figure 6: Snapshots of the evolution of extended defects as a function of dose (expressed in dpc) for Cooper potential at 1600 K for 50% Pu. The red zone marked the regions where structure departs from perfect fluorite structure. The cyan lines are1/3h1 1 1i Frank loops, the green lines are1/6h1 1 2i Shockley partial dislocations, and the dark blue lines are1/2h1 1 0i perfect dislocations.
Figure 7: Snapshots of the evolution of extended defects as a function of dose (expressed in dpc) for Potashnikov potential at 1600 K for 50% Pu. The red zone marked the regions where structure departs from perfect fluorite structure. The cyan lines are1/3h1 1 1i Frank loops, the green lines are1/6h1 1 2i Shockley partial dislocations, and the dark blue lines are1/2h1 1 0i perfect dislocations.
tent increases. 4. Conclusions
In this paper, we assessed the primary radiation damage in (U1−y, Puy)O2solid solution with molecular dynamics
simula-tions. Two interatomic potentials were studied, as coined by Cooper and Potashnikov. These potentials were chosen accord-ing to the conclusions of our previous thermo-mechanical as-sessment. The radiation assessment consisted of four different studies: 1) defect formation energies; 2) Frenkel pair recombi-nation; 3) Primary state damage via displacement cascades; and 4) study of radiation dose effect with Frenkel pair accumulation method. In each study several Pu contents and temperatures were investigated.
For the defect formation energies, both potentials give ap-proximately the same values and corroborate with existing data for urania. Comparing pure urania and plutonia, C-FP forma-tion energies increase from urania to plutonia whereas O-FP
and SD formation energies decrease slightly. However, due to the statistical fluctuation in MOX, a trend concerning the Pu content is difficult to extract.
Concerning the FP recombination. Results show that; 1) For the third- and fourth-nearest neighbours there is a clear depen-dence on the temperature. At higher temperatures, the process of recombination is more probable, indicating a thermal acti-vated process. 2) First-nearest neighbours always recombine instantaneously (recombination occurs in less than 1 ps) for all cases. In contrast, second-nearest neighbours do not recombine for all cases. This is probably due to the energy barrier im-posed by the oxygen laying between the cation interstitial and the vacancy. 3) The recombination process is faster for Potash-nikov potential than for Cooper potential. 4) Concerning the Pu content, for Cooper potential it seems that the recombina-tion processes is facilitated by the increase of the Pu content. For Potashnikov potential this tendency is less pronounced es-pecially for the third-nearest neighbours.
Figure 8: Evolution of dislocation densities as a function of dose (expressed in dpc) obtained with Potashnikov potential at 300 and 1600 K for 50% Pu. (circle)1/3h1 1 1i Frank loops, (triangle)1/6h1 1 2i Shockley partial dislocations, (star)1/2h1 1 0i perfect dislocations.
Displacement cascades for PKA energies below the 10 keV show the same behaviour for both potentials: only a few point defects are created. Differences start to appear at 75 keV. For the cooper potential, the recovery stage does not lead to full reconstruction of the fluorite structure. Instead, a large disor-dered region with no crystallographic atomic structure of sev-eral manometers is found at the cascade core. In contrast, Potashnikov potential presents a quasi-total reconstruction of the fluorite structure. Although, large vacancy clusters corre-sponding to nanocavities of 1 nm size are consistently found in the cascade core. This suggests that recombination of defects is more effective with Potashnikov potential in agreement with results presented in the recombination part. No significant in-fluence of the Pu content is found on this study.
Finally, the FP accumulation study was carried out to inves-tigate the dose effect. Whatever the Pu content, Potashnikov potential presents a similar evolution in three main stages as the dose increases: accumulation of point defects that cluster and form Frank loops which in turn transform into perfect loop and dislocation lines. This behaviour is different for Cooper potential. With this potential at 300 K no dislocation is found. Nevertheless, at 1600 K dislocations form but only few Frank loops are observed suggesting a direct mechanism for the cre-ation of perfect loops. Concerning the Pu content, a clear trend is found. The dislocation density decreases and dislocations appear for higher doses as the Pu content increases. Quantita-tively, more dislocations are created with Potashnikov than with Cooper potential. Furthermore, with this method, no disordered region is observed even at high doses for both potentials.
Overall, this assessment shows that both potentials have ad-vantages and disadad-vantages when studying radiation-induced damage in (U,Pu)O2 solid solution. Cooper potential seems
to be more sensitive to Pu content than Potashnikov potential. However, with Cooper potential, displacement cascades at high energies lead to very high disordered microstructure, which
seems to be contradictory with experimental results that show no amorphisation for UO2 or MOX even at high doses.
Nev-ertheless, microstructure evolution with radiation dose studied with FPA method shows no amorphisation. We hypothesize that this difference of behaviour could be explained by the kinetics of the defect recovery. Therefore, this potential could be more suitable for fast kinetic radiation phenomena or for methods, like kinetic Monte-Carlo, where time-frame is less constrained.
Acknowledgements
This research is part of the INSPYRE project, which has received funding from the Euratom research and training pro-gramme 2014-2018 under Grant Agreement No 754329. This research contributes to the joint programme on nuclear materi-als (JPNM) of the European energy research alliance (EERA). This work was granted access to the HPC resources of [TGCC] under the allocation 2016-mtt7073 made by GENCI.
References
[1] S. Popov et al., Thermophysical Properties of MOX and UO2Fuels
In-cluding the Effects of Irradiation, ONRL Rep., ORNL/TM- 2000/351, 2000.
[2] J.J Carbajo, G.L. Yoder, S.G. Popov, V.K. Ivanov, ”A review of the thermophysical properties of MOX and UO2fuels”, J. Nucl. Mater. 299
(2001) 181-198.
[3] ESNII+ European commission. Deliverable D7.11 “state of the art with a literature review of MOX properties” (2015).
[4] L. Van Brutzel, M. Rarivomanantsoa, D. Ghaleb, ”Displacement cascade initiated with the realistic energy of the recoil nucleus in UO2matrix by
molecular dynamics simulation”, J. Nucl. Mater. 354 (2006) 28-35. [5] R. Devanathan, J. Yu, and W. J. Weber, ”Energetic recoils in UO2
sim-ulated using five different potentials”, The Journal of Chemical Physics 130 (2009) 174502.
[6] G. Martin, P. Garcia, L. Van Brutzel, B. Dorado, S. Maillard, ”Effect of the cascade energy on defect production in uranium dioxide”, Nucl. Instrum. Methods Phys. Res. B 269 (2011) 1727-1730.
[7] J.P. Crocombette, L. Van Brutzel, D. Simeone, L. Luneville, ”Molecular dynamics simulations of high energy cascade in ordered alloys: Defect production and subcascade division”, J. Nucl. Mater. 474 (2016) 134-142. [8] A. Chartier, C. Meis, J. P. Crocombette, W.J. Weber, and L. R. Corrales, ”Molecular Dynamic Simulation of Disorder Induced Amorphization in Pyrochlore”, Phys. Rev. Lett. 94 (2005) 25505.
[9] J.P. Crocombette, A. Chartier, and W.J. Weber, ”Atomistic simulation of amorphization thermokinetics in lanthanum pyrozirconate”, Appl. Phys. Lett. 88 (2006) 051912.
[10] A. Chartier, G. Catillon, and J.P. Crocombette, ”Key role of the cation interstitial structure in the radiation resistance of pyrochlores”, Phys. Rev. Lett. 102 (2009) 155503.
[11] A. Chartier, C. Onofri, L. Van Brutzel, C. Sabathier, O. Dorosh, and J. Jagielski, ”Early stages of irradiation induced dislocations in urania”, Appl. Phys. Lett. 109 (2016) 181902.
[12] A.S. Boyarchenkov, S.I. Potashnikov, K.A. Nekrasov, A.Ya. Kupryazhkin, ”Investigation of cation self-diffusion mechanisms in UO2±xusing molecular dynamics”, J. Nucl. Mater. 442 (2013) 148.
[13] H. Balboa, L. Van Brutzel, A. Chartier, and Yann Le Bouar, ”Assessment of empirical potential for MOX nuclear fuels and thermomechanical prop-erties”, J. Nucl. Mater. 495 (2017) 66-77.
[14] http://lammps.sandia.gov/
[15] M. Parrinello and A. Rahman, ”Polymorphic transitions in single crystals: a new molecular dynamics method”, J. Appl. Phys. 52 (1981) 7182-7190. [16] S.I. Potashnikov, A.S. Boyarchenkov, K.A. Nekrasov, A.Ya. Kupryazhkin, ”High-precision molecular dynamics simulation of
Figure 9: Evolution of dislocation densities as a function of dose (expressed in dpc) obtained with (a) Cooper and (b) Potashnikov potentials at 1600 K for 0%, 50%, and 100% Pu.
Figure 10: Evolution of the number of point defects (vacancy and interstitial) as a function of dose (expressed in dpc) obtained with (a) Cooper and (b) Potashnikov potentials at 1600 K for 0%, 50%, and 100% Pu.
UO2–PuO2: Pair potentials comparison in UO2”, J. Nucl. Mater. 419
(2011) 217-225.
[17] M.W.D. Cooper, M.J.D. Rushton, and R.W. Grimes, ”A many-body po-tential approach to modelling the thermomechanical properties of actinide oxides”, J. Phys. Condens. Matter. 26 (2014) 105401.
[18] M.W.D. Cooper, S.T. Murphy, M.J.D. Rushton, R.W. Grimes, ”Thermo-physical properties and oxygen transport in the (Ux,Pu1−x)O2 lattice”, J.
Nucl. Mater. 461 (2015) 206-214.
[19] J. Fink, J. Nucl. Mater. 279 (200) 1-18; IAEA-TECDOC-1496 , ”Ther-mophysical properties database of (materials for light water reactors and heavy water reactors)”
[20] J. Wiktor, M-F. Barthe, G. Jomard, M. Torrent, M. Freyss, and M. Berto-lus, ”Coupled experimental and DFT+U investigation of positron life-times in UO2”, Phys. Rev. B 90 (2014) 184101.
[21] S.I. Potashnikov, A.S. Boyarchenkov, K.A. Nekrasov, A.Ya. Kupryazhkin, ”High-precision molecular dynamics simulation of UO2–PuO2: Anion self-diffusion in UO2”, J. Nucl. Mater. 433 (2013)
215–226.
[22] M. Freyss, T. Petit, J.P. Crocombette, ”Point defects in uranium dioxide: Ab initio pseudopotential approach in the generalized gradient approxi-mation”, J. Nucl. Mater. 347 (2005) 44–51.
[23] H.Y. Geng, Y. Chen, Y. Kaneta, M. Iwasawa, T. Ohnuma, and M. Ki-noshita, Phys. Rev. B 77 (2008) 104120.
[24] J. Yu, R. Devanathan, and W.J. Weber, ”First-principles study of de-fects and phase transition in UO2”, J. Phys.: Condens.Matter 21 (2009) 435401.
[25] B. Dorado, G. Jomard, M. Freyss, and M. Bertolus, ”Stability of oxygen
point defects in UO2 by first-principles DFT+U calculations: Occupa-tion matrix control and Jahn-Teller distorOccupa-tion”, Phys. Rev. B 82 (2010) 035114.
[26] E. Vathonne, J. Wiktor, M. Freyss, G. Jomard, and M. Bertolus, ”DFT+U investigation of charged point defects and clusters in UO2” , Journal of
Physics: Condensed Matter 26 (2014) 325501.
[27] L. Van Brutzel, A. Chartier, and J.P. Crocombette, ”Basic mechanisms of Frenkel pair recombinations in UO2 fluorite structure calculated by
molecular dynamics simulations”, Phys. Rev. B 78 (2008) 024111. [28] F. Devynck, M. Iannuzzi, and M. Krack, ”Frenkel pair recombinations
in UO2: Importance of explicit description of polarizability in core-shell
molecular dynamics simulations”, Phys. Rev. B 85 (2012) 184103. [29] N. Pannier, A. Guglielmetti, L. Van Brutzel, A. Chartier, ”Molecular
dynamics study of Frenkel Pair Recombinations in Fluorite type com-pounds”, Nucl. Instrum. Methods Phys. Res. B, 267 (2009) 3118-3121. [30] A. Stukowski, K. Albe, ”Visualization and analysis of atomistic
simula-tion data with OVITO - the Open Visualizasimula-tion Tool”, Modelling Simul. Mater. Sci. Eng. 18 (2010) 015012.
[31] A. Stukowski, V.V. Bulatov, and A. Arsenlis, ”Automated identifica-tion and indexing of dislocaidentifica-tions in crystal interfaces”, Modelling Simul. Mater. Sci. Eng. 20 (2012) 085007.
[32] G.H. Kinchin, R.S. Pease, ”The Displacement of Atoms in Solids by Ra-diation”, Rep. Prog. Phys. 18 (1955) 1-51.
[33] J. Soullard., ”High voltage electron microscope observations of UO2”, J.
Nucl. Mater., 135 (1985) 190–196.
[34] M. Norgett, M.T. Robinson, I. Torrens, ”A proposed method of calculat-ing displacement dose rates” Nucl. Eng. Des. 33 (1975) 50-54.
[35] H.J. Berendsen, J.P. Postma, W.F. van Gunsteren, A. DiNola, and J.R. Haak, ”Molecular dynamics with coupling to an external bath”, The Jour-nal of Chemical Physics 81 (1984) 3684.
[36] C. Onofri, C. Sabathier, C. Baumier, C. Bachelet, H. Palancher, M. Legros, ”Evolution of extended defects in polycrystalline Au-irradiated UO2using in situ TEM: Temperature and fluence effects”, J. Nucl. Mat.
482 (2016) 105-113.
[37] C. Onofri, C. Sabathier, H. Palancher, G. Carlot, S. Miro, Y. Serruys, L. Desgranges, M. Legros, ”Evolution of extended defects in polycrys-talline UO2under heavy ion irradiation: combined TEM, XRD and