HAL Id: cea-02189427
https://hal-cea.archives-ouvertes.fr/cea-02189427
Submitted on 19 Jul 2019
HAL is a multi-disciplinary open access
archive for the deposit and dissemination of
sci-entific research documents, whether they are
pub-lished or not. The documents may come from
teaching and research institutions in France or
abroad, or from public or private research centers.
L’archive ouverte pluridisciplinaire HAL, est
destinée au dépôt et à la diffusion de documents
scientifiques de niveau recherche, publiés ou non,
émanant des établissements d’enseignement et de
recherche français ou étrangers, des laboratoires
publics ou privés.
Petru Borta, Léonard Monniello, M. El Kurdi, Samuel Saada, Sebastien
Sauvage, Hugues Girard, Xavier Checoury
To cite this version:
Petru Borta, Léonard Monniello, M. El Kurdi, Samuel Saada, Sebastien Sauvage, et al.. Increasing
the angular sensitivity of two-dimensional photonic crystal based sensors to arbitrary values. Optics
Express, Optical Society of America - OSA Publishing, 2019, 27 (2), pp.1578. �10.1364/OE.27.001578�.
�cea-02189427�
Increasing
the angular sensitivity of
two-dimensional
photonic crystal based
sensors
to arbitrary values
P.
B
ORTA,
1L.
M
ONNIELLO,
1M.
E
LK
URDI,
1S.
S
AADA,
2S.
S
AUVAGE,
1H.
G
IRARD,
2X.
C
HECOURY1,*1Centre de Nanosciences et de Nanotechnologies, CNRS, Univ. ParisSud, Université ParisSaclay, C2N
-Orsay, 91405 Orsay Cedex, France
2CEA LIST, Diamond Sensors Laboratory, F-91191 Gif-sur-Yvette, France
*xavier.checoury@c2n.upsaclay.fr
Abstract: A new design of photonic crystal (PhC) for optical sensing using guided mode
resonance (GMR) is presented. We theoretically show that angular sensitivity is inversely proportional to the group velocity of the probed mode and can be made arbitrarily high in a properly designed PhC. PhCs made in polycrystalline diamond on insulator are fabricated. The angular sensitivity dependence is validated. We measured modes with group velocity of c/80 at a wavelength of 800 nm. A sensitivity in the order of 500 ◦per refractive index unit is inferred, a
value much larger than the one usually encountered in PhCs.
© 2019 Optical Society of America under the terms of the OSA Open Access Publishing Agreement
1. Introduction
Optical sensors continue to trigger a lot of research due to the need for high-performing methods to selectively detect and measure low concentrations of specific m olecules i n a rea s uch as healthcare, food safety or defense and security. This interest, and in particular the interest in refractive index sensors, can be explained by their sensitivity, their selectivity when properly functionalized, low cost and high throughput. Among optical label-free sensors, i.e. detection approaches that do not need to label the targeted molecule, for example by fluorescence, photonic crystals (PhCs) are particularly versatile. They offer the possibility of fabricating structures with high quality (Q) factors, small modal volume and, as a consequence, enhanced interactions between light and matter. All these properties are very desirable ones to achieve highly sensitive and compact sensors [1]. Typically, PhC sensors can rely on the high-Q modes of a photonic crystal micro-cavity. They can also rely on the in-plane resonant modes of the PhCs, called guided mode resonances (GMR), that can be probed with collimated light from the outside. One of the key parameters of sensors is their sensitivity to a small change of the refractive index of their surroundings, due, for example, to a molecule binding event. For a wavelength interrogated sensor, this sensitivity represents the shift in wavelength ∆λ for a given refractive index variation ∆n and is expressed in nanometer per refractive index unit (nm/RIU). In the case of a micro-cavity or a GMR based PhC sensor, the wavelength sensitivity Sλ = ∆λ/∆n can be estimated by the
following perturbative analysis [2]: ∆λ λ ≈ − ∆ω ω ≈ 1 2 ∭ ∆εkEk2d3r ∭ εkEk2d3r ≈ ∆n n ∭
perturbed regionεkEk2d3r
∭
εkEk2d3r (1)
As noted in [3], in the case of single mode sensors, their sensitivity ∆λ/∆n is strictly limited
#352259 https://doi.org/10.1364/OE.27.001578
below a value of λ/n i.e., practically a value roughly around 1000 nm/RIU for biosensors probed with a 1500-nm wavelength light. These values are almost reached by the best PhC micro-cavity sensors [4,5] but remains lower than the state of the art surface plasmon resonance (SPR) based sensors, that are above 6500 nm/RIU [6] . Usually, the sensitivity of GMR PhC sensors is lower than the one of micro-cavity PhC and is around a few 100 nm/RIU, which is considered as a drawback of this kind of sensor [1].
In this paper, a new design PhC sensor that overcomes some of these limitations is proposed and experimentally demonstrated. It is based on the measurement of the shift of the angular-reflectivity resonance of a PhC supporting guided mode resonances with low group velocity, vg, when probed
with a single frequency light. In addition to a simplified detection, because this method does not require a spectrum analyzer, we show that it provides an angular sensitivity inversely proportional to vg, that can be made arbitrarily small in photonic crystals. After establishing, in a first part, the
dependence of the angular sensitivity expressed in degrees per RIU (◦/RIU) with the inverse of
the group velocity of the probed mode, we give some design rules of two-dimensional PhC in the second part to systematically achieve modes with high-Q factor and low-group velocity. The third part is dedicated to the description of the experimental realization and optical measurements. In the perspective of the realization of highly sensitive biosensors, the PhC are fabricated in polycrystalline diamond, a material with a high refractive index, low fabrication cost and ease of surface functionalizing. A PhC with a c/80 group velocity mode at a wavelength of 800 nm is measured and allows one to validate the dependence of the sensitivity with group velocity. Its sensitivity is estimated to be in the order of 500◦/RIU i.e. more than one order of magnitude
higher than the angular sensitivity of previously reported PhC sensors, around 60◦/RIU [7–9],
and similar to the one reported for SPR experiments [10–12] that can reach 500◦/RIU.
2. Enhancing angular sensitivity with low group velocity modes
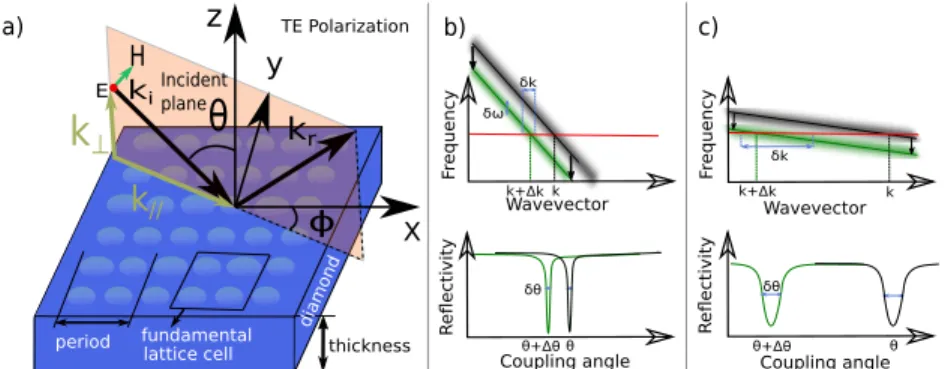
Two-dimensional photonic crystal structures that operate with guided mode resonances confine energy in the slab, but, contrary to truly guided mode or PhC cavity resonance, they can easily be coupled optically from the outside with collimated light. For the GMRs, the PhCs operate like a waveguide but also scatter light coherently like a grating when light propagates. Figure 1(a) shows such a 2D PhC with the out-of-plane light incidence directions determined by two angles, the polar angle θ (angle from the surface normal direction), and the azimuthal angle φ (angle in the x-y surface plan). The GMRs lead to a sharp angular or spectral signature that appears as a Fano lineshape in the PhC reflectivity spectra. Such spectral signatures appears when there is a phase matching between the incident wave with the guided mode resonance. We note kk the
component of the wavevector of the incident collimated light parallel to the slab. Similarly, kgmr
is the wavevector of the guided resonance, given by the dispersion relation of the GMR. Phase matching occurs when kkequals kgmr. In other words, for a given fixed frequency of the incident
light, there is a particular angle θ at which the coupling occurs as schematically shown on the dispersion curve and angular reflectivity spectrum in Fig. 1(b). In the case of a refractive index change, e.g. when a molecular binding occurs at the surface of the PhC, the dispersion curve is shifted vertically towards the lower frequencies according to Eq. (1). This results in a angular shift of the spectral characteristics since the phase matching occurs at a different wavevector (Fig. 1(b) green curves). This angular shift, ∆θ, depends on the frequency shift ∆ω but also on the group velocity vg = dωdk of the mode as can be seen on Fig. 1(c) that represents dispersion curves
with a lower group velocity as compared to the ones of Fig. 1(b). The shift of the coupling angle is larger in this case due to a larger shift of the wavevector of the guided resonance.
More precisely, in the case of small perturbations, we can consider the induced frequency and wavevector shifts as small and assimilate local dispersion curves to straight lines with slopes equal to vg. Moreover, we can expect that the dispersion curves before and after the perturbation
δω
δk
δθ δθ
δk
Coupling angle Coupling angle
R e fl ectivity R e fl ectivity Fr equenc y Fr equenc y Wavevector Wavevector b) c) θ+Δθ θ+Δθ θ θ k+Δk k+Δk k k thickness lattice cell fundamental period
θ
X y z E H Incident plane ϕ ki krk
// a)k
⊥ TE Polarization diamondFig. 1. (a) Schematic view of the photonic crystal with light injection at θ polar angle and φ azimuthal angle. (b) Top: Schematic band diagram showing the dispersion curve of a resonant mode without (black) and with (green) a refractive index perturbation. Bottom: the angular shift when probed at a constant frequency with and without refractive index perturbation. (c) Schematic band diagram showing the dispersion curve of a low group velocity mode and its associated angular shift. The width of the resonances δω and refractive index shift ∆n are identical for both cases but the slow mode has a larger angular shift and presents a wider angular resonance.
perturbed as in Figs. 1(b) and 1(c) . Using these assumptions, from the phase matching condition, kgmr(ω) = kk(ω) and by definition of kk =ωncextsin θ when light is incident from a medium with
a refractive index next, we get:
kgmr(ω) = ωnext
c sin θ (2)
and
dkgmr(ω) = ωnext c cos θdθ
with c, the speed of light in vacuum. By definition of the group velocity, ∆kgmr(ω) ≈ ∆ωvg, we
can deduce the following relations for the angle shift ∆θ expressed in degree and for the angular sensitivity, Sθ = ∆θ∆n, expressed in degree per refractive index unit (◦/RIU) :
∆θ = 180 π c vg 1 nextcos θ ∆ω ω [ ◦ ] (3) Sθ = 180π c vg 1 nextcos θ ∆ω ω∆n [ ◦/ RIU] (4)
In this Eq. (4), the sensitivity appears as being proportional to ∆ω/(ω∆n) where ∆ω/ω is given by Eq. (1). This value of ∆ω/(ω∆n) ≈ −∆λ/(λ∆n) is equal to 1/λ times the wavelength sensitivity value, Sλ, expressed in nm per RIU. Usually, this sensitivity does not vary a lot with
the polar angle θ and is very close to the one of the PhC when it is probed at normal incidence. In non-normal incidence, the angular sensitivity also depends on 1/(vgcos θ) that can be huge
when the group velocity of the mode is low or the incidence angle is large. Because the spot size obtained on the sample is limited in practice and depends on the incidence angle θ, the factor that can significantly enhance the sensitivity value of the PhC is the group velocity. Usually, low group velocity modes are encountered at wavevectors of high symmetry in the Brillouin zone of the PhC, i.e. for a very particular angle of incidence. As will be shown in the next part, it is possible using particular design to achieve low group velocity values for a large range of incident angles. This tuning of the dispersion relation to better match the properties of the incoming light is similar to the one introduced in [3] in the context of analyzing the sensitivity of wavelength interrogated
SPR sensors. We can expect to increase the GMR sensor sensitivity which is usually considered as a drawback as compared to PhC cavities [1]. Although the sensitivity can be apparently infinite for modes with group velocity approaching zero, the ability to detect small angle shifts of the modes also depends on the resonance bandwidth, δω = ω/Q where Q is the resonance quality factor. Indeed, guided resonances interrogated at a given wavevector, have a finite lifetime due to the structure design, but also because of fabrication imperfections or material absorption. In the approximation of a locally linear dispersion curve, this finite lifetime translates to a finite angle width δθ = 180
π vcg
1 nextcos θ
1
Q. Usually, a decrease of the resonance width improves the locating of
the angular resonance in the presence of noise originating, from mechanical or laser fluctuations and thus also improves the detection limit of the sensor [13]. That’s why a figure of merit (FOM) is often introduced and is usually defined as : FOM = S/δθ. In the approximation of a straight dispersion curve, this figure of merit is equal to : FOM = ∆ω/(∆nδω) = Q∆ω/(∆nω). As a consequence, it is necessary to keep Q high and vg low to have a narrow angular width and
a good detection limit of the sensor. The precise value of the detection limit, in particular in the limiting case vg→0, is out of the scope of this paper as it depends on the particular light
measurement setup used, on the hypothesis made about the noise sources and also on the exact shape of the dispersion curve. Moreover, the figure of merit is not always the right number to estimate the limit of detection of a sensor. Indeed, in some case, it has been shown that the limit of detection is proportional to√δθ/S [14], proving the interest of having a very high sensitivity. In the next section, we will show that particular two-dimensional PhC designs readily allow for modes with both the low group velocity and the high Q factor required for high sensitivity and low detection limit.
3. Robust PhC designs for low group velocity modes
Because the sensitivity and the detection limit can be tuned to extremely high values as long as a low group velocity with high Q factor is maintained, the problem of designing a highly sensitive PhC sensor reduces to be able to design a photonic crystal that presents a slow mode over some frequency and wavevector range away from the high symmetry points. Such a mode is somehow robust to fabrication imperfections since slow light is achieved for various frequencies and incidence angles. This contrasts with slow modes at the Γ point that may have a high Q but are slow only near a particular frequency at quasi-normal incidence. We show in this section how to design 2D-PhCs that support guided mode resonances with high Q factor and extremely low group velocity. Moreover, we show that some tuning on the frequency at which the group velocity cancellation occurs is possible without changing the structural parameters of the PhC i.e., even after the PhC fabrication process.
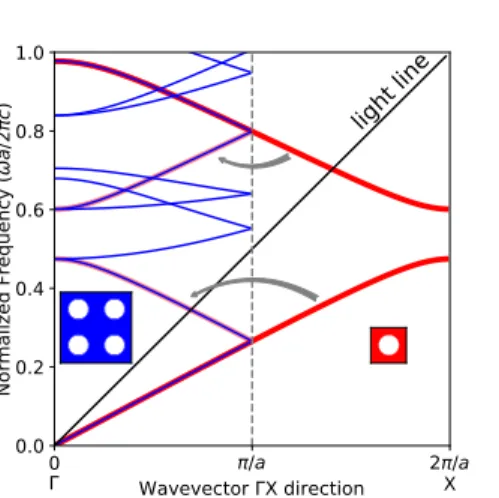
Two-dimensional photonic crystals usually consist in a membrane made in a high refractive index material perforated with circular holes organized in triangular or square lattice. Standard PhCs with one hole in the fundamental cell, do not allow a fine control of quality factor Q of the radiative modes that are inside the so-called light cone and generally offer quite low Q. A method to achieve high Q guided mode resonances consists in performing a folding of the band diagram of the PhC, for example by imposing a second period to the PhC so that the Brillouin zone is reduced and truly guided modes are folded above the light cone. For example, in [15] is demonstrated the tuning of the Q factor of resonant modes using a fundamental lattice cell made of two holes of slightly different size. Here, we use a fundamental cell made of four holes arranged in a square lattice, three of them having the same radii while the fourth is slightly larger. Figure 2 illustrates the principle of band folding for wavevectors along the ΓX direction, when the difference of the hole size, ∆r, is almost zero. Two band diagrams along the ΓX direction are superimposed: the dark red lines represent the dispersion curves of the modes of a PhC with a single hole cell, a period equal to a/2 and a hole radius r = 0.14a. The blue lines represent the dispersion curves of the modes of PhC with a four-hole cell with a period a and with all hole radii
0 /a 2 /a X Wavevector X direction 0.0 0.2 0.4 0.6 0.8 1.0 Normalized Frequency ( a/2 c)
light line
Fig. 2. Illustration of the band folding. Two band diagrams along the ΓX direction are superimposed for two square lattice PhCs: a single-hole cell PhC of period a/2 (dark red curve) and a four-hole cell PhC of period a (blue curve) with same radii, 0.14a. The light red curve indicates how some modes originate from the folding of the modes of the single hole pattern PhC due to the smaller size of the Brillouin zone of size π/a along ΓX.
almost equal to r. The first Brillouin zone of the former PhC extends along the ΓX direction from −2π/a to 2π/a (red curves) while the first Brillouin zone of the latter PhC extends from −π/a to π/a (blue curves). Because in the latter case the first Brillouin zone is smaller, some modes in blue appear as a folded version of the modes in red whose wavectors are between π/a and 2π/a. These modes are highlighted in light red. As can be seen, some of these modes, that were initially below the light cone for the single hole pattern PhC, are folded above the light cone and can couple with an incoming or outgoing wave. Other modes in blue appears due to folding of modes from other parts of the initial larger Brillouin zone, some of them being below the ligth cone. When the difference of the hole size, ∆r, tends to zero, the resonant mode tends to have the characteristics of a truly (unfolded) guided mode (below the light cone) with a quality factor approaching infinity. When ∆r is increased, the Q factor can be controlled at the desired value and, at the same time, the coupling of the guided resonance with an incoming or outgoing wave can be increased. From an experimental point of view, achieving PhC with high Q factors are not always possible since residual material absorption and fabrication imperfections can strongly reduce the targeted Q value. In this case, to have a strong reflectivity contrast, it can be advantageous to maintain the designed Q factor at a value near the expected Q factor due to extrinsic losses, such as semiconductor residual absorption, in order to approach the critical coupling with the incoming light, that occurs when the coupling losses equals the sum of other losses.
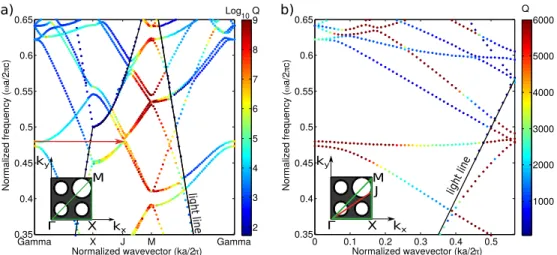
In the next part, we will use polycrystalline diamond as a material for fabricating the PhC due to its low cost, high refractive index of 2.4, transparency in the visible wavelength range and high potential for biodetection thanks to its easy functionalization. Previously fabricated PhC structures in diamond have Q factor around 6000 in the near infrared [16], so that typical targeted Q values are between 1000 and 5000 taking into account the fact that losses due to disorder in the PhC are higher at a wavelength of 800 nm than at 1500 nm. The diamond membrane thickness is h = 1.02a with a the lattice period. The fundamental lattice cell includes four holes and is arranged in a square lattice (inset Fig. 3(a)). Three holes have a radius of 0.14a. The last one can be chosen to achieve the targeted Q factor for the mode of interest and is fixed here at a value of 0.19a. Figure 3(a) represents the calculated dispersion curves with the Q factor associated for
0 0.1 0.2 0.3 0.4 0.5 0.35 0.4 0.45 0.5 0.55 0.6 0.65
Normalized wavevector (ka/2π)
Normalized frequency ( ω a/2 πc) 1000 2000 3000 4000 5000 6000 Q Gamma X J M Gamma 0.35 0.4 0.45 0.5 0.55 0.6 0.65
Normalized wavevector (ka/2π)
Normalized frequency ( ω a/2 πc) 2 3 4 5 6 7 8 9 Log10Q
light line light line
kx Γ ky X M kx Γ X J a) b) M ky
Fig. 3. (a) Band diagram calculation for TE modes with Q factors expressed on a logarithmic color scale. The inset represents the fundamental cell and the Brillouin zone Γ, X and M. The fundamental cell has four holes organized along a square lattice. The radius of the three similar holes is 0.14a, while the radius of the forth hole is 0.195a. The thickness of the slab is 1.02a. (b) Band diagram calculation for TE modes along the specific direction Γ J that
makes an angle of 28◦with the Γ X direction. The Q factors are represented on a linear
scale with a maximum value of 5000 emphasizing a value about 2500 near the light line for the targeted low group velocity mode, i.e for ω ≈ 0.474 and k ≈ 0.37.
different modes expressed on a logarithmic scale and calculated by Finite Difference in Time Domain (FDTD) with MEEP software [17].
For this kind of structure, there exists a band that has nearly the same frequency at two particular wavevectors: one is at the Γ point, at the center of the Brillouin zone and the other one is at some particular wavevector, denoted J, between the points of high symmetry, X and M, at the boundary of the Brillouin zone (see the arrow at frequency 0.48 in Fig. 3(a)). For wavevectors between the Γ point and the J point, the band, i.e. the eigenfrequency, is a real differentiable function of the modulus of the wavevector. This function attains equal values at two distinct points. A mathematical property of such functions is that their first derivative is zero somewhere between these two points. This means that the group velocity is zero for a wavevector between the Γ point and the J point. By extension, because the band is a smooth function, the group velocity remains low for a wide range of wavevectors along the Γ J direction, as can be seen Fig. 3(b). Indeed, when the wavevector is varied along the Γ J direction (here at 28◦from
the Γ X direction along the red line in the inset of Fig. 3(b)), a mode with a frequency near 0.47 and a low group velocity is present above the light cone. Moreover, after the fabrication, the frequency at which the group velocity cancellation occurs can be tuned by ≈5% by changing the wavevector direction around the Γ J direction by a few degrees as will be shown in the next part. The Q factor of the slow mode for wavevectors around 0.4 near the light line, i.e. for large angle of incidence of the light, is around 2000 and can be tuned by changing the size of the largest hole. For this mode, the spectral sensitivity is simulated to be equal to ∆λ/∆n ≈ −∆ωλ/(ω∆n) = 172 nm/RIU. At an incidence angle of 52◦, i.e. a wavevector of 0.37, a low group velocity of
c/80 is achieved at ω = 0.474, and a high sensitivity of 1600◦/RIU is deduced according to Eq.
(3) for such a PhC. This expected value of the sensitivity is much higher than the one reported for 1D PhC, 31.8◦/RIU [9] and 40.92◦/RIU [7] or for 2D PhC 65◦/RIU [8]. This value is also
higher than the one reported for SPR experiments where typical values are 51.857◦/RIU [10],
4. Experimental demonstration of slow modes and sensitivity enhancement
The measured structures consist of square PhCs with a size of 200×200 µm2etched in a 388-nm
thick polycrystalline diamond slab. The diamond layer rests on a 2.5-µm thick silica layer on top of a silicon wafer. It is obtained by using a bonding technique: first, a 5-µm thick polycrystalline diamond is grown on a silicon wafer and then smoothed as described in [16,18]. A second wafer consisting in thermally grown oxide on silicon is then prepared. The first wafer is then covered with hydrogen silsesquioxane resist (HSQ) by spin coating and baked on a hot plate at 150◦C. It
is then attached to the second wafer in vacuum at 400◦C using a wafer bonder. The initial wafer
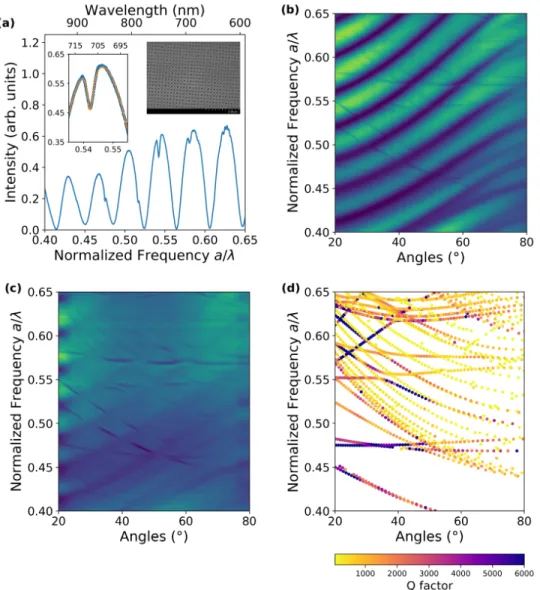
used for the growth is removed and the diamond is then thinned down to a thickness of 388nm. The photonic crystal has a period a = 384 nm. The unit cell consists in four holes, three with a small radius of 54 nm and one with a large hole radius of 73 nm as in the previous part. The PhC is fabricated as described in [16,18] using electronic lithography and inductively coupled plasma etching of the diamond slab. The scanning electron microscope image of the structure is provided in the inset on the right of Fig. 4(a).
Experimental band diagrams are obtained by measuring the reflectivity spectra of the PhC at various polar angles θ and at a given azimuthal angle φ (see Fig. 1(a) for the geometry). Light from a white source (520 nm to 1170 nm) is collimated onto the PhC at a particular incidence angle θ. The reflected light at the angle θ is collected by another collimator and sent to a spectrometer through an optical fiber. Figure 4(a) shows a reflection spectrum in arbitrary unit acquired for azimuthal angle φ = 26◦and polar angle θ = 23◦. The diamond on insulator
structure used here is suitable for guided optics but in the case of guided resonances probed with collimated light, it generates strong Fabry-Perot oscillations caused by the multiple reflections in the SiO2layer between the diamond and silicon interfaces as seen in Fig. 4(a). In Fig. 4(a)
guided mode resonances, appearing as sharp dips in the Fabry-Perot spectrum, can be clearly observed. Fitting the dip with a Fano lineshape plus a second order polynomial of the frequency to take into account the Fabry-Perot background, as shown in the inset on the left of Fig. 4(a), gives typical Q factors between 200 and 400 at wavelengths near 700 nm. These values are lower than the one simulated and can be attributed to fabrication imperfections as well as to some residual absorption of the polycrystalline diamond material [18]. Future achievements with improved technological processes and diamond quality will significantly increase this quality factor. The reconstructed band diagram for φ = 26◦and θ varying from 20◦to 80◦by 0.09◦steps
is represented in Fig. 4(b) with normalized frequency a/λ as a function of the angle θ, with λ being the wavelength. The PhC modes are clearly visible despite the Fabry-Perot oscillations. The Fabry-Perot oscillation can be attenuated and the visibility of the PhC modes enhanced by using a cross-polarizer setting or, as shown Fig. 4(c), doing data processing to specifically filter out the frequency of the Fabry-Perot oscillations. To do this, the measured reflectivities, that are measured on a regularly spaced grid in λ and θ, are first represented on a regularly spaced grid in frequency and cos θ. Then, the data is digitally filtered with a two-dimensional Gaussian filter to eliminate the spatial frequency corresponding to the Fabry-Perot pattern. Finally, the filtered data are represented back as a function of λ and θ. The simulated band diagram taking into account the silica and silicon layer under the diamond slab is shown Fig. 4(d). One can observe a very good agreement between experimental data and the simulations. Some differences in the frequency of the modes between simulations and experimental data can be explained by some fabrication imperfections in the shape of the holes and the polycrystalline nature of the diamond that induces some inhomogeneity in the slab and an absorption of light in the 600 nm to 800 nm range. More modes are present as compared to the suspended membrane. In particular, because of the silica layer, there is no vertical symmetry anymore and TE or TM modes are both visible even if, obviously, the coupling with incident light is different from one to the other. There are two modes with low group velocity that exist as in the case of the suspended membrane studied in the previous section for a particular interrogation direction 28◦from the ΓX direction. This
Fig. 4. (a) Measured spectrum for azimuthal angle φ = 26◦and polar angle θ = 23°. Inset on
the left: Fano fit (orange line) of the resonance near a/λ = 0.55. Inset on the right: SEM image of the fabricated photonic crystal in polycrystalline diamond. (b) Band diagram of fabricated sample as measured in the specific interrogation direction ΓJ (26 ° from the ΓX direction). (c) Corresponding measured spectrum with data filtered of Fabry-Perot interferences. (d) Simulated band diagram for the corresponding structure.
20
30
40
50
60
70
Angles (°)
0.450
0.455
0.460
0.465
0.470
0.475
0.480
0.485
Normalized Frequency
/a
20° 20° 22° 22° 24° 24° 26° 26° 28° 28° 30° 30° experimental data Polynomial fit> 0.1
0.03
0.01
0.003
< 0.001
Group velocity (
v
g/c log scale)
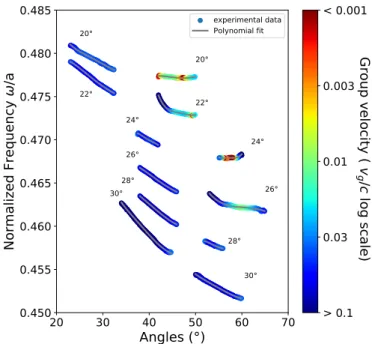
Fig. 5. Normalized energy of the mode as a function of the angle θ for various φ equal to
20◦, 22◦, 24◦, 26◦, 28◦and 30◦. Continuous lines correspond to the best polynomial fit and
colors to the group velocity vg/c.
shows the robustness of our design approach for achieving low group velocity mode at high incidence angle.
In order to measure the group velocity, the slow mode has been fitted in each spectra by a Fano profile. The evolution of the energy of the mode as a function of the angle θ for various φ is represented in Fig. 5. Due to the reflection cancellation resulting from the Fabry-Perot oscillations, the dispersion curves are interrupted. Nevertheless, each set of points can be fitted by a 4th-order polynomial function of the wavevector k| | = ω
csinθ. This polynomial function
is represented by a continuous line. The derivative of these fitted polynomials gives the values of vg/cwhich are depicted in a colored log scale. In particular, for the mode with φ=26◦and
ω=0.463, we show that a group velocity around c/100 can be obtained and measured for angles between 58◦and 62◦. Low group velocity modes below c/100 can also be measured for values
of φ between 20◦and 24◦but at smaller θ and larger frequency ω. In particular, the frequency at
which the group velocity cancels can be tuned by more than 3% by changing the azimuthal angle φ of the incident light. This tuning capability can be used to precisely match the frequency of the PhC slow mode with the one of a fixed frequency laser. This property is important in the view of the practical realization of a refractive index sensor, where a monochromatic laser is used to assess the angular reflectivity changes with a change in the refractive index of the environment. Finally, to measure the dependence of the photonic crystal sensitivity with group velocity and check the applicability of the Eq. (3) to small refractive index changes, we measured the band diagrams at different temperatures from 20◦C to 80◦C. The frequency shift of the modes ∆ω is
due to the refractive index change of the diamond and of the underlying silica. It can also be due to the desorption of adsorbed contaminants on the diamond surface as shown in [19] but the refractive index changes remain small on the explored temperature range.
In band diagram, refractive index changes lead to variations of the frequency of the band (∆ω) for a fixed angle of incidence of the light. However, at a fixed frequency, refractive index
20 30 40 50 60 70 80 Temperature (°C) 0.0 0.5 1.0 1.5 2.0 2.5 3.0 Angle shift 0.00 0.25 0.50 0.75 1.00 1.25 1.50 1.75
Relative frequency shift cos
0.0 0.5 1.0 1.5 2.0 2.5 Angle shift (degrees) x103
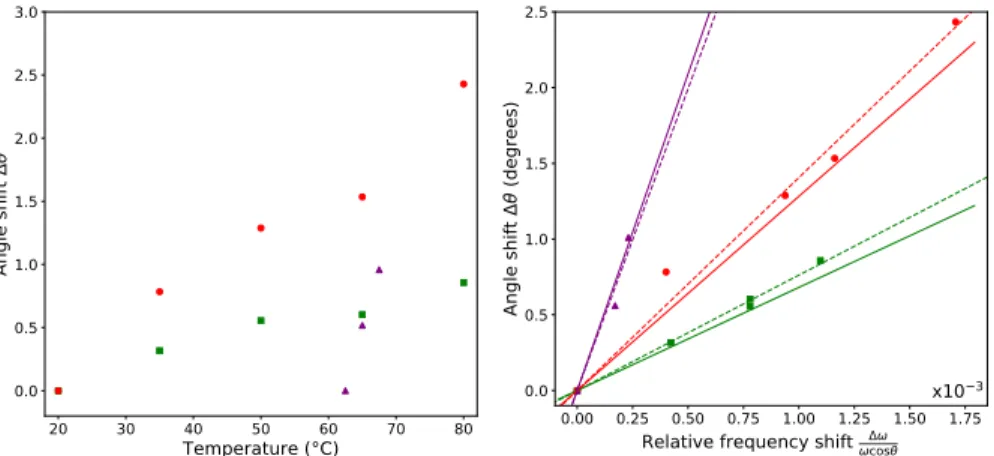
Fig. 6. (a) Angle shift with the temperature for three different modes with three group
velocities : vg/c= 0.08 (green squares), 0.04 (red circles) and 0.013 (purple triangles). (b)
Angle shift as a function of the relative energy shift using same symbols as for Fig. (a). The
dotted lines are linear fit to the data. The plain lines have a slope of180π c
vg calculated from
the unperturbed band diagram of corresponding mode.
changes result in a variation (∆θ) of the angle at which the coupling occurs between the incident light and the guided mode resonance. Figure 6(a) shows the angle variation ∆θ of three modes with the temperature. The first mode (θ = 37◦, φ = 30◦, ω = 0.46) presents a group velocity
vg of c/12 (green squares), the second one (θ = 58◦, φ = 30◦, ω = 0.452) a vgof c/25 (red
circles) and the third one (θ = 45, φ = 22, ω = 0.473) a vg of c/80 (purple triangles). The
fastest mode experienced a shift of 0.8◦over 60◦C, the second one a shift of 2.5◦over the same
course. The slowest mode was interrogated only over 5◦C from 62.5◦C to 67.5◦C and already
showed a shift of 1◦. From Eq. (3), we deduce that, for small angle and refractive index changes,
there exists a linear relation between ∆θ and ∆ω
ωcosθ, with a proportionality factor of 180π vcg . To
analyze this point, Fig. 6(b) shows the same angle shift as the one in Fig. 6(a) but with the abscissa replaced with the relative frequency shift ∆ω/(ω cos θ). As expected a good linearity relation is achieved between angle shift and the frequency shift (dotted lines). Moreover, in Fig. 6(b) are also represented straight lines with slopes equal to180
π vcg calculated directly from the
unperturbed band diagram. As can be seen, the straight lines have almost the same slope as the one of a linear fit to the data. We show here two independent measures of the group velocity, one with a change of the coupling angle and frequency with the temperature through the Eq. (3), and one directly from a band diagram measurement at a fixed temperature. These two measures are in good agreement, hence validating the model used [Eq. (3)] to calculate the angular shift and the PhC sensitivity to refractive index change.
In order to estimate what would be the sensitivity in degrees per RIU of the fabricated PhC to refractive index changes of the surrounding environment only, a FDTD simulation can be performed to relate the frequency shift measured for a 5◦C temperature elevation to what would
be the corresponding refractive index change of the bulk environment above the PhC. Several FDTD simulations of the measured structure have been performed by varying the refractive index above the PhC from 1 to 1.005 in increments of 10-3. From these simulations, the frequency of
the slowest mode has been calculated and a linear relation has been then established between the relative frequency shift ∆ω/ω and the refractive index change ∆n. For this slowest mode, the experimentally measured relative frequency shift is, ∆ω/ω = 1.56 × 10⁻⁴, due to an increase
of 5◦C. From the linear relation established with the simulations, this frequency shift has been
can deduce a sensitivity of 526◦/RIU. This sensitivity is one order of magnitude higher than the
one achieved by PhC based sensors [7–9] and similar to that achieved by best SPR sensors [10–12]. These experiments also show that future biosensors based on this kind of highly sensitive photonic crystal will need to be strictly controlled in temperature or to incorporate a reference PhC in order to distinguish between small temperature changes and molecule recognitions. The reason why higher sensitivities have not been reached in this experiment despite the very low group velocities measured is attributed to the modest quality factor of the PhC mode. These low Q factors prevent the accurate measurement of small angle shifts when the group velocity is strongly decreased due to the angular enlargement of the resonance in the reflectivity spectra. Better fabrication processes and lower absorption in the diamond material should allow one to reach the extraordinary high sensitivities predicted by the simulations.
5. Conclusions
We have shown that the sensitivity of guided mode resonances PhC sensors, that are usually considered as less efficient than micro-cavity PhC sensors, can be greatly increased. If angle shift measurements are done at a fixed frequency, we have shown that the angular sensitivity is inversely proportional to the group velocity of the GMR. We proposed a design rule of the PhC that allows low group velocity modes that are robust to fabrication imperfections. As a proof of concept, we fabricate a PhC in polycrystalline diamond with group velocity below c/100 and probed the angle shift induced by an increase in the temperature of the sample. We demonstrated an increase of the sensitivity inversely proportional to the group velocity and inferred an angular sensitivity of the sensor equal to 526◦/RIU, i.e. one order of magnitude higher than previously
reported PhC based sensors. These results represent a first step toward a more advanced highly sensitive bio-sensor including surface functionalization of the diamond surface for specific target recognition.
Funding:
Region Ile-de-France in the framework of DIM Nano-K (P. Borta’s PhD grant); “Investissements d’Avenir” program (Labex NanoSaclay, reference: ANR-10-LABX-0035); French RENATECH network.
References
1. G. Pitruzzello and T. F. Krauss, “Photonic crystal resonances for sensing and imaging,” J. Opt. 20, 073004 (2018). 2. J. Joannopoulos, S. Johnson, J. Winn, and R. Meade, Photonic Crystals: Molding the Flow of Light - Second Edition
(Princeton University, Princeton, NJ, 2008).
3. Z. Yu and S. Fan, “Extraordinarily high spectral sensitivity in refractive index sensors using multiple optical modes,” Opt. Express 19, 10029–10040 (2011).
4. M. Huang, A. A. Yanik, T.-Y. Chang, and H. Altug, “Sub-wavelength nanofluidics in photonic crystal sensors,” Opt. Express 17, 24224–24233 (2009).
5. B. Wang, M. A. Dündar, R. Nötzel, F. Karouta, S. He, and R. W. van der Heijden, “Photonic crystal slot nanobeam slow light waveguides for refractive index sensing,” Appl. Phys. Lett. 97, 151105 (2010).
6. P. Pfeifer, U. Aldinger, G. Schwotzer, S. Diekmann, and P. Steinrücke, “Real time sensing of specific molecular binding using surface plasmon resonance spectroscopy,” Sensors Actuators B: Chem. 54, 166 – 175 (1999). 7. V. N. Konopsky and E. V. Alieva, “Photonic crystal surface waves for optical biosensors,” Anal. Chem. 79, 4729–4735
(2007).
8. E. Hallynck and P. Bienstman, “Photonic crystal biosensor based on angular spectrum analysis,” Opt. Express 18, 18164–18170 (2010).
9. A. Sinibaldi, A. Anopchenko, R. Rizzo, N. Danz, P. Munzert, P. Rivolo, F. Frascella, S. Ricciardi, and F. Michelotti, “Angularly resolved ellipsometric optical biosensing by means of Bloch surface waves,” Anal. Bioanal. Chem. 407, 3965–3974 (2015).
10. K. D. Vos, I. Bartolozzi, E. Schacht, P. Bienstman, and R. Baets, “Silicon-on-insulator microring resonator for sensitive and label-free biosensing,” Opt. Express 15, 7610–7615 (2007).
11. C. Hu, “Surface plasmon resonance sensor based on diffraction grating with high sensitivity and high resolution,” Optik 122, 1881–1884 (2011).
12. X. Sun, X. Shu, and C. Chen, “Grating surface plasmon resonance sensor: angular sensitivity, metal oxidization effect of al-based device in optimal structure,” Appl. Opt. 54, 1548–1554 (2015).
13. I. M. White and X. Fan, “On the performance quantification of resonant refractive index sensors,” Opt. Express 16, 1020–1028 (2008).
14. R. Rizzo, N. Danz, F. Michelotti, E. Maillart, A. Anopchenko, and C. Wächter, “Optimization of angularly resolved bloch surface wave biosensors,” Opt. Express 22, 23202–23214 (2014).
15. C. Nicolaou, W. T. Lau, R. Gad, H. Akhavan, R. Schilling, and O. Levi, “Enhanced detection limit by dark mode perturbation in 2D photonic crystal slab refractive index sensors,” Opt. Express 21, 31698–31712 (2013). 16. C. Blin, X. Checoury, H. A. Girard, C. Gesset, S. Saada, P. Boucaud, and P. Bergonzo, “Optical analysis of p-type
surface conductivity in diamond with slotted photonic crystals,” Adv. Opt. Mater. 1, 963–970 (2013).
17. A. F. Oskooi, D. Roundy, M. Ibanescu, P. Bermel, J. Joannopoulos, and S. G. Johnson, “Meep: A flexible free-software package for electromagnetic simulations by the FDTD method,” Comput. Phys. Commun. 181, 687–702 (2010). 18. X. Checoury, D. Neel, P. Boucaud, C. Gesset, H. Girard, S. Saada, and P. Bergonzo, “Nanocrystalline diamond
photonics platform with high quality factor photonic crystal cavities,” Appl. Phys. Lett. 101, 171115 (2012). 19. C. Blin, Z. Han, H. A. Girard, P. Bergonzo, P. Boucaud, M. E. Kurdi, S. Saada, S. Sauvage, and X. Checoury,