Original article
Use of coronary calcium score scans from stand-alone multislice
computed tomography for attenuation correction of myocardial
perfusion SPECT
Tiziano Schepis1, 4, Oliver Gaemperli1, 4, Pascal Koepfli1, 4, Christine Rüegg1, Cyrill Burger1, Sebastian Leschka2, Lotus Desbiolles2, Lars Husmann2, Hatem Alkadhi2, Philipp A. Kaufmann1, 3, 4
1Clinic of Nuclear Medicine, Nuclear Cardiology, University Hospital Zurich, Zurich, Switzerland 2Institute of Diagnostic Radiology, University Hospital Zurich, Zurich, Switzerland
3Centre for Integrative Human Physiology, University of Zurich, Zurich, Switzerland 4Cardiovascular Center, University Hospital Zurich, Raemistrasse 100, Zurich, Switzerland
Received: 10 March 2006 / Accepted: 11 May 2006 / Published online: 4 August 2006 © Springer-Verlag 2006
Abstract. Purpose: To evaluate the use of CT attenuation
maps, generated from coronary calcium scoring (CCS)
scans at in- and expiration with a 64-slice CT scanner, for
attenuation correction (AC) of myocardial perfusion
SPECT images.
Methods:
Thirty-two consecutive patients
underwent
99m
Tc-tetrofosmin gated adenosine stress/rest SPECT scan
on an Infinia Hawkeye SPECT-CT device (GE Medical
Systems) followed by CCS and CT angiography on a
64-slice CT. AC of the iteratively reconstructed images was
performed with AC maps obtained: (a) from the
“Hawkeye”
low-resolution X-ray CT facility attached to the Infinia
camera (IRAC); (b) from the CCS scan acquired on a
64-slice CT scanner during maximal inspiration (AC
INSP) and
(c) during normal expiration (AC
EXP). Automatically
determined uptake values of stress scans (QPS, Cedars
Medical Sinai) from AC
INSPand AC
EXPwere compared
with IRAC. Agatston score (AS) values using AC
INSP-versus AC
EXPwere also compared.
Results: AC
INSPand AC
EXPresulted in identical findings
versus IRAC by visual analysis. A good correlation for
uptake values between IRAC and AC
INSPwas found (apex,
r=0.92; anterior, r=0.85; septal, r=0.91; lateral, r=0.86;
inferior, r=0.90; all p<0.0001). The correlation was even
closer between IRAC and AC
EXP(apex, r=0.97; anterior,
r=0.91; septal, r=0.94; lateral, r=0.92; inferior, r=0.97; all
p<0.0001). The mean AS during inspiration (319±737) and
expiration(317±778) was comparable (p=NS).
Conclusion: Attenuation maps from CCS allow accurate
AC of SPECT MPI images. AC
EXPproved superior to
AC
INSP, suggesting that in hybrid scans CCS may be
performed during normal expiration to allow its additional
use for AC of SPECT MPI.
Keywords: SPECT-CT
– Attenuation correction –
Multislice computed tomography
–
Coronary calcium score
Eur J Nucl Med Mol Imaging (2007) 34:11–19
DOI 10.1007/s00259-006-0173-8
Introduction
Non-uniform soft tissue photon attenuation adversely
affects the diagnostic accuracy of single-photon emission
computed tomography (SPECT) myocardial perfusion
imaging (MPI) [
1
]. Several methods for attenuation
correction have been proposed [
2
], most of them using
attenuation maps based on radionuclide line sources [
3
–
5
].
Recently, however, the use of computed tomography (CT)
attenuation correction (AC) has been introduced [
6
] and
established for MPI SPECT [
7
,
8
], as well as for
quan-titative positron emission tomography MPI [
1
,
9
]. Since CT
can acquire images with a far higher spatial resolution and
higher photon flux, the transmission scan can be acquired
in a much shorter time and with higher quality than can be
obtained from a conventional radionuclide transmission
scan. CT has been shown to yield good results for AC [
10
],
especially if correction for misalignment between SPECT
and the attenuation map is performed [
8
]. Considering the
widespread use of SPECT MPI and the increasing interest
in multislice CT for the non-invasive assessment of patients
with known or suspected coronary artery disease (CAD),
Philipp A. Kaufmann ()) Cardiovascular Center, University Hospital Zurich, Raemistrasse 100,
8091 Zurich, Switzerland e-mail: [email protected]
it appears important in view of the upcoming generation of
hybrid SPECT-CT scanners to evaluate whether multislice
CT data from coronary calcium scoring (CCS) can also be
used for generation of reliable attenuation maps to correct
MPI SPECT. It has been previously shown that the
respiration-dependent change in attenuation values is a
possible drawback of CT-based AC [
11
,
12
]. The
attenua-tion map obtained with the lower resoluattenua-tion X-ray-based CT
data (obtained with a matrix of 128×128) of hybrid
SPECT-CT systems represents an average over many breathing
cycles. By contrast, data acquisition with a modern
multi-slice CT scanner occurs within fractions of a breath-hold [
1
].
The purpose of this study was, therefore, to
prospec-tively compare the effect of AC on iteraprospec-tively reconstructed
SPECT images with the
“Hawkeye” low-resolution X-ray
CT facility attached to the Infinia camera (IRAC) versus
high-resolution CT attenuation maps generated from CCS
with a 64-slice CT scanner during inspiration or expiration.
Materials and methods
Study population
We prospectively analysed 32 patients (15 females, 17 males) referred for gated SPECT for known or suspected CAD. Their mean age was 66±11 years (range 41–89 years), and their mean body mass index, 29±4 kg/m2. Six patients had a history of previous myocardial infarction (two anterior wall infarctions and four inferior wall infarctions). Each patient subsequently underwent CCS and CT angiography on a 64-slice CT scanner. The mean time interval between SPECT and CT angiography was 1±4 days. The study protocol was approved by the local ethics committee and written informed consent was obtained from all subjects.
SPECT imaging
All patients underwent a 1-day stress (0.14 mg/kg/min adenosine i.v.)/ rest MPI protocol using a dose of 300 MBq and 900 MBq of99m Tc-tetrofosmin, respectively. Data acquisition was performed on a hybrid SPECT-CT dual-head detector camera with the Hawkeye facility (Infinia, General Electric Medical Systems, Milwaukee, WI, USA). Emission data were acquired with a parallel-hole, low-energy, high-resolution collimator with a 20% symmetric window centered at 140 keV. Further acquisition parameters were 3° rotation per stop, 180° each head, and 25 s per projection. Acquisitions were gated for 16 frames per R-R cycle with an acceptance window of 50%. Immediately after acquisition of SPECT images, a low-dose CT for AC was performed by use of the GE Hawkeye system [6] with the following parameters: 140 kV, 3.0 mA, with a single slice being imaged in about 14 s. CT images were reconstructed at a 10-mm section thickness by using a standard reconstruction algorithm with a 128×128 matrix and a full-chest-size-adapted field of view (FOV) of 50 cm×50 cm.
CT imaging
For CCS each patient underwent a 64-slice CT examination on a LightSpeed VCT Scanner (General Electric Medical Systems, Milwaukee, WI, USA). Previous studies have suggested that
acquisition of the CT attenuation map with free breathing and post-exhalation breath-hold resulted in better matching with SPECT and PET images than did acquisition with post-inhalation breath-hold [11, 12]. By contrast, CCS is routinely performed during deep inspiration. Therefore, two CT scans for attenuation correction—one during maximum inspiration and one during normal expiration— were performed, covering the entire heart using prospectively ECG-triggered sequential images at 70% of the R-R interval, 2.5-mm section thickness, and 0.35 s gantry rotation time at 120 kV and 200– 250 mA, depending on the patient’s size. Normal expiration was defined as the respiration level achieved when a patient, after inspiration and expiration, held his or her breath without forcefully exhaling. CT images were reconstructed at a 5.0-mm section thickness by using a reconstruction algorithm with a 512×512 matrix and a full-chest-size-adapted FOV of 50 cm×50 cm. The recon-structed CT images were then transferred to the Xeleris workstation (GE Medical Systems, Milwaukee, WI, USA).
CT attenuation correction of emission images
All stress and rest SPECT images were iteratively reconstructed using three different types of CT-based transmission data: (a) using the“Hawkeye” low-resolution X-ray CT data (IRAC) as a standard, (b) using the CCS scan data generated with the 64-slice CT obtained during deep inspiration (ACINSP) and (c) during normal expiration (ACEXP). For processing purposes the CT and SPECT data were loaded into a prototype version of the enhanced InfiniaQGS protocol within the Xeleris 1.1427 software. In a first step the CT images were fused with the uncorrected SPECT images to verify the alignment, as previously reported [8]. When necessary, the location of the CT images was interactively adjusted by shifting and/or rotating the images in all directions until the myocardium visible in the SPECT images was entirely overlying heart tissue in the CT images, following as closely as possible the CT myocardium contours (Fig.1). The aligned CT images were then transformed into SPECT attenuation maps by the following steps: First, the CT images were reformatted into a volume with the same voxel and matrix size as the SPECT images. Then, the CT Hounsfield values were transformed into linear attenuation coefficients corresponding to the energy of the SPECT emission photons. For CT values below 0, attenuation was assumed to have an energy dependence similar to water, while CT values above 0 were treated as a mixture of bone and water. Hereby, the transformation considered the effective CT energy spectrum. Next, the attenuation maps were smoothed in all three directions with a Gaussian filter to adjust the resolution to that of the SPECT data, taking into account the SPECT voxel size. Finally, the CT-based attenuation coefficients were included in an iterative ordered subsets emission maximisation algorithm (OSEM, two iterations, ten subsets, Butterworth filter with critical frequency 0.25 and power 5.0) to reconstruct attenuation-corrected SPECT images. The resulting transaxial slice images had a 64×64 matrix and voxel dimensions of 6.8×6.8×6.8 mm3.
Visual analysis of attenuation-corrected SPECT images
Consensus reading with regard to the presence and location of reversible and/or fixed perfusion defects in five left ventricular regions (apical, anterior, septal, lateral, and inferior) was performed by two experienced nuclear cardiologists on short-axis, horizontal and vertical long-axis slices as well as the polar maps. The results from ACINSPand ACEXPwere compared with those obtained from IRAC. In cases of disagreement between the three AC methods, CT
coronary angiography, which was obtained after CCS in all patients, was available as an external reference.
Quantitative regional uptake values, defect extent and summed perfusion scores
Attenuation-corrected stress and rest SPECT images obtained using either IRAC, ACINSP or ACEXP were displayed as short-axis, horizontal and vertical long-axis slices using the QPS/QGS software package (Cedars-Sinai Medical Center, Los Angeles, CA, USA) [13]. Perfusion SPECT images were analysed using a 20-segment model for the left ventricle [14]. Polar maps were normalised to 100% peak activity and relative percentage counts uptake of gamma ray emissions was assessed and automatically rated for each of the 20 myocardial segments using a five-point scale (0=normal uptake, 1=mildly reduced uptake, 2=moderately reduced uptake, 4=severely reduced uptake and 4=no uptake), as previously described [15,16]. Briefly, the summed stress score (SSS) and summed rest score (SRS) were calculated as the sums of scores of the 20 segments in the stress and rest images, respectively. The percent uptake values are only provided for stress scans, as these were performed with a low dose
activity according to the protocol and, therefore, were potentially more prone to artefacts introduced by AC. In addition, the quantitative defect extent was expressed as a percentage of the total left ventricular myocardium. Because the effect of AC may vary substantially from region to region owing to anatomical non-uniformity, as demonstrated by Ficaro et al. [17], we assigned the 20 segments of the left ventricular myocardium to five regions of the left ventricle: apex (segments 19 and 20), anterior (segments 1, 2, 7, 8, 13 and 14), septal (segments 3, 9 and 15), lateral (segments 5, 6, 11, 12, 17 and 18), and inferior (segments 4, 10 and 16).
Coronary calcium scoring
CCS was quantified for the two CT scans obtained by ACINSPand ACEXP. CT images were reconstructed at a 3.0-mm section thickness by using a reconstruction algorithm with a 512×512 matrix and a FOV of 25 cm×25 cm. Coronary artery lesions were manually planimetered using the SmartScore software on a GE Advantage Windows workstation version 4.2 (GE Medical Systems, Milwaukee, WI, USA) to obtain the total calcium burden in the coronary arteries, providing the Agatston Score Equivalent for a multi-detector CT
Fig. 1. Coronal, sagittal and transaxial CT images were fused with the non-corrected SPECT images to verify the alignment of the co-registration. When necessary, misalignment was corrected by manually adjusting CT images to best match MPI SPECT images
acquisition [18], where coronary calcification was defined as a lesion with an area greater than 1 mm×1 mm and a peak intensity greater than 130 Hounsfield units. CCS was determined for the four main coronary arteries in all slices and summed to generate the total score.
Statistical analysis
Values are expressed as mean±standard deviation. Pearson correla-tion coefficient and Bland and Altman analysis [19] were used for continuous values, while a chi-squared test was used to compare categorical visual analysis of ACINSPand ACEXPagainst IRAC. To assess the reliability for the retrospective alignment between the uncorrected SPECT and CT images, intra- and inter-observer reproducibility for quantitative regional uptake values using ACINSP and ACEXP was determined for the first ten consecutive patients using linear regression analysis. Differences in mean values for
summed perfusion scores and defect extent between IRAC, ACINSP and ACEXPwere compared by using analysis of variance for repeated measures (ANOVA). Differences in mean values for coronary calcium score between ACINSPand ACEXPwere compared using a two-sided paired Student’s t test. For all analyses, p<0.05 indicated a statistically significant difference. All statistical analyses were performed using a commercially available software package (Stat-View for Windows, Version 5.0.1, SAS Institute, Cary, NC, USA).
Results
Visual analysis of attenuation-corrected SPECT images
Visual analysis with IRAC revealed fixed perfusion defects
in six patients (two antero-apical infarctions, four inferior
infarctions) and reversible defects in four patients (apical,
anterior, lateral, and inferior ischaemia, n=1 each). In six of
the remaining 22 patients there were minimal defects
attributable to edge phenomena and fringe effects of the
septum, which were, therefore, not considered to be
perfusion defects. AC
INSPand AC
EXPshowed identical
findings
compared
with
IRAC
by visual
analysis
(p<0.0001 for chi-squared test).
Defect extent and summed perfusion scores
The mean values of rest and stress defects as well as the
summed scores for IRAC, AC
INSPand AC
EXPare given in
Table
1
. No statistically significant difference regarding the
defect extent and the summed perfusion scores was found
between either AC method (p=NS for ANOVA). Excellent
correlations were found for the SSS between IRAC and
AC
INSP(r=0.88, p<0.0001) and between IRAC and
AC
EXP(r=0.95, p<0.0001). Similarly, excellent
correla-tions were obtained for the SRS between IRAC and
AC
INSP(r=0.95, p<0.0001) and between IRAC and
AC
EXP(r=0.97, p<0.0001), while the correlation between
IRAC and AC
INSPand between IRAC and AC
EXPfor the
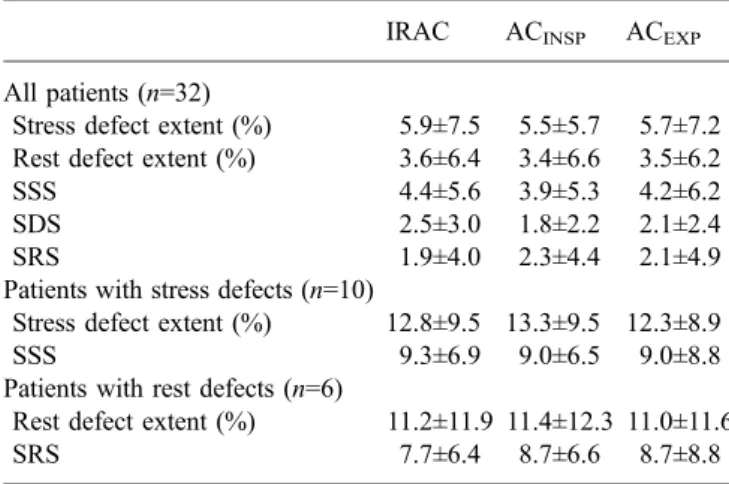
Table 1. Mean values of defect extent and summed perfusion scoresIRAC ACINSP ACEXP All patients (n=32)
Stress defect extent (%) 5.9±7.5 5.5±5.7 5.7±7.2 Rest defect extent (%) 3.6±6.4 3.4±6.6 3.5±6.2
SSS 4.4±5.6 3.9±5.3 4.2±6.2
SDS 2.5±3.0 1.8±2.2 2.1±2.4
SRS 1.9±4.0 2.3±4.4 2.1±4.9
Patients with stress defects (n=10)
Stress defect extent (%) 12.8±9.5 13.3±9.5 12.3±8.9
SSS 9.3±6.9 9.0±6.5 9.0±8.8
Patients with rest defects (n=6)
Rest defect extent (%) 11.2±11.9 11.4±12.3 11.0±11.6
SRS 7.7±6.4 8.7±6.6 8.7±8.8
All comparisons between AC methods revealed p=NS
IRAC attenuation correction (AC) using the Hawkeye low-resolution X-ray CT data, ACINSPAC using the CCS scan data obtained during inspiration, ACEXPAC using the CCS scan data obtained during expiration, SSS summed stress score, SDS summed difference score, SRS summed rest score
Table 2. Localisation and degree of MPI defects
Patient no. Sex/age (yrs) Localisation of MPI defect Diseased artery Stress defect extent (%)
IRAC ACINSP ACEXP
1 M/75 Antero-apical scar LAD 33 34 32
10 M/68 Inferior scar RCA 23 22 21
11 F/68 Lateral ischaemia LCX 6 8 6
12 F/56 Apical ischaemia LAD 3 3 3
13 F/78 Anterior ischaemia LAD 10 11 9
21 M/89 Inferior scar RCA 10 12 10
26 M/71 Inferior ischaemia RCA 15 16 15
30 M/69 Inferior scar RCA 17 15 16
31 F/77 Antero-apical scar LAD 9 11 9
32 M/88 Inferior scar RCA 3 3 3
LAD left anterior descending coronary artery, LCX left circumflex coronary artery, RCA right coronary artery, MPI myocardial perfusion imaging
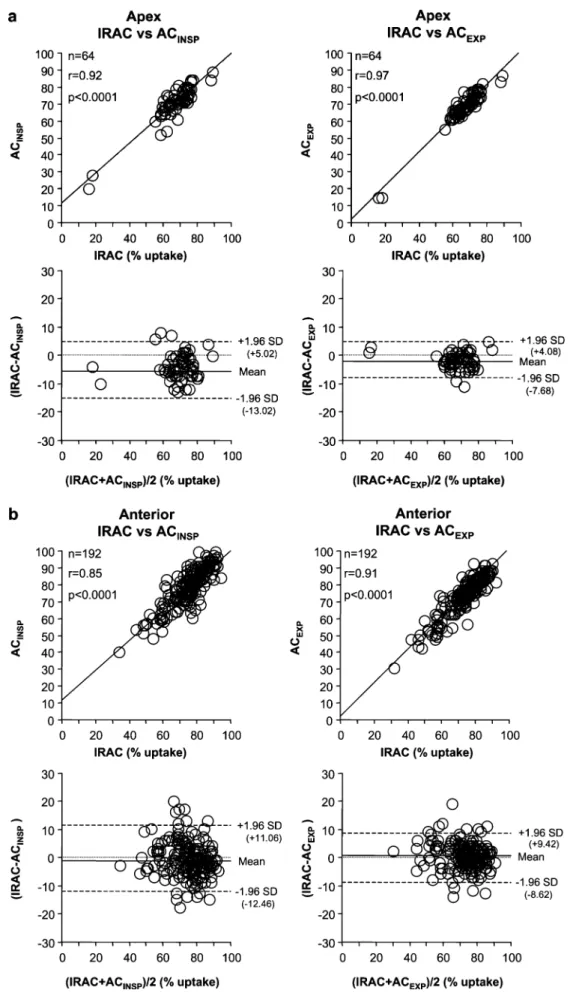
Fig. 2. Linear regression analy-sis and Bland-Altman plots for percent radiotracer uptake be-tween IRAC and ACINSPand between IRAC and ACEXPin the apical (a), anterior (b), septal (c), lateral (d) and inferior (e) myocardial regions
SDS was slightly inferior (r=0.79, p<0.0001 and r=0.81;
p<0.0001, respectively). All perfusion abnormalities were
supported by the corresponding findings on the CT
angiogram (Table
2
).
Quantitative regional uptake values
There was an excellent correlation between regional uptake
values obtained by IRAC compared with AC
INSP(apex,
r=0.92; anterior, r=0.85; septal, r=0.91; lateral, r=0.86;
inferior, r=0.90; all p<0.0001), with narrow limits of
agreement (Fig.
2
) and only a minimal (non-significant)
overestimation of apical uptake values by AC
INSP.
Corre-lation between IRAC and AC
EXPwas even higher (apex,
r=0.97; anterior, r=0.91; septal, r=0.94; lateral, r=0.92;
inferior, r=0.97; all p<0.0001) and limits of agreement
closer compared with AC
INSP(Fig.
2
).
Intra- and inter-observer reproducibility
The high correlation between repeat measurements of
regional uptake values obtained by AC
INSP(apex, r=0.95;
anterior, r=0.80; septal, r=0.97; lateral, r=0.86; inferior,
r=0.97; all p<0.0001) and AC
EXP(apex, r=0.96; anterior,
r=0.87; septal, r=0.94; lateral, r=0.80; inferior, r=0.98; all
p<0.0001) documented an excellent intra-observer
repro-ducibility. Similarly, a high inter-observer agreement was
obtained by AC
INSP(apex, r=0.80; anterior, r=0.80; septal,
r=0.91; lateral, r=0.82; inferior, r=0.97; all p<0.0001) and
AC
EXP(apex, r=0.82; anterior, r=0.88; septal, r=0.90;
lateral, r=0.78; inferior, r=0.95; all p<0.0001).
Coronary calcium score
CCS data obtained during expiration from two patients
were not amenable to interpretation owing to respiratory
motion due to failure to follow the breath-hold commands.
For the remaining 30 patients, no statistically significant
difference was found for the mean Agatston score using CT
data during inspiration (319±737; range, 0-2,555) and
expiration (317±778; range, 0-2,940) (mean difference,
−12±93; p=NS).
Discussion
This study demonstrates for the first time that the use of CT
data from CCS obtained with 64-slice CT allows accurate
AC of myocardial SPECT MPI images. The
attenuation-corrected SPECT images obtained using multislice CT data
from CCS (either AC
INSPor AC
EXP) resulted in identical
clinical findings and conclusions compared with IRAC.
This was underlined by the excellent correlation of the
quantitative parameters between CCS data and IRAC.
Furthermore, all perfusion defects were supported by the
corresponding findings on the CT angiogram, confirming
that no artefacts were introduced in our study population by
either AC technique.
Comparison of regional perfusion uptake values with
IRAC revealed a slightly superior agreement of AC
EXPover AC
INSP, which was mainly evident for the apex, as this
region is most prone to respiratory motion artefacts and
partial volume effects [
20
]. This might be, at least in part,
due to the fact that during acquisition of the low-dose CT,
the upper abdominal organs as well as the heart and the
lower mediastinum are scanned predominantly in a
posi-tion that is close to that of expiraposi-tion, as expiraposi-tion
constitutes the longest phase of the respiratory cycle [
21
].
As a consequence, this may produce inaccurate attenuation
coefficients during maximum inspiration. Our results are in
line with a recent study by Utsunomiya et al. [
12
], who
found that the accuracy of AC was higher with use of a
free-breathing and post-exhalation breath-hold protocol
during CT scanning than with the inspiration breath-hold
protocol. Similarly, Goerres et al. [
11
] reported that the
normal postexhalation breath-hold protocol for CT
acqui-sition proved superior compared with deep inspiration for
PET-CT image registration. Nevertheless, differences
between AC
INSPand AC
EXPwere minimal in our study, as
accurate correction for misalignment was performed for
each individual scan and AC method.
Our results may have implications for future cardiac
SPECT-CT protocols for several reasons. First, the
inte-gration of high-performance multislice CT into hybrid
SPECT-CT devices will allow combined assessment of
MPI and coronary anatomy or CCS. The latter—acquired
within seconds as opposed to the minutes needed for the
attenuation maps by low-resolution X-ray CT
—improves
the efficiency of the scan protocol and increases patient
throughput. Second, our results suggest that the CCS
should be acquired during expiration instead of inspiration,
in order to enable its use as an attenuation correction map
for MPI SPECT. In fact, AC
EXPproved superior to AC
INSPwithout affecting the accuracy of the Agatston score.
We acknowledge the following limitations of our study.
First, we did not perform scatter correction although AC
may amplify the scatter spillover into nearby myocardium,
typically the inferior septal wall, from splanchnic activity
[
17
]. However, visual and quantitative analysis revealed
excellent agreement of the different AC methods and all
findings were supported by the CT angiogram. Second,
while AC
EXPwas found to be slightly superior to AC
INSPwith regard to quantitative comparison with IRAC, AC
EXPwas technically not successful in two of the 32 study
participants as these two did not properly follow the
breath-hold command at expiration, while there was no problem
with inspiration. Owing to the very low number of
unsuccessful scans, it is not entirely clear whether
breath-hold commands at expiration for AC are more demanding
while breath-hold commands at inspiration are generally
followed very well. Third, regional quantitative uptake
values were only analysed for stress scans as we expected
the low-dose scan to be more susceptible to artefacts
induced by different AC protocols. The fact that we found
no differences between the various AC methods, although
we confined this analysis to the low-dose scans,
strength-ens the finding of equivalence between AC from CCS
compared with IRAC.
Conclusion
Attenuation maps from CCS allow accurate AC of SPECT
MPI images. AC
EXPproved superior to AC
INSP, suggesting
that in hybrid scans CCS may be performed during normal
expiration to allow its additional use for AC of cardiac
SPECT MPI images.
Acknowledgements. Philipp A. Kaufmann was supported by a grant from the Swiss National Science Foundation (SNSF professorship grant No. PP00A-68835 and grant No. 31-68386). Hatem Alkadhi and Lotus Desbiolles were supported by the National Center of Competence in Research, Computer Aided and Image Guided Medical Interventions (NCCR CO-ME) of the Swiss National Science Foundation.
We are grateful to our head radiographer, Gabi Hasler, for her excellent technical assistance.
References
1. Fleischmann S, Koepfli P, Namdar M, Wyss CA, Jenni R, Kaufmann PA. Gated 99mTc-tetrofosmin SPECT for discrimi-nating infarct from artifact in fixed myocardial perfusion defects. J Nucl Med 2004;45:754–9
2. Hendel RC, Corbett JR, Cullom SJ, DePuey EG, Garcia EV, Bateman TM. The value and practice of attenuation correction for myocardial perfusion SPECT imaging: a joint position statement from the American Society of Nuclear Cardiology and the Society of Nuclear Medicine. J Nucl Cardiol 2002;9:135–43
3. Bailey DL, Hutton BF, Walker PJ. Improved SPECT using simultaneous emission and transmission tomography. J Nucl Med 1987;28:844–51
4. Berman DS, Kiat H, Friedman JD, Wang FP, van Train K, Matzer L, et al. Separate acquisition rest thallium-201/stress technetium-99 m sestamibi dual-isotope myocardial perfusion single-photon emission computed tomography: a clinical validation study. J Am Coll Cardiol 1993;22:1455–64 5. Ficaro EP, Fessler JA, Shreve PD, Kritzman JN, Rose PA,
Corbett JR. Simultaneous transmission/emission myocardial perfusion tomography. Diagnostic accuracy of attenuation-corrected 99mTc-sestamibi single-photon emission computed tomography. Circulation 1996;93:463–73
6. Bocher M, Balan A, Krausz Y, Shrem Y, Lonn A, Wilk M, et al. Gamma camera-mounted anatomical X-ray tomography: tech-nology, system characteristics and first images. Eur J Nucl Med 2000;27:619–27
7. Masood Y, Liu YH, Depuey G, Taillefer R, Araujo LI, Allen S, et al. Clinical validation of SPECT attenuation correction using x-ray computed tomography-derived attenuation maps: multi-center clinical trial with angiographic correlation. J Nucl Cardiol 2005;12:676–86
8. Fricke H, Fricke E, Weise R, Kammeier A, Lindner O, Burchert WA. A method to remove artifacts in attenuation-corrected myocardial perfusion SPECT introduced by misalignment between emission scan and CT-derived attenuation maps. J Nucl Med 2004;45:1619–25
9. Namdar M, Hany TF, Koepfli P, Siegrist PT, Burger C, Wyss CA, et al. Integrated PET/CT for the assessment of coronary artery disease: a feasibility study. J Nucl Med 2005;46:930–5 10. O’Connor MK, Kemp B, Anstett F, Christian P, Ficaro EP, Frey
E, et al. A multicenter evaluation of commercial attenuation compensation techniques in cardiac SPECT using phantom models. J Nucl Cardiol 2002;9:361–76
11. Goerres GW, Burger C, Kamel E, Seifert B, Kaim AH, Buck A, et al.Respiration-induced attenuation artifact at PET/CT: tech-nical considerations. Radiology 2003;226:906–10
12. Utsunomiya D, Nakaura T, Honda T, Shiraishi S, Tomiguchi S, Kawanaka K, et al. Object-specific attenuation correction at SPECT/CT in thorax: optimization of respiratory protocol for image registration. Radiology 2005;237:662–9
13. Germano G, Kiat H, Kavanagh PB, Moriel M, Mazzanti M, Su HT, et al. Automatic quantification of ejection fraction from gated myocardial perfusion SPECT. J Nucl Med 1995;36: 2138–47
14. Cerqueira MD, Weissman NJ, Dilsizian V, Jacobs AK, Kaul S, Laskey WK, et al. Standardized myocardial segmentation and nomenclature for tomographic imaging of the heart: a statement for healthcare professionals from the Cardiac Imaging Com-mittee of the Council on Clinical Cardiology of the American Heart Association. Circulation 2002;105:539–42
15. Sharir T, Germano G, Waechter PB, Kavanagh PB, Areeda JS, Gerlach J, et al. A new algorithm for the quantitation of myocardial perfusion SPECT. II: Validation and diagnostic yield. J Nucl Med 2000;41:720–7
16. Germano G, Kavanagh PB, Waechter P, Areeda J, Van Kriekinge S, Sharir T, et al. A new algorithm for the quan-titation of myocardial perfusion SPECT. I: Technical principles and reproducibility. J Nucl Med 2000;41:712–9
17. Ficaro EP, Fessler JA, Ackermann RJ, Rogers WL, Corbett JR, Schwaiger M. Simultaneous transmission-emission thallium-201 cardiac SPECT: effect of attenuation correction on myocardial tracer distribution. J Nucl Med 1995;36:921–31 18. Agatston AS, Janowitz WR, Hildner FJ, Zusmer NR, Viamonte
M Jr, Detrano R. Quantification of coronary artery calcium using ultrafast computed tomography. J Am Coll Cardiol 1990;15:827–32
19. Bland JM, Altman DG. Statistical methods for assessing agreement between two methods of clinical measurement. Lancet 1986;1:307–10
20. Fricke E, Fricke H, Weise R, Kammeier A, Hagedorn R, Lotz N, et al. Attenuation correction of myocardial SPECT perfusion images with low-dose CT: evaluation of the method by comparison with perfusion PET. J Nucl Med 2005;46:736–44. 21. Wade OL. Movements of the thoracic cage and diaphragm in