Potential environmental fate of elsinochrome A, a
perylenequinone toxin produced in culture by bindweed
biocontrol fungus Stagonospora convolvuli LA39
M.O. Ahonsi • D. Boss • M. Maurhofer • G. Defago
Springer Science + Business Media, LLC 2006
Abstract The photosensitizing perylenequinone toxin
elsinochrome A (EA) is produced in culture by the bindweed biocontrol fungus Stagonospora convolvuli LA39 where it apparently plays a pathogenicity re-lated role. We investigated the fate of EA with ref-erence to its stability under different temperature and light conditions. EA remained stable when boiled in water at 100°C for 2 h. Similarly, exposing EA to 3-27°C in the dark for up to 16 weeks did not affect its stability either in dry or in aqueous form. However, results from irradiation experiments indicate that direct photolysis may be a significant degradation pathway for EA in the environment. EA either in dry form or dis-solved in water was degraded by different irradiation wavelengths and intensities, with degradation plots fit-ting a first order rate kinetics. EA degraded faster if ex-posed in aqueous form, and at higher quantum flux den-sity (jsmol s F m-2). Sunlight was more effective in
de-grading EA than artificial white light and ultraviolet ra-diations (UV-A or UV-B). Exposing EA to natural sun-light, particularly, during the intense sunshine (1,420-1,640 ismol s 2) days of 30 July to 5 August 2004
M.O. Ahonsi • D. Boss • M. Maurhofer • G. Ddfago Phytopathology Group, Institute of Plant Sciences, Swiss Federal Institute of Technology, CH-8092, Zurich, Switzerland
M.O. Ahonsi (®)
Present address: River Basin Research Center, Gifu University, 1-1 Yanagido, Gifu 501-1193, Japan e-mail: mo-ahonsi@yahoo.com
in Zurich caused the substance to degrade rapidly with half-life under such condition only 14 h. This implies that should EA gets into the environment, particularly on exposed environmental niches, such as on plant surfaces through biocontrol product spray, or released from shed diseased leaves, it may have no chance of ac-cumulating to `level of concern'. Furthermore, a toxic-ity assay using Trichoderma atroviride P1 as biosensor showed that photo-degraded EA was not toxic, indicat-ing that no stable toxic by-products were left.
Keywords Biological control agents (BCAs) Convolvulus • Environmental contamination and toxicity . Fungal metabolites • High performance liquid chromatography (HPLC) • Photo-degradation Photolysis • Photo-sensitizers • Risk assessment Stability
1. Introduction
Man has increasingly become conscious of effects of chemicals in his environment, particularly, since the publication of Rachel Carson's `Silent Spring' (Carson, 1962). The growing public sensitivity to environmental pollution by chemical pesticides is compounded by the problem of pest resistance to these chemicals. This has led to increased interest in the search for environmen-tally benign crop protection strategies such as the use of microbial Biological Control Agents (BCAs) as alter-natives to synthetic chemical pesticides in agriculture. Springer
However, this `deliberate introduction' of microbes into the environment as plant protection agents has also suffered from the increasing public awareness of the risk of pesticides in the food-chains. This is particularly due to the fact that some microbes have been proven to produce chemicals (as secondary metabolites) that are highly toxic to man and his livestock (Bove, 1970; Shotwell et al., 1969, 1971; Joffe, 1986; Chu and Li, 1994; Lubulwa and Davis, 1994; Abramson,
1998).
The ever-increasing public awareness and sensitiv-ity has continued to put pressure on both the academic and industrial plant protection scientists to become more `environmentally responsible' as they work
to-wards providing solutions to pest and disease
prob-lems in agriculture. This has indeed given birth to a recently emerged and expanding field of plant protec-tion science called `Risk Assessment'. Determinaprotec-tion of the environmental fate of pesticides or of major toxic metabolites of fungal BCAs has become an es-tablished step in the development and commercializa-tion of plant proteccommercializa-tion products, particularly, in Eu-rope. While progress made in recent years in the de-velopment and commercialization of fungal BCAs is in accordance with the European Commission (EC) common agricultural policy and the global consensus to reduce synthetic chemicals in the environment, one of the major limitations to the registration and sub-sequent commercialization of fungal BCAs has been the requirement of risk assessment of their secreted
metabolites (Strasser et al., 2000). This article reports on the potential environmental fate of elsinochrome A (EA), a major toxic metabolite produce in culture by the field and hedge bindweeds biocontrol fungus, Stagonospora convolvuli LA39 (Nicolet and Tabacchi, 1999; Ahonsi et al., 2005). Even though, in planta pro-duction of this metabolite by the fungal BCA has not been detected, the ability to produce the substance in certain artificial growth media seems to be an innate characteristic of isolates of Stagonospora which are aggressive on field and hedge bindweeds (Ahonsi et al., 2005). EA is a photosensitizing perylenequinone toxin typically produced by Elsinoe (and its anamorph Sphaceloma) spp. (Chen et al., 1966; Weise et al., 1987; Meille et al., 1989). Among photosensitizing perylenequinones, cercosporin which is closely related to EA (Table 1) (Weise et al., 1987; Meille et al., 1989) and is a pathogenicity determinant in Cercospora spp. (Daub and Ehrenshaft, 2000) is the most stud-ied. These substances absorb light energy and become energetically activated, reacting with molecular oxy-gen to form both radical and non-radical species of activated oxygen, which have near-universal toxicity (Daub and Ehrenshaft, 1993; 2000). Cercosporin has been shown to generate both singlet oxygen (002) and
superoxide (02-) in vitro when illuminated, but the
for-mer is primarily responsible for its high toxicity (Daub and Hangarter, 1983). Cercosporin is known to be al-most universally toxic to living cells, with toxic ef-fects well documented against mice, many bacteria and
Table 1 Chemical properties of elsinochrome A and the closely related perylenequinone photosensitiz-ing fungal toxin cercosporin
Chemical Molecular
Fungal toxin Chemical structure formula weight UV-Spectrum Elsinochrome A off 0 C3oH24010 544 MU
M, 200 ^ I I 150 M:O Mao ^ I O OMe e
OH 0 qep ^5e 3pp a5o pp Sa 50o s5o r.n
Cercosporin OH 0 C29H2601() 534
OMeH
Oh mo
Sao
OMe H50
OH 0 20o xso aoo a5o goo r soo 560
800 700 600 E 500 AM 400 t Y
m
300 0 200 Elsinoehrome A X nm Absolute maximum 217 Side maxima 268 459 528 568 338 1200 1000 800 6000
400 200 fungi, plants, and human cells at micromolarconcentra-tions (Balls and Payne, 1971; Daub, 1982; Tamaoki and Nakano, 1990; Ballio, 1991; Batchavora et al., 1992; Daub and Ehrenshaft, 1993; 2000). Toxicity of EA is less documented. However, elsinochromes (such as B 1, B2, Cl and C2) have been shown to have photodynamic inhibitory effects on proteinkinase C (Arnone et al., 1993). The closeness in structure of EA to cercosporin (Table 1) suggests a possible similarity in function and mode of action. Indeed, the phototoxic effect of EA on human cells was recently reported (Ma et al., 2003). These authors found EA concentrations as low as I µM and 10 ttM.to induce up to 41% and 53% apop-tosis on the human cell line Hce-8693 after 20 min irradiation.
The study described in this article aimed to deter-mine the potential importance of irradiation and tem-perature on the degradation of EA, and to determine if degraded EA is potentially toxic compared with the non-degraded substance.
2. Materials and methods
2.1. Test substance and organic solvents
EA (Table 1) used in this study was of >98% pu-rity grade and was purchased in small screw-capped vials from Specs BV (Delft, The Netherlands) in granular form. Once it was received from the com-pany, it was stored in the dark at —20°C in a
frost-free refrigerator. Organic solvents used included ace-tonitrile (CH3CN) [HPLC gradient grade >99.9% (GC); Fluka Chemie AG, Buchs, Switzerland]; tetrahy-drofuran ((C2H4)20) [HPLC purity grade 99.9+%; Sigma-Aldrich, D-8955 Steinheim Germany]; and ethyl acetate (CH3COOC2H5) [Erne AG, Dallikon, Switzerland].
2.2. High performance liquid chromatography (HPLC) analysis
For all experiments, analysis of EA samples by HPLC was done in a Hewlett Packard 1090 liquid chromato-graph equipped with a diode-array detector. A reverse phase column, CC 250 x 4 mm Nucleosil 120-5 C18 (Macherey-Nagel, Germany) was used, and the temper-ature of the column was 28°C. Injection volume was 25 Al, and the samples were eluted with 80% acetonitrile, 20% ddH2O (acidified with 0.045% H3PO4) for 10 min at a flow rate of I ml min—t. Detection of EA was
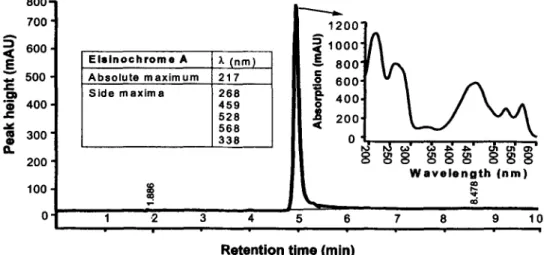
ini-tially viewed at 217, 230, 242, and 254 nm at 4.9-5.1 min after injection (retention time), but quantification was done at 230 nm (Fig. 1).
2.3. Effect of temperature on the stability of EA Three separate experiments were conducted to evaluate the effect of temperature on the stability of EA, and each of these experiments was replicated three times and repeated once, giving two runs (experimental runs) per experiment.
100
1
Wavelength {nm)
m
10Retention time (min)
Fig. 1 High performance liquid chromatography peak and UV absorption spectrum of elsinochrome A. A reverse phase nucleosil -Cl 8 column was used. 14.7 nmol of pure elsinochrome A was analysed, and detection at 230 nm is presented
2.3.1. Effect of high temperature on the stability of EA
The first temperature experiment was conducted to de-termine the stability of EA at high temperatures of 40°C to 100°C (in boiling water) on short time exposure in the laboratory. From a 183.8 pM stock solution of EA made in acetonitrile containing 1.8% tetrahydrofuran (THF), 50 s1 each were distributed in 1.1 ml conical bottom glass vials (Infochroma AG, Zug, Switzerland). The solvent was evaporated under argon gas stream, leaving the dried EA in the vials before closing the vials with crimp caps. The treatments in the first ex-perimental run were vials kept for 30 min or I h in a water-bath adjusted to 40, 60, and 80°C, and in boil-ing water maintained at 100°C (by addition of NaCI). In the second experimental run, durations of exposure were increased from 30 min and 1 h to 1 h and 2 h respectively. After the heat treatment, the dry EA in the vial was re-dissolved in 100 sl of acetonitrile/THF (4:1) for analysis by HPLC. Controls were EA samples in vials dried under argon gas stream, but without any heat treatment.
2.3.2. Effect of temperature on stability of EA in dry form
The second temperature experiment was conducted to determine the stability of EA in dry form in the dark at 3 to 27°C. Glass vials containing dried EA prepared as described previously in Section 2.3.1, were kept in the dark at 3, 8, 15, 20 and 27°C. After 1 day, 3 days, 1 week, 2 weeks, 4 weeks, 8 weeks, 12 weeks and 16 weeks, three vials (replicates) each were taken from the various temperatures and the EA was dissolved in 100 /A of acetonitrile/THF (4:1) for HPLC analysis. The control samples were similarly prepared as those kept at various temperatures, but were analysed by HPLC immediately (day 0).
2.3.3. Effect of temperature on the stability of EA
dissolved in water
The third temperature experiment was conducted to test the effect of temperature on stability of EA dissolved in water and kept in the dark at 3°C-27°C. Since pure EA is not readily soluble in water, aqueous solution of the substance was made by initially dissolving 4 mg of the pure substance in 400 µl THF, then gradually in water
through series of mixing and centrifugation to a final 20 ml aqueous solution (pH 6.5) containing 2% THF. 100 sl of EA solution was distributed into sterile 0.6 ml clear microtubes (MCT-060-C, Genuine AXYGEN Quality, Axygen Scientific, Inc. 33170 Central Ave. Union City, CA 94587, USA), and kept in the dark at 3, 8, 15,20 and 27°C for I day, 3 days, 1 wk, 2 wks, 4 wks, 8 wks, and 10 wks before HPLC analysis. The control tubes were analyzed by HPLC immediately. For HPLC analysis, 20 p1 of THF and 80 µl of acetonitrile were added to the EA solution in microtube directly, mixed by pipetting and vortexing, followed by centrifugation at high speed for 3 min. The supernatant was transferred into HPLC glass vials for analysis.
2.4. Effect of white light on stability of EA
Two separate experiments were conduct to test the ef-fect of white light on the stability of EA in dry and in aqueous forms respectively, and each of the two exper-iments were replicated three times and repeated once.
2.4.1. Effect of white light on stability of EA in dry form
This experiment was conducted to determine the sta-bility of EA exposed to continuous white light. The two white light sources tested were, cool white light (TL 20WI55, DE LUXE, Philips, France) at 20°C and incandescent white light (TL D 18W/82, Philips, Hol-land) at 27°C. Using a photometer model LI-185B (LI-COR Inc. USA), for each of these two light treat-ments, the illuminance (on the samples) was measured in lux. Quantum Flux Density (QFD) (the number of photons in the 400-700 nm waveband incident per unit time on a unit surface) (in Amol 5 on
the EA samples was estimated using the relationship: 1000 Lux = 1 Klux = 19.5 .tmol s-1 m-2 (Bigs,
1985). The estimated QFD values were 35.1 µmol s-1 m-2 and 54.6 µmol s-1 m-2 at 20 and 27°C,
re-spectively. Glass vials containing dried EA were pre-pared as described in Section 2.3.1. At I day, 3 days, 1 week, 2 weeks, 4 weeks, 8 weeks, 12 weeks and 16 weeks, three vials (replicates) each were taken from the various temperatures and dissolved in 100 µl of acetonitrile/THF (4:1) for HPLC analysis. There were two sets of control, samples of which were prepared the same way as those exposed to white light at 20 and 27°C. One control consisted of vials kept at the
same temperatures (20 and 27°C) in dark which were analysed at I day, 3 days, 1 week, 2 weeks, 4 weeks, 8 weeks, 12 weeks and 16 weeks as those of the light treatments. The second control consisted of vials which were analysed by HPLC immediately (at day 0).
2.4.2. Effect of white light on the stability of EA dissolved in water
Preparation of microtubes of EA solution for expo-sure to light and for HPLC analysis after expoexpo-sure time, were the same as described previously in Sec-tion 2.3.3. The microtubes containing EA soluSec-tion were kept in continuous white light at 20 and 27°C for 1 day, 3 days, 1 wk, 2 wks, 4 wks, 8 wks, and 10 wks before HPLC analysis. The two white light sources tested were, warm white light (TL 20W/29, Philips, Holland) at 20°C and incandescent white light (TL D 18W/82, Philips, Holland) at 27°C, both with the same illuminance as measured by photometer. Using the same procedure described before in Section 2.4.1, the QFD of both light treatments at 20 and 27°C was 54.6 µmol s There were two sets of control, samples of which were prepared the same way as those exposed to white light at 20 and 27°C. One control consisted of microtubes kept at the same temperatures (20 and 27°C) in dark for 1 day, 3 days, 1 wk, 2 wks, 4 wks, 8 wks, and 10 wks before HPLC analysis. The second control consisted of microtubes of EA solution analysed by HPLC immediately (at day 0).
2.5. Effect of natural sunlight on the stability of EA dissolved in water
Microtubes of EA solution prepared as described pre-viously in Section 2.3.3 were placed either directly (sunlight-illuminated) or rapped in aluminium foil (non-illuminate or in the dark) in the open (daylight and night darkness) on the terrace of LFW building, ETH-Zentrum. Zurich. The illuminance (in lux) of sunlight on the microtubes was measured with a photometer at mid-day daily during the experiment. From these data, the QFD values in smol s-1 m-2 were estimated
as described previously in Section 2.4.1. In the first experimental run (30 July-5 August, 2004), the micro-tubes were kept for 1-5 days and three micro-tubes (replicates) were taken per treatment daily and prepared for HPLC analysis as described previously in Section 2.3.3. In
the second experimental run (24 August-1 September, 2004), the microtubes were kept up to 10 days in the open.
2.6. Effect of ultraviolet lights (UV-A and UV-B) on the stability of EA
From a 919 1sM stock solution of EA made in ace-tonitrile/THF (4:1), samples of 50 µl were placed onto glass slides with dents (diameter: 1.5 cm, depth 1 mm). After the solvent had dried completely, the slides were exposed to UV-A light (315-400 nm) at 20°C or UV-B light (280-315 nm) at 24°C. Controls were kept in the dark at the same temperatures. After 1, 3, 7, 14, 21, 28 and 56 days, samples were taken, the EA in the glass slide dent was dissolved in 250 sl ethyl-acetate, the solution transferred to eppendorf tubes and the solvent completely evaporated under argon gas stream. The dry probes were dissolved in 200 µl acetonitrile/THF (4:1), transferred to HPLC vials for immediate HPLC analysis.
2.7. Bioassay of photo-degraded EA for toxicity Toxicity of photo-degraded (sunlight illuminated) EA was performed using a highly EA-sensitive biocontrol fungus Trichoderma atroviride strain P1 described in another study conducted in our laboratory (unpublished data) as biosensor. Four-day old freshly grown fungus on malt agar was used. EA solution used for this bioassay was prepared as described previously in 2.3.3, but contained 7% acetonitrile instead of 2% THE as initial dissolving solvent. Three 1.5 ml clear eppendorf tubes each containing 600 µl EA solution were placed either directly (sunlight-illuminated) or rapped in aluminium foil (non-illuminate) in the open (daylight and night darkness) on the terrace of LFW building, ETH-Zentrum, Zurich for 10 days (until the red EA solutions exposed to sunlight were completely bleached to clear solutions). After the exposure period, EA solutions in the three 1.5 ml tubes were pooled in a 14 ml eppendorf tube. Four treatment samples were made by dilution as undiluted, 2x diluted, 4x diluted and 8x diluted from the illumi-nated EA, non-illumiillumi-nated EA and the 7% acetonitrile solution included as control. Small Petri dishes (6 cm diameter) were poured with 3 ml of malt agar contain-ing 5% (150 µl/plate) of the appropriate EA treatment
sample solution. The controls were plates poured with 3 ml malt agar containing 5% of the corresponding dilution of 7% acetonitrile solution. The amount of EA contained per Petri dish was estimated by HPLC anal-ysis of three replicate samples each of the undiluted illuminated and non-illuminated EA solutions. The bioassay agar plates were inoculated with the fungus, by placing a 5 mm agar plug of the fresh 4 days grown culture at the centre of the 6 cm diameter agar plate. There were three replicates for each treatment sample, with each replication made from a different fungal culture plate but the same plate for all the treatments. The plates were incubated at 20°C in continuous white light (35 µmot s-1 m-2). After two days and three days
of incubation, fungal mycelia growth in diameter was measured.
2.8. Statistical analysis
For all HPLC analysis data, percentage relative peak areas (relative to average peak area for the respec-tive control) were used in comparing treatment effects on amount of EA detected by HPLC. All data were analysed in SAS (Statistical Analysis Software ver-sion 8, SAS Institute Inc., Cary, NC, USA. For the repeated experiments, data were combined in the anal-ysis if initial analyses showed the same pattern of varia-tion and no significant difference between experimental runs, otherwise, they were analyzed separately. Treat-ments means with their standard deviations were ob-tained by Mean Procedure in SAS and used to construct scatter grams fitted with regression lines and tions in Microsoft Excel. From the regression equa-tions, half-lives were calculated, taken y-intercept as 50%. Data from the effect of high temperature exper-iments were analyzed by MIXED PROCEDURE in SAS, taken replication and experimental run as ran-dom variables. Similarly, toxicity data (mycelia growth in cm) were subjected to analysis of variance using the MIXED PROCEDURE in SAS, taken replication as a random effect variable and treatment as fixed ef-fect. Single-degree-of-freedom contrasts were made to test the differences between treatments and their ap-propriate solvent controls. Percentages of the contrast estimates were then calculated as percentage mycelial growth inhibitions resulting from the respective treatments.
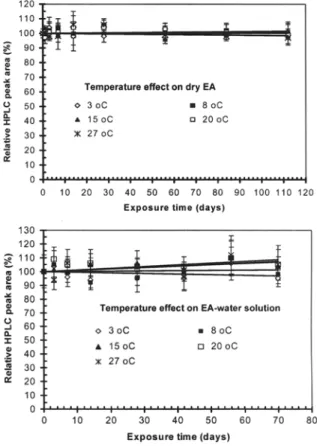
Fig. 2 Effect of temperature on the stability of elsinochrome A (EA) in dry form or dissolved in water
3. Results
3.1. Effect of temperature on stability of EA
Exposure of dry EA to temperature as high as 100°C (by boiling) for up to 2 It did not result in any signifi-cant reduction in the amount of EA detected by HPLC compared with the substance to which no treatment was applied. Similarly, the amount of EA detected as HPLC peak area did not change significantly when exposed to temperatures of 3-27°C in the dark either in the dry form for up to 112 days or in aqueous solution for up to 70 days (Fig. 2).
3.2. Effect of white light on the stability of EA When dry EA was exposed to continuous white light of 35 µmol s-1 m-2 at 20°C and 55 µmol s-1 m-2 at
27°C, amount of the substance detectable by HPLC gradually declined with an estimated half-life of 165 days and 130 days, respectively (Fig. 3). When aque-ous solution of EA was exposed to continuaque-ous white t Springer
Fig. 3 Effect of white light on the stability of elsinochrome A (EA) in dry form or dissolved in water
light of 55 Amol s at 20 and 27°C, a more rapid degradation with an estimated half-life of 32 days and 34 days respectively, was observed (Fig. 3). In con-trary, EA samples kept in the dark either in dry form or in solution at the same temperatures of 20 and 27°C remained unchanged (Fig. 3).
3.3. Effect of natural sunlight on the stability of EA
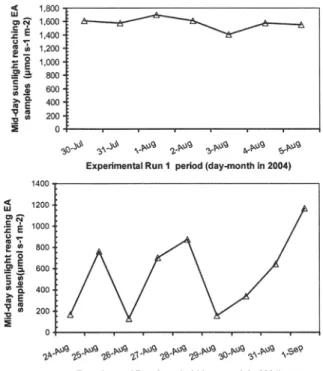
On exposure to the intense sunshine (1,420-1,640 rmol s-t m"2) days of 30 July to 5 August, 2004
(Fig. 4), EA was rapidly bleached (changed from red so-lution to colourless soso-lution) and degraded with a short half-life of only 14 h (Fig. 5). However, EA samples kept under the same weather conditions but sheathed from sunlight by rapping in aluminium foil remained unchanged (Fig. 5). In the second experimental run con-ducted during the less intense sunshine days of 25 Au-gust to 1 September, 2004 (Fig. 4), the half-life of EA exposed to sunlight was 99 h, while the control
sam-Fig. 4 Intensity of mid-day sunlight reaching elsinochrome A (EA) samples during first experimental period (30 July-5 Au-gust) and second experimental period (24 August-12 September) of investigation on effect of sunlight on EA stability
ples sheathed from sunlight also remained unchanged (Fig. 5).
3.4. Effect of UV-A and UV-B on the stability of EA
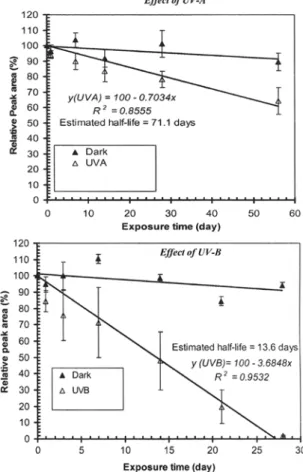
On exposure to UV-A and UV-B, the amount of EA de-creased with half-lives of 78 days and 12 days respec-tively compared with samples that were not exposed (Fig. 6). In contrary, amount of EA samples kept under the same temperatures but sheathed from UV-A and UV-B remained unchanged throughout the 56 days of the experiment (Fig. 6).
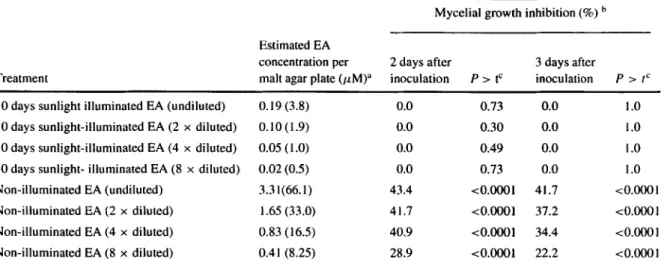
3.5. Bioassay of photo-degraded EA for toxicity HPLC analysis of the EA samples after exposure to sunlight for 10 days or sheathed from sunlight for the same length of time, showed that there was an estimated amount of 3.8 AM EA in the sam-ples exposed to sunlight compared with an estimated amount of 66.1 AM EA in control samples sheathed from sunlight (Table 2). The mycelial growth of the
Fig. 5 Effect of natural sunlight (daylight) on the stability of elsinochrome A (EA) dissolved in water in an experiment con-ducted at two different periods in the summer of 2004 in Zurich
fungus Trichoderma atroviride P1 was significantly (p < 0.0001) inhibited even by the 8x diluted non-illuminated EA compared with the respective 7%
sol-vent dilutions used as controls (Table 2). In contrary, mycelial growth of T atroviride PI was the same on agar plates incorporated with even the undiluted EA solution that was exposed to and degraded by sunlight as in the control plates without EA (Table 2).
4. Discussion
There has not been any previous report on the sta-bility or fate of EA, or on the effect of environmen-tal physical factors on the stability of any microbial perylenequinone toxin. However, the ability of bacte-ria to biodegrade cercosporin has been proven (Mitchell et al., 2002). In absence of light, EA either in dry form or as solution in water may remain stable even at maximal air or soil temperatures that could
nor-Fig.6 Effect of UV-A and UV-B on the stability of elsinochrome A in dry form
mally be found in temperate regions, particularly. Sim-ilarly, the resistance of many other fungal toxins par-ticularly, the more studied 'mycotoxins' (specifically used for toxic chemicals produced by food poison-ing fungi in the field or in storage) to high tempera-tures has been well reported (Chu et al., 1975;
Ben-nett and Richard, 1996; Lowes et al., 2000;
Yumbe-Guevara et al., 2003). In fact, as a general rule, my-cotoxins are stable during food preparation and are not destroyed by cooking or baking. For instance, Yumbe-Guevara et al. (2003) found that thermal treat-ment of barley and wheat naturally contaminated by the
Fusarium mycotoxin deoxynivalenol (DON) in electric convention oven, and gas-fired roaster showed no sig-nificant effects at temperatures below 160°C after 60
min of processing. Tschen et al. (1997) also reported
that helvolic acid, an antibiotic fungal metabolite iso-lated from the pathogen Sarocladium oryzae (causal of rice sheath rot) was stable at temperatures of 22-100°C. However, dramatic effect of temperature on
the degradation of some chemicals in the environment has also been reported (Vink and Vanderzee, 1995; Sanz-Asensio et al., 1997; Anthanasopoulos et al., 2004). For instance, Anthanasopoulos et al. (2004) re-ported that the half-lives of parathion methyl at relative humidity of 60 to 96% were 48 to 57 days at 0°C, 9.2 to 10.5 days at 20°C and 1.3 to 1.5 days at 40°C.
In contrary, the results shown in Figs. 3, 5 and 6 implicate light as a physical factor that could rapidly degrade EA in the environment. The plots of EA con-centration and light exposure time relationships fit a first order rate equation of the type Y = a - bX (where Y = concentration of EA residue after exposure, a =concentration of EA at zero exposure time, b = degra-dation rate constant, and X = time in day of exposure to light). The correlation coefficient squared (R2) for
degradation of EA in dilute aqueous solution particu-larly, on exposure to white light, UV-B, and sunlight ranged from 0.944 - 1.0 indicating a good fit and im-plying that EA degradation under light corresponds to a first order rate kinetics. Though our test system does not exactly reflect the natural situation of EA excreted in membranes of leaves (lipid environment), our re-sults clearly show that photo-degradation of EA may be faster when the substance is in aqueous solution than when it is in dry form. Potentially, this is a good indi-cation, since the toxin would normally be found in the environment in wet condition, not in dry state.
Comparing the results obtained from experiments conducted to show the effect of light, UV-A and UV B and of natural sunlight on EA stability (Figs. 3,5 and 6), it is clear that natural sunlight was more effective in degrading EA than artificial white light and either of the UV radiations. It is possible that EA photolysis occurs at more than one wavelength range. Solar radi-ation reaching the earth's surface having a wider wave-length range (290 - > 800 nm) spanning through the wavelengths of UV-B, UV-A and visible light up to the infrared region (Zepp and Cline, 1977; Zepp et al., 1985; Jensen-Korte et al., 1987; Niu et al., 2004; Katagi, 2004) may provide better chance for EA pho-tolysis. In this study, we did not diagnose what wave-length component of the solar radiation was most im-portant or responsible for the rapid photo-degradation of EA. Zepp et al. (1995) reported that whereas visi-ble sunlight (400-750 nm) hardly causes photochem-ical reactions, solar UV B radiations (280-315 nm) and partially solar UV-A radiation (315-400 nm) in-duce various direct and indirect photochemical
pro-cesses in the top level of surface waters, which can lead to a degradation of anthropogenic micro-pollutants. However, the data shown in Figs. 3, 5 and 6 prob-ably indicate that the quantum flux density of light at the visible light region may be as important as the UV-radiations in the photo-degradation process of EA.
Only substances with UV-absorption spectra in the wavelength range of sunlight reaching the earth's sur-face can undergo direct interaction with sunlight and therefore have a possibility for direct photolysis (Zepp et al., 1985; Jensen-Korte et al., 1987). Jensen-Korte et al. (1987) pointed out that most chemical pesticides for instance, have UV-absorption spectra bands which fade out in the border area of 280-290 nm or below, hence practically, no direct photo-degradation is possi-ble. EA is a photosensitizer, with molecular oxygen as the ubiquitous quencher (Daub and Hangarter, 1983; Daub and Ehrenshaft, 1993; 2000). Only its absolute maximum (217 nm) and first side maxima (268 nm) of the wavelength spectrum are outside the solar energy wavelengths reaching the earth surface (Fig. 1). The four side maxima at 338, 459, 528 and 568 nm (Fig. 1), with 459 nm corresponding to the maximum wave-length range (440-460 nm) of sunlight near the ground (Katagi, 2004) suggest that EA would absorb solar en-ergy in the UV-region reaching the earth surface, and even stronger in the visible light region. Hence, EA has a high possibility for direct photolysis under natu-ral sunlight.
So far, there has not been any report of detection of EA from bindweeds or other environmental samples in-fected by S. convolvuli LA39 despite the indication that
in vitro production of the substance by Stagonospora
isolates of bindweeds is positively related to their pathogenic potentials (Ahonsi et al., 2005). The impli-cation is that, if EA is excreted in the environment by this biocontrol fungus, the likelihood that such excre-tion (probably in parts per billion) may accumulate to a `level of concern' in the environment may not be greater than zero. Further, the results of toxicity bioassay of photo-degraded EA (Table 2) indicate that degradation of EA does not result in any toxic lower molecular weight chemical products. Though photolysis of EA as a perylenequinone photosensitizer would be expected to generate the toxic singlet oxygen species (Daub and Hangarter, 1983; Daub and Ehrenshaft, 1993; 2000; Ma et al., 2003), these reactive species have a half-life as short as between 10-6 and 10-5 seconds (Stahl and
Table 2 Growth of Trichoderma atroviride strain Pl as affected by photo-degraded (10 days daylight illuminated) and non-degraded (non-illuminated) elsinochrome A (EA) in solution
Mycelial growth inhibition (%) n Estimated EA
concentration per 2 days after 3 days after
Treatment malt agar plate (,LM)a inoculation P > t° inoculation P > t` 10 days sunlight illuminated EA (undiluted) 0.19 (3.8)
t0 days sunlight-illuminated EA (2 x diluted) 0.10 (1.9) 10 days sunlight-illuminated EA (4 x diluted) 0.05 (1.0) 10 days sunlight- illuminated EA (8 x diluted) 0.02 (0.5) Non-illuminated EA (undiluted) 3.31(66.1) Non-illuminated EA (2 x diluted) 1.65 (33.0) Non-illuminated EA (4 x diluted) 0.83 (16.5) Non-illuminated EA (8 x diluted) 0.41 (8.25) 0.0 0.73 0.0 1.0 0.0 0.30 0.0 1.0 0.0 0.49 0.0 1.0 0.0 0.73 0.0 1.0 43.4 <0.0001 41.7 <0.0001 41.7 <0.0001 37.2 <0.0001 40.9 <0.0001 34.4 <0.0001 28.9 <0.0001 22.2 <0.0001 'Values in parentheses represent original concentration of EA solution before mixing with agar as estimated by HPLC, while values outside parentheses represent amount of EA present in malt agar—EA mixture per agar plate.
hCalculated as percentages of contrast estimates (in SAS) between growth in treatment and the appropriate solvent control level. 'Values are levels of significance of growth inhibition (contrast between treatment and solvent control).
Sies, 2002), and are therefore, not stable in the envi-ronment.
Acknowledgments This study was conducted under the aegis of an EU project, `Quality of Life and Management of Living Re-sources: Risk Assessment of Fungal Biological Control Agents-RAFBCA 2001-2004 (QLRT-2000-01391)'. Authors' participa-tion in the RAFCA project, and research activities culminating in this research article were made possible by grant No. 00.0164-2 provided by the Swiss Federal Office of Education (OFES).
References
Abramson, D.: 1998, 'Mycotoxin formation and environmen-tal factors,' in Mycotoxins in Agriculture and Food Safety, Singha, K.K. and Bhatnagar, D. (eds.), Marcel Dekker, New York, pp. 255-277
Ahonsi, M.O., Maurhofer, M., Boss, D., and Defago, G.: 2005, 'Relationship between Aggressiveness of Stagonospora sp. Isolates on Field and Heldge Bindweeds, and In Vitro Pro-duction of Fungal Metabolites Cercosporin, Elsinochrome A and Leptosphaerodione,' European Journal of Plant Pathology 111, 203-215
Anthanasopoulos, P.E., Kyriakidis, V., and Stavropoulos, P.: 2004, 'A study on the environmental degradation of pes-ticides azinphos methyl and parathion methyl,' Journal
of Environmental Science and Health: Part B- Pesticides, Food Contaminations, and Agricultural Wastes B39, 297-309
Arnone, A., Merlini, L., Mondellil, R., Nasini, G., Ragg, E. and Scaglioni, L.: 1993, 'Structure, conformational Analy-sis and Absolute configuration of the perylenequinone pig-ments elsinochromes B 1, B2, Cl and C2,' Gazetta Chimica Italiana 123, 131-136
Balis, C. and Payne, M.G.: 1971, 'Triglycerides and cercosporin from Cercospora beticola: Fungal Growth and Cercosporin Production,' Phytopathology 61, 1477-1484
Ballio, A.: 1991, `Non-host-selective fungal phytotoxins- bio-chemical aspects of their mode of action,' Experientia 47, 782-790
Batchvarova, R.B., Reddy, V.S., and Benett, J.: 1992, 'Cellular Resistance in Rice to Cercosporin, a Toxin of Cercospora,' Phytopathology 82, 642-646
Bennett, G.A. and Richard, J.L.: 1996, `Influence of process-ing on Fusarium mycotoxins in contaminated Grains,' Food Technology 50, 235-238
Biggs, W.W.: 1985, `Radiation Measurement,' In L1-1000 Data-logger Instruction Manual, Software Ver. 1.02, Publication No. 8510-51, LI-COR, inc., Lincoln, Nebraska
Bove, F.J.: 1970, The Story of Ergot. S. Karger, New York Carson, R.: 1962, Silent Spring. Houghton Mifflin Co., Boston Chen, C.T., Nakanishi, K., and Natori, S.: 1966, `Biosynthesis
of Elsinochrome A, the Perylenequinone from Elsinoe spp. I,' Chemical and Pharmaceutical Bulletin 14, 1434-1437 Chu, F.S. and Li, G.Y.: 1994, 'Simultaneous Occurrence of
Fu-monisin B 1 and other mycotoxins in moldy corn collected from people's Republic of China in Regions of High Inci-dences of Esophageal Cancer,' Applied and Environmental Microbiology 60, 847-852.
Chu, F.S., Chang, C.C., Ashoor, S.H., and Prentice, N.: 1975, 'Stability of aflatoxin B 1 and ochratoxin Ain Brewing,' Ap-plied Microbiology 29, 313-316
Daub, M.E. and Ehrenshaft, M.: 1993, 'The photoactivated toxin cercosporin as a tool in fungal photobiology,' Physiologia Plantarum 89, 227-236
Daub, M.E. and Ehrenshaft, M.: 2000, `The photoactive cer-cospora toxin cercosporin: Contributions to plant disease and fundamental Biology.' Annual Review of Phytopathol-ogy 38, 461-490
Daub, M.E.: 1982, 'Cercosporin, a photosensitizing toxin from
Cercospora species,' Phytopathology 72, 370-374 Jensen-Korte, U., Anderson, C., and Spiteller, M.: 1987,
'Pho-todegradation of pesticides in the presence of humic sub-stances,' The Science of the Total Environment 62, 335-340 Joffe, A.Z.: 1986, Fusarium Species: Their Biology and
Toxicol-ogy. John Wiley, New York
Katagi, T.: 2004, 'Photodegradation of pesticides on plant and soil surfaces,' Reviews of Environmental Contamination and Toxicology 182, 1-195
Lowes, K.F., Shearman, E.A., Payne, J., MacKenzie, D., Archer, D.B., Merry, R.J., and Gasson, M.J.: 2000, 'Prevention of yeast spoilage in feed and food by the yeast mycocin HMK,'
Applied and Environmental Microbiology 66, 1066-1076 Lubulwa, A.S.G. and Davis, J.S.: 1994, `Estimating the
so-cial cost of the impacts of fungi and aflatoxins in maize and peanuts,' in Highley, E., Wright, E.J., Banks, H.J. and Champ, B.R. (eds.), Stored Product Protection. CAB Inter-national, Wallingford, pp. 1017-1042
Ma, L., Tai, H., Li, C., Zhang, Y., Wang, Z.H., and Ji, W.Z.: 2003, `Photodynamic inhibitory effects of three perylenequinones on human colorectal carcinoma cell line and primate em-bryonic stem cell line,' World Journal of Gastroenterology
9,485-490
Meille, S.V., Malpezzi, L., Allegra, G., Nasini, G., and Weiss, U.: 1989, 'Structure of Elsinochrome A: a Perylenequinone metabolite,' Acta Crystallographica, Section C, Crystal Structure Communications 45, 628-632
Mitchell, T.K., Chilton, W.S., and Daub, M.E.: 2002,'Biodegra-dation of the polyketide toxin cercosporin,' Applied and Environmental Microbiology 68, 4173-4181
Nicolet, B. and Tabacchi, R.: 1999, `Secondary metabolites pro-duced by Stagonospora sp., a Potential Biocontrol Agent Against Bindweeds,' In Lyr, H., Russell, P.E. and Sisler, H.D. (eds.), Modern Fungicides andAntifungal Compounds
II. Intercept Limited, Andover, United Kingdom, pp. 469-476
Niu, J., Chen, J., Martens, D., Henkelmann, B., Quan, X., Yang, F., Seidlitz, H.K., and Schramm, K.-W.: 2004, `The role of UV-B on the degradation of PCDD/Fs and PAHs sorbed on surfaces of spruce (Picea abies (L.) Karst.) Needles,'
Science of the Total Environment 322, 231-241
Sanz-Asensio, J., Plaza-Medina, M., and Martinez-Soria, T.: 1997, `Kinetic study of the degradation of ethiofencarb in aqueous solutions,' Pesticide Science 50, 187-194 Shotwell, O.L., Hesseltine, C.W., and Goulden, M.L.: 1969,
`Ochratoxin A: Occurrence as natural contaminant of a corn sample,' Applied Microbiology 17, 765-766
Shotwell, O.L., Hesseltine, C.W., Vandegraft, E.E., and Goulden, M.L.: 1971, 'Survey of corn from different regions for afla-toxin, ochraafla-toxin, and zearalenone,' Cereal Science Today
16, 266-273
Stahl, W. and Sies, H.: 2002, `Introduction: Reactive Oxy-gen Species,' Research Monographs: Reactive Oxygen Species, Instut fiir Physiologische Chemie 1, Heinrich-Heine-Universitat Dusseldorf
Strasser, H., Vey, A., and Butt, T.M. : 2000, 'Are there any risks in using entomopathogenic fungi for pest control, with partic-ular Reference to the Bioactive Metabolites of Metarhizium, Tolypocladium and Beauveria species?,' Biocontrol Science and Technology 10, 717-735
Tamaoki, T. and Nakano, H.: 1990, `Potent and specific inhibitors of protein kinase C of microbiologic origin,' Biotechnology
8, 732-735
Tschen, J.S.M., Chen, L.L., Hsieh, S.T., and Wu, T.S.: 1997, `Isolation and phytotoxic effects of helvolic acid from plant pathogenic fungus Sarocladium oryzae,' Botanical Bulletin of Academia Sinica 38, 251-256
Vink, J.P.M. and Vanderzee, S.E.A.T.: 1995, `Some physico-chemical and environmental factors affecting transforma-tion rates and sorptransforma-tion of the herbicide metamitron in soil,'
Pesticide Science 46, 113-119
Weiss, U., Merlini, L., and Nasini, G.: 1987, `Naturally occurring perylenequinones,' in Progress in the Chemistry of Organic Natural Products. Herz, W., Grisebach, H., Kirby, G.W. and Tamm, C.H. (eds.), Springer-Verlag, Vienna 52, pp. 1-71 Yumbe-Guevara, B.E., Imoto, T., and Yoshizawa, T.: 2003,
'Ef-fects of heating procedures on deoxynivalenol, nivalenol and zearalenone levels in naturally contaminated barley and wheat,' Food Additives and Contaminants 20, 1132-1140
Zepp, R.G. and Cline, D.M.: 1977, `Rates of direct photolysis in aquatic environment,' Environmental Science and Technol-ogy 11, 359-366
Zepp, R.G., Callaghan, T.V., and Erickson, D.J.: 1995, `Effects of increased solar ultraviolet radiation on biogeochemical cycles,' Ambio 24, 181-187
Zepp, R.G., Schlotzauer P.F., and Sink, R.M.: 1995, 'Photosensi-tized Transformations Involving Electronic Energy Transfer in Natural Waters: Role of Humic Substances,' Environmen-tal Science and Technology 19, 74-81