HAL Id: tel-02891797
https://tel.archives-ouvertes.fr/tel-02891797
Submitted on 7 Jul 2020HAL is a multi-disciplinary open access archive for the deposit and dissemination of sci-entific research documents, whether they are pub-lished or not. The documents may come from teaching and research institutions in France or abroad, or from public or private research centers.
L’archive ouverte pluridisciplinaire HAL, est destinée au dépôt et à la diffusion de documents scientifiques de niveau recherche, publiés ou non, émanant des établissements d’enseignement et de recherche français ou étrangers, des laboratoires publics ou privés.
partir d’un essai de traction biaxiale intégrant l’effet des
chemins de déformation
Alaa Kobeissi
To cite this version:
Alaa Kobeissi. Caractérisation mécanique des matériaux composites à partir d’un essai de traction biaxiale intégrant l’effet des chemins de déformation. Autre. INSA de Rennes; Université Libanaise. Faculté de génie, 2019. Français. �NNT : 2019ISAR0021�. �tel-02891797�
T
HESE DE DOCTORAT DE
L’UNIVERSITE
LIBANAISE
L’INSA
RENNES
COMUE UNIVERSITE BRETAGNE LOIRE
ECOLE DOCTORALE N° 602
Sciences pour l'Ingénieur
Spécialité : « Génie Mécanique »
« Caractérisation mécanique des matériaux composites à partir d’un
essai de traction biaxiale intégrant l’effet des chemins de déformation »
Thèse présentée et soutenue à « Rennes », le « 20/12/2019 »
Unité de recherche : Laboratoire de Génie Civil et Génie Mécanique (LGCGM), INSA Rennes Centre de Recherche Scientifique en Ingénierie (CRSI), Université Libanaise Thèse N° : 19ISAR 38 / D19 - 38
Par
« Alaa KOBEISSI»
Rapporteurs avant soutenance :
Nathalie GODIN Maître de Conférences, HDR, Laboratoire MATEIS, INSA Lyon Fréderic LACHAUD Professeur, ISAE Supaéro,
Toulouse
Composition du Jury :
Nathalie GODIN Maître de Conférences, HDR, Lab. MATEIS, INSA Lyon, Rapporteur Vincent KERYVIN Professeur, IRDL, Université de
Bretagne Sud, Lorient, Examinateur Fréderic LACHAUD Professeur, ISAE Supaéro, Toulouse,
Rapporteur
Evelyne TOUSSAINT Professeur, Université Clermont Auvergne, Clermont Ferrand, Examinateur (Présidente) Lionel LEOTOING Maître de Conférences, HDR,
LGCGM, INSA Rennes, Co-directeur de thèse
Pierre RAHME Professeur, Faculté de Génie, Université Libanaise, Co-directeur de thèse
Intitulé de la thèse :
Caractérisation Mécanique des Matériaux Composites à Partir
d’un Essai de Traction Biaxiale Intégrant l’effet des Chemins
de Déformation
Mechanical Characterization of Composite Materials
Subjected to Biaxial Tensile Test Integrating the Effect of
Strain Paths
Alaa KOBEISSI
En partenariat avec :
First, I would like to express my sincere gratitude to my research supervisors, Dr. Lionel Leotoing, Dr. Pierre Rahme, and Dr. Dominique Guines, for their continuous support during my thesis, their patience, motivation, and immense knowledge. Their guidance helped me during my whole work and writing of this thesis. Thank you so much for your inspiration and encouragement.
I would also like to thank all the colleagues at the Laboratory of Civil and Mechanical Engineering (LGCGM) for their friendship and encouragement. I’d like to express my special acknowledgment to the master students “Queen Tannous” and “Elias Estephan” for their cooperation. I’m also grateful to the engineers in the laboratory for the specimen preparation and technical support.
Last but not the least, I would like to thank my family: my parents, my brothers, and my sister for supporting me spiritually throughout writing this thesis and my life in general.
Au cours des dernières années, les matériaux composites à fibres continues ont été largement utilisés dans la plupart des applications d’ingénierie en raison de leurs propriétés mécaniques spécifiques élevées. Bien que les composites présentent de nombreux avantages par rapport aux autres matériaux, leur fort comportement mécanique anisotrope rend la caractérisation de ces matériaux plus compliquée lorsqu'ils sont soumis à des conditions de chargement multiaxiales. Les essais uniaxiaux sont principalement utilisés pour la caractérisation des matériaux composites en raison de leur simplicité et de leur faible coût. Cependant, ces essais ne sont pas adaptés pour caractériser le comportement du matériau soumis à un état de contrainte multiaxiale Pour mieux caractériser leur comportement, des essais biaxiaux ont été développés. Parmi les différentes techniques de traction biaxiale, l’essai de traction sur éprouvettes cruciformes est l'une des méthodes les plus connues. Les avantages de cette méthode par rapport aux autres techniques biaxiales sont la possibilité de contrôler l’état de contrainte biaxiale dans la zone centrale de l’éprouvette en chargeant chaque bras de manière indépendante. Cependant, la difficulté de cette méthode réside dans le choix de l’éprouvette cruciforme qui doit présenter une rupture dans la zone centrale. Pour atteindre cet objectif, une réduction d'épaisseur dans la zone centrale est nécessaire. Dans la littérature, deux méthodes ont été utilisées pour réduire l’épaisseur de l’éprouvette dans la zone centrale. La première méthode consiste à mettre en sandwich le composite étudié entre deux couches de composite avec un trou au centre afin de former une éprouvette d'épaisseur réduite complète. La seconde consiste à enlever par usinage un nombre spécifique de plis de la zone centrale tandis que les plis restants au centre définissent le composite étudié.
Dans cette étude, une nouvelle éprouvette cruciforme est définie pour les essais de traction biaxiale d'un tissu de composite verre/époxy. Sur la base des études précédentes, l’idée d’usiner la zone centrale du composite est évitée et un nouveau concept est proposé en collant des talons en aluminium des deux côtés de la plaque composite à épaisseur constante. La réduction d'épaisseur est réalisée uniquement par les talons en aluminium afin d'éviter l'usinage du composite. Les dimensions finales de l’éprouvette cruciforme sont définies par une étude paramétrique numérique tout en respectant certaines contraintes expérimentales telles que la capacité de la machine de traction biaxiale. Une validation expérimentale est réalisée sur deux composites verre / époxy de différentes épaisseurs (0,5 et 1 mm). Les essais ont été réalisés pour différentes conditions de chargement biaxial (de l’uniaxial à l’équi-biaxial). La distribution des déformations dans la zone centrale de l’éprouvette est obtenue à l'aide de la technique de corrélation d'image (DIC). Les contraintes sont calculées en fonction des propriétés du matériau et des déformations expérimentales à l'aide des équations de la loi de comportement du composite. L'enveloppe à la rupture est tracée et comparée aux prédictions de trois critères à la rupture (Max Stress, Max Strain et Norris).
Enfin, une ouverture de ce travail sur l’étude de la résistance de composites fissurés sous differentes charges biaxiales est présentée.
Over the past years, continuous fiber composite materials have become extensively used in most engineering applications due to their high specific mechanical properties. These materials have many benefits compared to other materials. Although, their strong anisotropic mechanical behavior makes the characterization of those materials complicated when they are subjected to multi-axial loading conditions. Uniaxial tests are mostly used for the characterization of composite materials because of their simplicity and low cost. However, these tests are not adapted for the characterization of the behavior of these materials subjected to multiaxial stress state. For a better characterization of their behavior, biaxial tests are used.
Among different biaxial testing techniques, the in-plane biaxial testing of cruciform specimen is one of the most known methods. The benefits of this method compared to the other biaxial techniques is the ability of controlling the biaxial stress state in the central zone of the specimen by independently loading each arm. However, the main difficulty of this method is the design of a cruciform specimen that fails in the central area. In order to achieve this, a thickness reduction in the central zone is required. In the literature, two methods have been used in order to reduce the thickness of the specimen in the central zone. The first method is by sandwiching the studied composite between two layers of composite with a hole in the center in order to form a complete reduced thickness specimen. The second is by milling a specific number of plies from the central zone while the remaining plies in the central thickness define the studied composite.
In this thesis, a new cruciform specimen is designed for the biaxial tensile testing of plain-weave glass/epoxy composite. Based on the previous studies, the idea of milling the composite central zone is avoided. A new concept is proposed by gluing aluminum tabs with a central hole on both sides of the constant thickness composite laminate. The thickness reduction is made only in the aluminum tabs in order to avoid machining in the composite. The final dimensions of the cruciform specimen are defined by numerical parametric study while respecting some experimental constraints such as biaxial tensile machine capacity. An experimental validation is performed on two plain-weave glass/epoxy composites with different thicknesses (0.5 and 1 mm). The tests are performed under different biaxial loading conditions (from uniaxial to equi-biaxial stress state). The strain distribution in the central zone of the specimen are obtained using the Digital Image Correlation (DIC) technique. The stresses are calculated based on the constitutive law equations using the material properties and the experimental strains. The failure envelop is generated and compared to the predictions of three failure criteria (Max Stress, Max Strain, and Norris distortional energy).
As final part of this thesis, an opening of this work towards the study of the resistance of notched composites under different biaxial loadings is presented.
General Introduction ... 1
Chapter 1. State of the Art ... 3
1.1. Introduction ... 4
1.2. Mechanical characterization of composite materials ... 4
1.2.1. Tension and Compression ... 4
1.2.2. Shear test ... 5
1.2.3. Bending or Flexural test ... 7
1.2.4. Other purposes to perform uniaxial tests ... 7
1.3. Biaxial testing methods ... 8
1.3.1. Biaxial testing techniques ... 9
1.3.2. Choice of an adapted biaxial testing technique ... 11
1.3.3. Biaxial testing machines on cruciform specimens ... 12
1.4. In-plane biaxial test on cruciform specimens ... 14
1.4.1. Metal cruciform specimen ... 14
1.4.2. Composite cruciform specimen ... 18
1.5. Conclusion ... 29
Chapter 2. Design of the Cruciform Specimen ... 31
2.1. Introduction ... 32
2.2. Selection of the cruciform shape ... 33
2.2.1. Selected shapes ... 33
2.2.2. Numerical comparison ... 36
2.3. Effect of geometrical parameters ... 40
2.3.1. External parameters ... 41
2.3.2. Tab geometry in the gage section ... 42
2.4. Effect of aluminum grade ... 48
Chapter 3. Biaxial Experimental Characterization of Failure ... 57
3.1. Introduction ... 58
3.2. Uniaxial characterization of composite materials ... 58
3.2.1. Materials ... 58
3.2.2. Strain measurement techniques... 59
3.2.3. Test results and material properties ... 61
3.2.4. Uniaxial tests under different strain rates ... 63
3.3. Biaxial test setup ... 65
3.3.1. Biaxial testing machine ... 65
3.3.2. Cruciform specimen preparation... 66
3.3.3. Experimental parameters ... 69
3.4. Strain measurement ... 69
3.4.1. Effect of DIC parameters ... 69
3.4.2. Experimental verification of the effect of aluminum grade ... 71
3.4.3. Strain results for M9.6 composite ... 72
3.4.4. Strain results for M21 composite ... 75
3.4.5. Strain path ... 80
3.5. Stress calculation ... 81
3.5.1. Stress calculation methods ... 81
3.5.2. Stress results for M9.6 composite ... 82
3.5.3. Stress results for M21 composite ... 85
3.6. Conclusion ... 89
Chapter 4. Influence of Loading Paths on Failure Limits ... 91
4.1. Introduction ... 92
4.2. Comparison between numerical and experimental results ... 92
4.2.1. Cohesive elements modeling ... 92
4.2.2. Boundary conditions ... 93
4.2.3. Numerical model results ... 94
4.3.1. Introduction ... 98
4.3.2. Failure criteria selected ... 101
4.3.3. Failure envelop of M21 composite ... 102
4.4. Biaxial testing of Notched composite ... 105
4.4.1. Introduction ... 105
4.4.2. Notched specimen preparation ... 106
4.4.3. Biaxial test results ... 107
4.5. Conclusion ... 114
Conclusion and Perspectives ... 115
References ... 117
Figures
Figure 1.1 (a) Tension and (b) Compression of flat specimens [2] ... 5
Figure 1.2 Conventional shear tests: (a) torsion of tubes, (b) Iosipescu, (c) double notched, and (d) off-axis [2] ... 6
Figure 1.3 Three point bending test [2] ... 7
Figure 1.4 Shokrieh failed specimens under different tensile rates: (a) 0.0017 s-1, (b) 0.55 s-1, (c) 5.6 s-1, (d) 46 s-1 and (e) 85 s-1[12] ... 8
Figure 1.5 Biaxial testing techniques: (a) Biaxial flexure testing of plate [21], (b) Bulge test [24], (c) off-axis test [2], (d) Iosipescu test [34], (e) Biaxial bending moment on flat specimens [27], (f) axial/ torsion of tubes [35], (g) axial/pressure of tubes [36], and (h) cruciform specimen [37] ... 11
Figure 1.6 Biaxial testing machines with one actuator developed by Bhatnagar [40] ... 12
Figure 1.7 Biaxial testing machines with two actuators developed by: (a) Hoferlin [41] and (b) Lin [42] ... 13
Figure 1.8 Biaxial testing machines with four actuators developed by: (a) Makinde/Green [44] and (b) Gower [45] ... 14
Figure 1.9 Tri-axial testing machines developed by: (a) Welsh [46] and (b) ASTREE [50] .. 14
Figure 1.10 Methods used in the design of cruciform specimen [55] ... 15
Figure 1.11 Cruciform specimen proposed by Hayhurst [57] ... 15
Figure 1.12 Specimen with two thickness reductions [59] ... 16
Figure 1.13 Cruciform specimen without slits [37] ... 16
Figure 1.14 Cruciform proposed by (a) Yu [60] and (b) Zhang [61] ... 17
Figure 1.15 Zidane optimized specimen geometry [46] ... 17
Figure 1.16 Liu optimal specimen ... 18
Figure 1.17 Composite cruciform specimens with slits developed by: (a) Youssef [63]and (b) Ohtake [64] ... 19
Figure 1.18 Cruciform specimen presented by: (a) Hopgood [67], (b) Williamson [65], and (c) Kumazawa [68] ... 20
Figure 1.19 Damage evolution in the cruciform specimen [68] ... 21
Figure 1.20 Specimens tested by Escarpita [70]: (a) constant thickness, (b) square central zone, and (c) rohmboidal central zone ... 21
Figure 1.21 Cruciform specimens with: aluminum shims (Type I) and G10 tabs (Type II) [71] ... 22
Figure 1.22 Failure of all three specimen types [71] ... 22
Figure 1.23 Four specimen shapes studied by Correa et al. [72] ... 23
Figure 1.24 3D geometrical model proposed by Correa [72] ... 23
Figure 1.26 Through- thickness dimensions of Smits specimen [75] ... 26
Figure 1.27 First principal strain results for the four different geometries studied by Smits et al. [75] ... 26
Figure 1.28 Strain variation with respect to the position in the central zone [75] ... 26
Figure 1.29 Experimental (top) and numerical (bottom) strain field results under different loading conditions. ... 27
Figure 1.30 𝜀𝑥 strain distribution of the optimized form (a) and the commonly tested case (b) ... 28
Figure 1.31 Deformation results for specimens with normal and reversed tabbing ... 28
Figure 1.32 Premature failure of composites fabricated with tabbing method ... 29
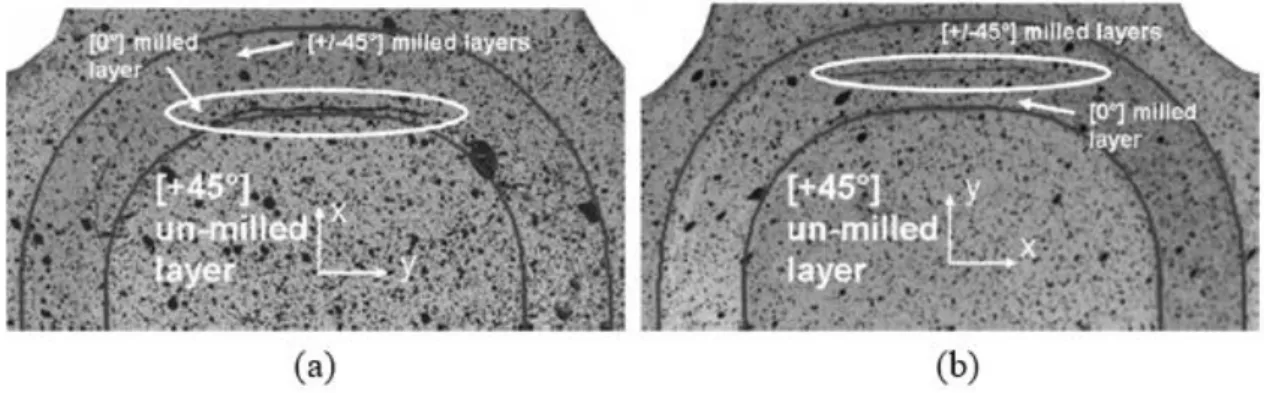
Figure 1.33 Crack initiation in the milled layers for (a) x and (b) y-direction loading ... 29
Figure 2.1 Fibers orientation with respect to x and y directions ... 33
Figure 2.2 Cruciform specimen parts disassembled ... 34
Figure 2.3 Cruciform specimen: shape A ... 35
Figure 2.4 Cruciform specimen: shape B ... 35
Figure 2.5 Cruciform specimen: shape C ... 35
Figure 2.6 True stress- plastic strain curve for AA2017 alloy ... 36
Figure 2.7 Boundary Conditions for the numerical modeling ... 37
Figure 2.8 Mesh and number of elements for each specimen... 37
Figure 2.9 Equivalent stress distribution 𝜎𝑒𝑞 (𝑀𝑃𝑎) for three specimens ... 38
Figure 2.10 Normalized equivalent strain distribution for three specimens ... 39
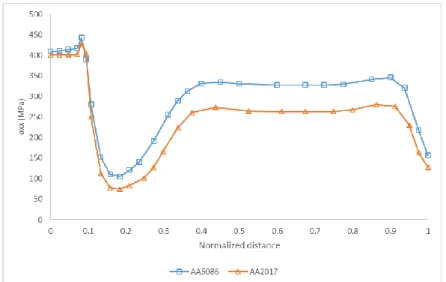
Figure 2.11 Variation of equivalent stress with respect to the normalized distance ... 39
Figure 2.12 Variation of the normalized equivalent strain with respect to the normalized distance ... 39
Figure 2.13 Evolution of tensile loading with respect to the applied displacement ... 40
Figure 2.14 Geometrical parameters for the design of the cruciform specimen ... 41
Figure 2.15 Equivalent stress distribution 𝜎𝑒𝑞 (𝑀𝑃𝑎) in the composite for different fillet corners ... 42
Figure 2.16 Equivalent stress distribution 𝜎𝑒𝑞 (𝑀𝑃𝑎) for different central zone radii ... 43
Figure 2.17 𝜎𝑥𝑥 (𝑀𝑃𝑎) distribution for different central zone radii ... 44
Figure 2.18 Variation of 𝜎𝑥𝑥 with respect to the x-direction arm normalized distance using different central zone radii ... 44
Figure 2.19 Equivalent stress distribution 𝜎𝑒𝑞 (𝑀𝑃𝑎) for different outer tapered radii ... 45
Figure 2.20 Aluminum tabs with 0 and 1 mm ending thickness ... 46
Figure 2.21 Equivalent stress distribution 𝜎𝑒𝑞 (𝑀𝑃𝑎) in the composite for (a) 0 mm and (b) 1 mm ending thickness... 46
Figure 2.23 Equivalent stress distribution 𝜎𝑒𝑞 (𝑀𝑃𝑎) in the composite for (a) curved and (b)
linear aluminum thickness reduction shape ... 47
Figure 2.24 Comparison between 𝜎𝑥𝑥 results in the composite using curved and linear thickness reduction transition ... 48
Figure 2.25 True stress- plastic strain curve for AA5086 and AA2017 alloys ... 49
Figure 2.26 𝜎𝑒𝑞 (𝑀𝑃𝑎) in composite using (a) AA2017 and (b) AA5086 aluminum tabs ... 50
Figure 2.27 Comparison between 𝜎𝑥𝑥 (MPa) results in the composite using different aluminum alloy tabs ... 50
Figure 2.28 Plastic Strain (𝑃𝐸𝑥𝑥 ) in (a) AA2017 and (b) AA5086 aluminum tabs ... 50
Figure 2.29 𝜎𝑒𝑞 (𝑀𝑃𝑎) in composite using AA5086 with a thickness of (a) 5.5mm and (b) 3mm ... 51
Figure 2.30 Comparison between 𝜎𝑥𝑥 (MPa) results in the composite using different aluminum thicknesses ... 51
Figure 2.31 Load vs. displacement using the new geometrical parameters of the specimen .. 52
Figure 2.32 Cruciform specimen shape for the biaxial characterization test ... 53
Figure 2.33 𝜎𝑥𝑥 (𝑀𝑃𝑎) in composite under different biaxial displacement ratios ... 54
Figure 2.34 𝜀𝑥𝑥 in composite under different biaxial displacement ratios... 54
Figure 2.35 Major versus minor strains for different biaxial ratios ... 54
Figure 3.1 Digital Image Correlation (DIC) principle ... 60
Figure 3.2 Digital Image Correlation (DIC) parameters ... 61
Figure 3.3 M9.6 uniaxial specimens ... 62
Figure 3.4 M21 uniaxial specimen... 62
Figure 3.5 Strain results for uniaxial test of M21 composite using extensometer and DIC techniques ... 63
Figure 3.6 Digital image correlation for specimen tested under a strain rate of 0.25 s-1 ... 64
Figure 3.7 Uniaxial specimen tested under different strain rates... 65
Figure 3.8 Elastic properties of the composite subjected to uniaxial loading for different strain rates ... 65
Figure 3.9 Schema of the biaxial testing machine in LGCGM ... 66
Figure 3.10 Biaxial testing machine including the camera and the tested specimen ... 66
Figure 3.11 Double-lap joint shear test specimen ... 67
Figure 3.12 Evolution of shear stresses in the adhesive with and without aluminum shot peening surface treatment ... 67
Figure 3.13 Composite and aluminum tabs cruciform shapes before assembly ... 68
Figure 3.14 Assembled cruciform specimen for the biaxial test ... 68
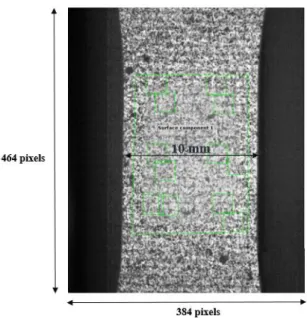
Figure 3.15 Small and large strain calculation zones ... 70
Figure 3.16 Comparison between large and small strain calculation zone results under equibiaxial test ... 70
Figure 3.17 Strain results using different DIC parameters under equibiaxial test ... 71
Figure 3.18 Composite strain at the central point of the specimen for AA2017 and AA5086 72 Figure 3.19 Variation of R with respect to the imposed displacement ... 72
Figure 3.20 M9.6 cruciform specimen failure under 1/free biaxial ratio ... 73
Figure 3.21 Evolution of the loads and strains with respect to applied displacement for M9.6 composite subjected to 1/free, 1/2, and 1/1 biaxial ratios ... 74
Figure 3.22 𝜀𝑥 and 𝜀𝑦 strains distribution in the central zone of the M9.6 composite subjected to 1/2 biaxial ratio ... 75
Figure 3.23M21 cruciform failure under (a) free/1, (b) 1/2, and (c) 1/1.4 biaxial ratios... 75
Figure 3.24 Evolution of the loads and strains with respect to applied displacement for M21 composite subjected to free/1, 1/2, and 1/1 biaxial ratios ... 77
Figure 3.25 𝜀𝑥 and 𝜀𝑦 strains distribution in the central zone of the M21 composite subjected to 1/1 biaxial ratio (test01) ... 78
Figure 3.26 Evolution of the loads and strains with respect to applied displacement for M21 composite subjected to 1/3, 1/1.4, and 1/1.2 biaxial ratios ... 79
Figure 3.27 Strain path plot for M9.6 composite ... 80
Figure 3.28 Strain path plot for M21 composite ... 81
Figure 3.29 Equivalent section stress calculation principle ... 82
Figure 3.30 Evolution of the stresses 𝜎𝑥 and 𝜎𝑦 with respect to applied displacement Ux (mm) for M9.6 composite subjected to 1/free,1/2, and 1/1 biaxial ratios ... 83
Figure 3.31 Evolution the calculated equivalent sections Aequ,x and Aequ,y for M9.6 composite subjected to 1/1 biaxial displacement ratio ... 84
Figure 3.32 Evolution of the stresses 𝜎𝑥 and 𝜎𝑦 with respect to applied displacement for M21 composite subjected to free/1, 1/2, and 1/1 biaxial ratios ... 86
Figure 3.33 Evolution of the stresses 𝜎𝑥 and 𝜎𝑦 with respect to applied displacement for M21 composite subjected to 1/3, 1/1.4, and 1/1.2 biaxial ratios ... 87
Figure 3.34 Evolution the calculated equivalent sections Aequ,x and Aequ,y for M21 composite subjected to 1/1 biaxial ratio ... 88
Figure 4.1 One-quarter of the cruciform specimen with adhesive modeling ... 93
Figure 4.2 Boundary conditions for the cruciform specimen modeling ... 93
Figure 4.3 Major stress distribution 𝜎𝑦 (𝑀𝑃𝑎) in composite: (a) with adhesive modeling and (b) without adhesive modeling under free/1 biaxial ratio ... 94
Figure 4.4 Shear stress distribution 𝜎𝑦𝑧 (𝑀𝑃𝑎) in the adhesive joint ... 94
Figure 4.6 Comparison between numerical and experimental strain results for M21 composite subjected to free/1 biaxial ratio ... 96
Figure 4.7 Shear stresses 𝜎𝑦𝑧 (MPa) in the adhesive when a displacement of 0.65 mm is reached in M21 composite subjected to free/1 biaxial ratio ... 96
Figure 4.8 Evolution of numerical and experimental strains in the composite and the
numerical equivalent plastic strain (PEEQ) in the aluminum tabs for biaxial ratio free/1 ... 96
Figure 4.9 Comparison between numerical and experimental strain results for M21 composite subjected to 1/2, 1/3, and 1/1 biaxial ratios ... 97
Figure 4.10 Evolution of major and minor strains of M21 composite under different strain paths ... 98
Figure 4.11 Comparison between the predicted and measured biaxial final failure stresses for(0°/ ± 45°/90°) AS4/3501-6 laminates [83] ... 99
Figure 4.12 Results of AIAA failure criteria survey [88] ... 101
Figure 4.13 Experimental failure envelop of M21 composite ... 102
Figure 4.14 Experimental and different non interactive criteria failure envelops of M21 composite ... 103
Figure 4.15 Experimental and Norris failure criterion envelops of M21 composite ... 104
Figure 4.16 Experimental and selected failure criteria envelops of M21 composite ... 105
Figure 4.17 ABS guide for notch generation in the center of the cruciform specimen ... 107
Figure 4.18 Assembled cruciform notched specimen for biaxial test ... 107
Figure 4.19 Failed cruciform notched specimens under different biaxial tensile ratio ... 108
Figure 4.20 Load Fy (N) results for notched and un-notched specimen under biaxial free/1 ratio ... 109
Figure 4.21 Load (a) difference and (b) ratio between notched and un-notched specimen under biaxial free/1 ratio ... 109
Figure 4.22 𝜀𝑥 strain fields of notched specimen under biaxial free/1 ratio ... 110
Figure 4.23 𝜀𝑦 strain fields of notched specimen under biaxial free/1 ratio ... 110
Figure 4.24 Loads results (a) Fx and (b) Fy for notched and un-notched specimen under biaxial 1/2 ratio ... 111
Figure 4.25 X-direction load (a) difference and (b) ratio between notched and un-notched specimen under biaxial 1/2 ratio ... 111
Figure 4.26 Y-direction load (a) difference and (b) ratio between notched and un-notched specimen under biaxial 1/2 ratio ... 111
Figure 4.27 𝜀𝑥 strain fields of notched specimen under biaxial 1/2 ratio ... 112
Figure 4.28 𝜀𝑦 strain fields of notched specimen under biaxial 1/2 ratio ... 112
Figure 4.29 Loads results (a) Fx and (b) Fy for notched and un-notched specimen under biaxial 1/1 ratio ... 113
Figure 4.30 𝜀𝑥 strain fields of notched specimen under biaxial 1/1 ratio ... 113
Tables
Table 2.1 M9.6GF/200T2/G plain-weave material properties ... 36 Table 2.2 Yield and ultimate strengths for aluminum alloy AA2017 and AA5086 ... 48 Table 2.3 Final geometrical parameters for the cruciform specimen ... 52 Table 3.1 DIC parameters for the uniaxial test of M21 composite ... 62 Table 3.2 Averaged material properties for both M9.6 and M21 composites ... 63 Table 3.3 Experimental parameters for uniaxial tests under different strain rates ... 64 Table 3.4 Experimental parameters for the biaxial test ... 69 Table 3.5 Load and strain results at the onset of failure of M9.6 composite subjected to different biaxial ratios ... 74 Table 3.6 Load and strain results at the onset of failure of M21 composite subjected to biaxial ratios (free/1, 1/2, and 1/1) ... 78 Table 3.7 Load and strain results at the onset of failure of M21 composite subjected to 1/3, 1/1.4, and 1/1.2 biaxial ratios ... 80 Table 3.8 Stress results at the onset of failure of M9.6 composite subjected to 1/free, 1/2, and 1/1 biaxial displacement ... 84 Table 3.9 Stress results at the onset of failure of M21 composite subjected to free/1, 1/2, 1/1, 1/3, 1/1.2, and 1/1.4 biaxial ratios ... 89
Notations
𝜎𝑖𝑗 Components of stress tensor 𝜎𝑖 Components of principal stresses 𝜎𝑒𝑞 Equivalent stress
𝜀𝑖𝑗 Components of strain tensor 𝜀𝑖 Components of principal strains 𝜀𝑒𝑞 Equivalent strain
𝑃𝐸𝑖𝑗 Components of the plastic strain tensor 𝜀̇ Strain rate
𝐴𝑒𝑞𝑢,𝑥 Equivalent section in x-direction 𝐴𝑒𝑞𝑢,𝑦 Equivalent section in y-direction U Displacement 𝜗 Poisson ratio E Young modulus G Shear modulus V Velocity F Load
PEEQ Equivalent plastic strain AA Aluminum Alloy
1
General Introduction
Over the past decades, composites have become a key element in all mechanical parts. Their excellent mechanical performance with low specific weight explain why these materials are important in applications in different industries like aeronautics, transportation, sports, and health care. Although composites present many benefits compared to traditional materials, mechanical characterization and computation of composite structures are not straightforward due to the complexity of these materials. This is particularly true in the case of continuous fiber composites consisting of two phases (fibers and matrix) and of several laminae stacked in different directions leading to strong anisotropic mechanical behavior.
Conventional uniaxial tests are usually used in order to identify the material properties of the composite. However, these methods are not capable to identify the real mechanical behavior of composites subjected to multi-axial stress states in engineering applications. Thus, biaxial tests can be performed. Among the different biaxial testing methods, the in-plane biaxial test on cruciform specimens is one of the most interesting methods because of its simplicity in generating different biaxial loading combinations by applying loads on both arms of the flat cruciform specimen. At the same time, the design of the cruciform specimen is the most difficult task in this type of biaxial testing since a homogeneous and maximum stress state must be obtained in the central area of the specimen (area subjected to biaxial stress state). Different studies were performed by researchers in order to obtain a reliable composite cruciform specimen for the biaxial testing. The high number of defined cruciform shapes prove that there is no-well adapted shape for the biaxial testing. The objective of this thesis begins with a definition of a new cruciform specimen for the biaxial characterization of plain-weave glass/epoxy composite. The goal behind the test is to obtain the failure stresses of this woven composite when it’s subjected to different biaxial loading conditions. The results of this work are presented into four different chapters as below:
In Chapter 1, a complete literature review regarding the characterization of composite materials is presented. The chapter begins by citing conventional uniaxial characterization tests, then introduces different biaxial testing techniques leading to the in-plane biaxial testing of cruciform specimens. Since the difficulty of this test is the design of the specimen, different metallic and composite cruciform shapes will be presented according to previous researchers as opening to the next chapter.
2
Chapter 2 deals with the design of the cruciform specimen for the biaxial test. First, a numerical comparison between three different cruciform shapes inspired from the literature is performed in order to select one shape that fulfill the requirements for a successful biaxial test such as homogeneous and maximum stress state in the central region. According to different experimental constraints (i.e. biaxial machine capacity and strain measurement technique), a parametric study is performed on each geometrical parameter in order to re-dimension the specimen while respecting the previous constraints. A final part in this chapter is to verify the strain path and failure of the specimen in the central zone for different biaxial loading conditions
Chapter 3 presents the complete experimental phase of this study which is an experimental verification of the failure in the central zone of the designed cruciform specimen using two different plain-weave glass/epoxy composites with different thicknesses. The experimental phase begins with uniaxial characterization of the studied composites in order to obtain the material properties such as Young modulus, shear modulus, and Poisson ratio. Later on, the biaxial study begins with a description of the biaxial testing machine developed at INSA de Rennes. The strains are measured using the Digital Image Correlation (DIC) method, and the stresses are calculated based on the measured strains and the material properties using the constitutive law equations. The results are obtained for different biaxial loading conditions (varying from uniaxial to equi-biaxial loading states).
Chapter 4 shows the analysis of the results obtained from the previous chapters where a comparison between the numerical and the experimental results is performed in order to show the accuracy of the numerical model. Moreover, the strain path curves are plotted based on the evolution of the minor and major strains in the central zone of the composite, the curves can validate the biaxial state in the composite for different loading conditions. Also, the traction/traction quadrant of the failure envelop is generated and compared with three different interactive and non-interactive failure criteria in order to show the accuracy of each criterion compared to the experimental stresses. The final section of this chapter is an opening for a perspective work regarding the effect of impact on the behavior of the composite. A cruciform crack is generated in the central zone of the specimen which is supposed to represent the effect of an impact on the composite. Different biaxial tests are performed in order to show the effect of the impact on the behavior of the composite under different biaxial loading conditions.
The final part of the study is a conclusion summarizing all the results obtained from this study with some perspectives about the future works.
3
4
1.1. Introduction
This chapter presents a state of art related to the studied subjects in this thesis. First, conventional uniaxial tests for the composite characterization are cited. However, in order to represent the real behavior of the material subjected to multi-axial stress state during real life applications, an overview of the biaxial testing techniques is presented. The advantages of the in-plane biaxial test on flat cruciform specimens over the other testing methods are discussed. Finally, a brief review of the biaxial testing machines and the different cruciform specimen shapes found in the literature are presented.
1.2. Mechanical characterization of composite materials
Over the past decades, composites are widely used in many industries such as aeronautic, aerospace, automotive, boating, because of their low specific weight, good mechanical properties and corrosion resistance. Composite materials are by nature highly anisotropic. The material properties of composite materials are most often determined by means of uniaxial tensile tests. The characterization of the anisotropic behavior requires numerous uniaxial tests to be determined [1]. In the following, the mostly used conventional tests to characterize the mechanical constants of composite materials are presented based on the type of loading.
1.2.1. Tension and Compression
1.2.1.1 Tensile testing of flat specimensThe stresses are calculated based on the loaded section and the load. The failure mode in this type of tests can vary according to the angle between the loading direction and the fiber angles. For example, for unidirectional fibers the failure mode can change from the rupture of fibers (loads are parallel to the fibers direction) towards a failure perpendicular to the fibers (transverse test) [2].
Standards have been defined the specimen for the tensile characterization test (ASTM D3039 and ISO 527). For high strength composites, it is necessary to use tabs (such as glass reinforced composites, aluminum or veneer) bonded on the clamp sections in order to avoid the failure of the material in the grips. The bonded area must be large enough to reach the failure of the composite before the adhesive shear failure. Figure 1.1-a shows the shape of the specimen with the material properties identified based on this type of test.
5 1.2.1.2 Compressive testing of flat specimens
Different approaches have been defined on the way of loading the specimen for the compression test. Loading the specimen with only compressive load was not efficient because of the non-uniform stress distribution which leads to premature failure. The specimen must be stable, especially in the gage section, to prevent the buckling problem. In 1975, another way has been defined (ASTM D3410-16) for the compression tests on flat specimens by applying shear load using the grips in a special fixture. Some studies were carried out in order to compare the compressive strength of the material obtained from both ways of loading. It was concluded that loading the specimen at the end gave higher compressive strength results compared to the one loaded by shear [3]. A third method was also proposed as the combination of the normal forces at the end of the specimen with the shear forces applied along with the faces of the specimen. The identified material parameters are shown in Figure 1.1-b.
Figure 1.1 (a) Tension and (b) Compression of flat specimens [2]
1.2.2. Shear test
There is no well-adapted testing method for measuring shear properties especially the shear strength. Nevertheless, the main tests found in the literature are presented hereafter.
1.2.2.1 Torsion of tubes
In this test, both shear modulus and strength can be measured. An applied moment on the tubular specimen generates tangential stresses around the circumferences and the length of the specimen. In this method, the shear strength (𝜏𝑥𝑧𝑢 ) and shear modulus (𝐺𝑥𝑧) of the material are obtained as shown in Figure 1.2-a. However, it was stated that tubular composites are expensive and difficult to fabricate and moreover doesn’t well represent the component in real life applications [3].
6 1.2.2.2 Iosipescu shear test
This method is one of the most common methods for direct shear testing where a double v-notched specimen is loaded by two opposite forces to create a pure shear ([4]–[6]). In this method, the shear strength (𝜏𝑥𝑦𝑢 ) and shear modulus (𝐺𝑥𝑦) of the material are obtained as state shown in Figure 1.2-b. The method was initially developed for isotropic materials and then adopted to composite materials by Adams and Walrath [7]. It was noted that a shear stress concentration was generated at the root of each notch. This stress concentration was reduced by changing the notch angle and rounding the bottom of each notch [5].
1.2.2.3 Double-notched shear test
This method was primarily used because of the simplicity of the specimen fabrication and the use of the same fixture for all the tests. A defined specimen (according to ASTM D 3846-08 [8]) with two notches is loaded in a compressive state, the shear strength (𝜏𝑥𝑧𝑢 ) is obtained by dividing the compressive load with the shear loaded zone (Figure 1.2-c). Premature failure could occur in this type of specimens because of the stress concentrations. In this test, shear modulus cannot be calculated because shear strains cannot be measured [3].
1.2.2.4 45º laminate shear test
A simple rectangular specimen with a fiber orientation of 45º with respect to the applied load direction, as shown in Figure 1.2-d, is simply used [9]. The applied load induces a shear stress state parallel to the fibers direction. The shear modulus and strength are calculated based on the amount of the applied load and the measured strains using classical laminate theory.
Figure 1.2 Conventional shear tests: (a) torsion of tubes, (b) Iosipescu, (c) double notched, and (d) off-axis [2]
7
1.2.3. Bending or Flexural test
Bending tests are also one of the popular testing methods because of the simplicity of both test and specimen shape. It was first used on isotropic metals. For the composite materials, bending tests still have problems caused by the non-uniformity of the stress distribution in the specimen. Bending of the beam is usually subjected to a combination of all shear, tension and compression states (tension on the top surface, compression on the lower surface and interlaminar shear in the middle) [3]. The most known type is the three point bending test (Figure 1.3). The bending shear modulus, Young modulus, and the strengths can be obtained from this test. The bending stresses distribution is in a triangular form where the stresses increase linearly from the ends of the beam towards the middle where maximum bending stresses are reached.
Figure 1.3 Three point bending test [2]
1.2.4. Other purposes to perform uniaxial tests
The previously presented conventional tests were also used by different researchers in order to characterize the effect of the strain rate and temperature on the behavior of the composite. Hsiao and Daniel [10] studied the effect of strain rate on the strength and modulus of unidirectional and cross-ply carbon/epoxy composite specimens in compressive and shear tests. The results show an increase of the transverse compressive strength and modulus with the increase of the strain rate while the ultimate strain shows no strain rate effect. However, the longitudinal compressive modulus increases slightly with the increase of strain rate while the strength and ultimate strains show a significant increase up to 79% and 74%, respectively. Considering the shear test, off-axis compression tests have been made for two different angles (30° and 45°), both tests show an increase of the shear strength with the increase of the strain rate.
Gilat et al.[11] shows the effect of the variation of the strain rate on the material stiffness and strength of IM7/977-2 carbon/epoxy composite with different layups (90°, 10°, 45° and [±45°]s. Gilat used a hydraulic machine for low and moderate strain rates and a Hopkinson bar for the high strain rates. He shows that increasing the strain rate leads to a stiffer material, and he observed high maximum stresses (associated with deformations) at high strain rates.
8
Shokrieh and Omidi [12] studied the behavior (tensile strength, failure strain and absorbed energy) of unidirectional glass/epoxy composites under quasi-static and dynamic strain rates. In order to make the fracture in the center of the uniaxial specimen, a thickness reduction was made by gluing woven glass/epoxy tabs on the extremities. It was shown that the longitudinal lamina properties increase with the increase of the strain rate. According to his experimental results, the tensile strength, tensile modulus, strain to failure and absorbed failure energy increase with of 52%, 12%, 10% and 53%, respectively. A visual inspection of the failed specimens shows that the strain rate has an effect on the failure modes of the composite where a high strain rate test causes a failure through the whole gage section while at low strain rates, the failure was in a small portion of the surface (Figure 1.4). Also, Shokrieh and Omidi [13] made a study on the mechanical shear properties of glass/epoxy composites by performing off-axis uniaxial tensile tests on ±45° laminates. The stress-strain data obtained in the off-axis are transformed to the on-axis coordinate system using transformation equations. The results show an increase of the shear strength of approximately 37% with the increase of the strain rate (from quasi-static to dynamic shear test). While, the shear modulus and shear strain at failure decrease with the increase of the strain rate.
Figure 1.4 Shokrieh failed specimens under different tensile rates: (a) 0.0017 s-1, (b) 0.55 s-1, (c) 5.6 s -1, (d) 46 s-1 and (e) 85 s-1[12]
1.3. Biaxial testing methods
In real life, composite materials are often subjected to complex loadings in which two or three-dimensional stress state exists. For an efficient design of composites, tests must represent these real loading conditions. The goals behind performing biaxial test will be presented briefly based on the literature. The first purpose of biaxial testing is to determine the ultimate stresses of the material which represent the stresses experienced during actual service conditions. The ultimate stresses obtained will generate the biaxial failure envelop of
9
the material which is important to validate and clarify the precision of some failure theories
[14]. However, the biaxial tests are not only used to validate failure criterion, another purpose to apply biaxial tests is the study of crack. Rashedi et al. [15] studied the notch sensitivity on cross-ply GFRP laminates. Also, biaxial testing is an interesting way to identify the material properties (Young modulus, shear modulus, Poisson ratios …) by performing a single test instead of multiple uniaxial tests [16]. Moreover, Fuji and Lin [17] studied the fatigue behavior of plain woven glass composite subjected to biaxial tension/torsion loading for different biaxial stress state.
1.3.1. Biaxial testing techniques
In the literature, different biaxial tests have been developed in order to study the behavior of metals and composites. Researchers had shown different ways to introduce a biaxial stress state in the material ([18], [19]). It can be divided into two main categories: i) the first one is by directly introducing the biaxial stress state using independent loading systems (e.g. combined axial loading with torsion or pressure on tubular specimens, tests on cruciform specimens using independent actuators), and ii) the second one is by generating a biaxial stress in a non-direct way using a specific geometry or special fixture (e.g. Iosipescu test, bluge test, off-axis tests) [20]. In this section, different biaxial testing methods will be presented and discussed separately.
1.3.1.1 Biaxial flexure testing of plate
A circular or rectangular specimen is held on his edge and loaded at the center by an indenter which is a circular bar. The biaxial stress state is generated but it’s not uniform and makes the interpretation of the stress results complicated [21]. Zhang and Gibson [22] used an elliptical loading ring instead of the central pin loading leading to a homogeneous stress state. The stress calculation and the biaxial failure remains an issue (Figure 1.5-a).
1.3.1.2 Bulge test
It consists of deforming plates ([23], [24]) using hydraulic pressure. This test has an advantage over flexure testing since it eliminates the friction between the indenter and the tested plate. However, it contains different disadvantages such as only tension-tension can be investigated, only thin specimens can be used to avoid the through thickness stresses due to gripping, and non-homogeneous stress fields are obtained (Figure 1.5-b).
10 1.3.1.3 The off-axis method
Where a single uniaxial test is performed on a composite specimen rotated with a specific angle to create a biaxial stress state. A problem of bending or shear could occur in this test due to the fixed clamps. This method is generally used for the unidirectional composite laminates and it has limited biaxial stress state (Figure 1.5-c) [18].
1.3.1.4 The Iosipescu test
It is frequently used for shear testing of materials. It was initially suggested for metallic materials and then adopted to composite materials by Adams and Walrath [7]. Loading the unidirectional composite specimen along the 0° represents a pure shear but loading it at other angles between ±45° introduces a biaxial stress state. Pierron [25] showed that the interpretation of failure in term of shear strength is erroneous since the stress distribution is not homogeneous and failure occurs at the notch tip (Figure 1.5-d).
1.3.1.5 Biaxial bending moments on flat specimen
By applying a three-point bending test on a parallelepiped bar, a biaxial stress state is introduced in the specimen. This method is still limited to test metals and unidirectional composites and the stress generated is heterogeneous (Figure 1.5-e) ([26], [27]).
1.3.1.6 Combined axial loading with simple torsion on tubular specimen
This method has been used to investigate the biaxial behavior of metals in 1940’s and then composites in 1960’s. The biaxial state is created by rotating the principal directions 45° with respect to the cylinder axis, two perpendicular normal stresses in the principal directions exist. Biaxial extensometer is used to measure the axial and rotary displacements during the test (Figure 1.5-f) ([28], [29]).
1.3.1.7 Combined axial loading with internal pressure on tubular specimen
Most of researchers switched from axial/torsion to axial/internal pressure because of the limited amount of biaxial ratio in the first one. Tubular form avoids the edge effect which was a problem in the coupon specimens ([30], [31]). However, tubular specimens have drawbacks such as stress concentration near the end of the grips and premature failure occurs there. Also in compression tests, buckling occurs in thin walled tubes. Increasing the thickness of these tubes would solve the problem of buckling but makes it difficult to determine the stresses in the specimen because of the generation of radial stresses (through thickness caused by internal/external pressure) (Figure 1.5-g).
11
1.3.1.8 In-plane biaxial loading on flat cruciform specimen
This method consists of applying two in-plane perpendicular loads on the specimen to create a biaxial stress state (Figure 1.5-h). This method was used first time in 1960’s to study the biaxial behavior of metals [32] and started on composites in 1980’s. First in-plane biaxial tests were performed on rectangular specimens. The shape was quickly changed to cruciform to avoid stress concentration near the grips and lead to a failure in the center. The biaxial stress state is directly controlled by the machine. The drawback of this method is the design of the specimen which requires a stress concentration in the biaxially loaded central zone of the specimen. Moreover, this method requires specific equipment that does not exist in every lab [33].
Figure 1.5 Biaxial testing techniques: (a) Biaxial flexure testing of plate [21], (b) Bulge test [24], (c) off-axis test [2], (d) Iosipescu test [34], (e) Biaxial bending moment on flat specimens [27], (f) axial/
torsion of tubes [35], (g) axial/pressure of tubes [36], and (h) cruciform specimen [37]
1.3.2. Choice of an adapted biaxial testing technique
According to the previously mentioned biaxial testing methods, problems such as stress heterogeneity, limitation of the biaxial test on specific composite layups (unidirectional) and on specific biaxial stress ratio are shown.
In order to select the appropriate biaxial method some requirements must be taken into account:
1- Failure must occur in the biaxial zone.
12
3- Test must cover a wide range of stress state in order to obtain the complete failure envelope.
The only two methods that fulfill the requirements are tests on tubular specimens and test on cruciform specimens. Different researchers show that the biaxial test on tubular specimens produces a dominant effect of through thickness stresses which limits the characterization of composite materials for tubular applications (e.g. pipes, vessels...) ([38], [39]). However, since most of the engineering applications require the use of flat composites (e.g. aeronautics, automotive…), the in-plane biaxial test is a well-adapted characterization method. Another advantage of the in-plane biaxial test is the simplicity of varying the biaxial stress ratio in the tested material according to the well-controlled displacements imposed on the two axes of the cruciform specimen.
As conclusion, different biaxial test techniques exist in order to study the behavior of materials. Regardless the design problem of cruciform specimen, the in-plane biaxial test is one of the most appropriate method.
1.3.3. Biaxial testing machines on cruciform specimens
The in-plane biaxial testing machines can be classified into three categories: (i) machines with one actuator, (ii) machine with two actuators, and (iii) machine with four actuators. The machines with one actuator are developed in a way that introducing a single loading leads to a biaxial stress state in the cruciform specimen. This type of machines needs a very specific fixture. Bhatnagar et al. [40] developed a biaxial testing fixture using a single loading actuator for polymer materials (Figure 1.6). The mechanical configuration of the machine allows a single load cell to introduce different biaxial testing ratios in order to generate any combination of σ1 – σ2 stress space. The goal behind using a single loading actuator is the low cost compared to the multi-actuator machines. An experimental validation was made using the machine on a short fiber polyamide and nanoparticle-reinforced PP thermoplastic composites.
13
The machine with two actuators was developed by introducing another loading actuator perpendicular to the one of a uniaxial test bench. The development of this machine was in order to vary the biaxial stress ratio without having a special equipment. The biaxial stress state was generated by fixing one side of the perpendicular arms and making the traction from the other side. However, the problem of this kind of machines was the bending of the specimen which gives undesirable stress state. In 2000, Hoferlin et al. [41] made a biaxial testing machine from a uniaxial machine (Figure 1.7-a) with a capacity of 250 kN by adding a removable hydraulic actuator having a capacity of 25 kN. The machine was tested on steel cruciform specimen. Moreover, Lin and Ding [42] also added a manual actuator to a uniaxial instron machine in order to study the plastic yielding of aluminum metals under biaxial test. Lin and Ding mentioned in their study that the specimen bending can be accommodated vertically using the springs shown in Figure 1.7-b while the horizontal movement isn’t accommodated.
Figure 1.7 Biaxial testing machines with two actuators developed by: (a) Hoferlin [41] and (b) Lin [42]
In order to have more reliable tests (avoid bending problems), the biaxial testing machine with four hydraulic actuators was built. These machines usually contain a closed-loop control system to balance the loads in the four arms and adjust the specimen in the center during the test. Two types of machine frames were built in the literature, machines with horizontal frames and machines with vertical frames. Makinde et al. [43] built a biaxial testing machine with a horizontal frame. To ensure a maximum rigidity of the proposed frame, a 152 mm thick cross-shaped steel slab was welded to an I-beam structure. The benefit of using a machine with a vertical frame is the ease of inspection of both sides of the specimen.
Most of the researchers used machines with horizontal frame. Green et al. [44] used the machine developed by Makinde (Figure 1.8) for the characterization of aluminum alloy AA1145, the machine capacity is 250 kN in each loading arm. Gower and Shaw [45] used a biaxial testing machine with a capacity of 50 kN for the characterization of carbon fiber-reinforced plastic laminates under tension/tension loading. Some researchers used the triaxial
14
testing machine for the biaxial characterization tests. The triaxial testing machine (used by Welsh et al.[46]–[49]), as shown in Figure 1.9, has a capacity of 94 kN in each loading arm, it can generates any combination of tension or compression stresses in σ1 – σ2 – σ3 stress space. Another triaxial testing machine was developed by a collaboration between Schenk and LMT Cachan in France, the machine is composed of six hydraulic actuators where the in-plane machine capacity is a 100 kN (tension or compression) while the out-of-in-plane loading can reach 250 kN [50].
Figure 1.8 Biaxial testing machines with four actuators developed by: (a) Makinde/Green [44] and (b) Gower [45]
Figure 1.9 Tri-axial testing machines developed by: (a) Welsh [46] and (b) ASTREE [50]
1.4. In-plane biaxial test on cruciform specimens
1.4.1. Metal cruciform specimen
Considering biaxial tests on metals, different cruciform specimens were proposed by several researchers. Depending on the mechanical behavior to be identified (fatigue strength, forming or rupture limits, hardening law, yield surface …), several flat specimen shapes have been proposed during the last years ([51]–[53]). Hannon and Tiernan [54] presented two main requirements for the design of the cruciform metal specimen for the characterization test: homogeneous stress/strain distribution which allows the stress calculation and yield should
15
occurs in the central zone of the specimen. To avoid the premature failure in the arms and reduce the effect of shear stresses, three methods were used in the design of the specimen [55]: (i) making a curved fillet between the loaded arms, (ii) reducing the thickness of the central zone, (iii) adding slits in the arms (Figure 1.10). Specimen could also have a combination of these methods as shown in Figure 1.11 (combination of slits and thickness reduction). In 1993, Demmerle and Boehler [56] has optimized the cruciform shape in order to achieve more homogeneous stress and strain fields in the central zone of an anisotropic specimen. The optimization procedure was taken by defining a cost function C that should be minimal. Twelve parameters (representing the dimensions of the cruciform specimen) were used as input in the optimization process. Optimization process should be repeated if the thickness or the material parameters change.
Figure 1.10 Methods used in the design of cruciform specimen [55]
Figure 1.11 Cruciform specimen proposed by Hayhurst [57]
Dawicke and Pollock [58] proposed a variation of the cruciform specimen for the characterization of the behavior of 2219-T87 aluminum alloy. The proposed specimen is composed of series of the thickness reduction towards the central zone. The arms was the
16
thickest at 0.25 inch. The first thickness reduction is in a square form (0.125 inch thick). The second thickness reduction is in a circular form leading to a 0.8 inch thick central zone (Figure 1.12). Johnston et al. [59] used the same specimen to study the behavior of 2195 aluminum lithium alloy. The stresses and forces at the elastic limit were obtained on this type of specimens. The strain distribution has been measured by gluing 52 strain gages in the central zone.
Recently, Xiao et al. [37] defined a cruciform specimen without slits in the arms in order to obtain the forming limit diagram of TA1 titanium alloy under different thermal conditions (Figure 1.13). The specimen has a convex corner fillet between the arms and a thickness reduction in the central zone. The thickness reduction was made from only one side of the specimen. It was shown that at high temperatures, the limit strains were affected by the orientation of the load with respect to the rolling direction.
Figure 1.12 Specimen with two thickness reductions [59]
Figure 1.13 Cruciform specimen without slits [37]
More, Yu et al. [60] developed a new specimen form in order to determine the forming limit curve under different linear and non-linear strain paths. The optimized form has also two
17
thickness reductions (Figure 1.14-a). The study was based only on finite element method without performing an experimental validation. Zhang and Sakane [61] presented another specimen (Figure 1.14-b) with two thickness reductions in order to study the creep-fatigue damage and life of type 304 stainless steel under low strain levels.
Figure 1.14 Cruciform proposed by (a) Yu [60] and (b) Zhang [61]
Furthermore, an optimal cruciform specimen of Aluminum alloy AA5086 was numerically proposed by Zidane et al. [52] in 2010 (Figure 1.15). The proposed specimen has slits in each arm and a radial transition between arms to reduce the load sharing between them. Also, slits can reduce the influence of the arm size on the uniformity of stress in the central zone. Note that, they reduced the cross section area of the arms which lead to a stress concentration at the tip of slits. Since stress concentration would be in the slits, failure would occur in the arms and not in the central zone if only slits exist. In order to solve this problem, the central zone has a reduced thickness with a circular form. The reduction of thickness was made with a radial transition. A comparison between the experimental biaxial test and the conventional Marciniak test was made and good agreement is observed between the two forming limit curves obtained.
18
Liu et al. [53] studied the hardening behavior of metallic sheets under large strains. An optimization of the specimen has been proposed. The specimen, as shown in Figure 1.16, has a thickness reduction in the central area with slots in each arm and a notch between two arms (since notches are more efficient than radii). An inverse method was applied to determine the material constants for the hardening law. A comparison was made between the three yield criteria: (i) isotropic Mises, (ii) anisotropic Hill48 and (iii) Bron and Besson. A modified Voce’s hardening law is identified with these three yield criterions. Bron and Besson is the criterion that gives the best agreement between the experimental and the numerical strain at the central point of the specimen.
Figure 1.16 Liu optimal specimen
Liu et al. [62] also shows the influence of the strain rate on the mechanical behavior of the dual phase high strength steel specimen (DP600). A formulation taking into account the strain rate dependency on the initial yield stress and strain hardening of the material is established.
1.4.2. Composite cruciform specimen
The previous literature review on cruciform metal specimens shows that it is not straightforward to define an appropriated cross specimen shape. For composite materials, the study is even harder because of the different stress states which develop in each lamina, leading to a difficult understanding of the specimen behavior. Unlike the metals, composites are sensitive to stress concentrations even for very low strain level. So, particular attention must be taken when designing a composite specimen to limit the stress/strain concentrations. The slits in cruciform specimens arms are used in order to obtain a uniform stress field in the central zone of the specimen [44]. In composite materials, a high stress concentration would occur at the slits because of their sensitivity to milling process. However, some authors use slits in composite cruciform. For example, Youssef [63] used slits to achieve a more uniform stress field and to eliminate the coupling effect between arms on cross-ply carbon/epoxy
19
specimen under biaxial loading (Figure 1.17-a). In 2000, Ohtake et al. [64] also used slits on cross-ply fiber reinforced carbon cruciform specimen under biaxial tensile test in order to investigate the biaxial deformation behavior at high temperature (1000 and 1700° C) (Figure 1.17-b).
Figure 1.17 Composite cruciform specimens with slits developed by: (a) Youssef [63]and (b) Ohtake [64]
The effectiveness of a successful biaxial test is related to different criteria. The most important criterion is the ability of the test to accurately determine the needed property. There is no single test method that has generally accepted by the composites community as being superior to all others. Some indications of a successful test are noted:
a- The specimen gage section must be in a uniform stress state as far as possible. b- Failure must occur in the gage section.
c- Repeatable results must be obtained.
d- Possibility of independently vary the biaxial stress components in order to generate a complete biaxial failure envelop.
Similar to metals, another way, to improve the results and to obtain the failure in the central zone, is to reduce its thickness and to use a curved fillet corner between the arms to avoid load sharing. In the literature, a strong challenge was encountered in the thickness reduction of the composite because of the sensitivity of the fibers to the machining effects. Some authors suggested to reduce the thickness of the central zone by sandwiching different composite plates with holes in the center on both sides of the studied composite in order to have a low central zone thickness [65]. Other researchers reduced the composite thickness by milling a number of plies from both sides of the specimen using a CNC machine [47]. Both methods, sandwiching and milling, will be presented in this section. Moreover, comparison between the failures results using both thickness reduction methods will be also discussed [66].
20 1.4.2.1 Sandwiching method
The sandwiching method was successfully tested on large thick specimens which requires high loading capacity machines. Using this concept, Hopgood et al.[67] obtained the failure envelope of open-holes carbon fiber reinforced epoxy by performing biaxial tests (machine capacity of 500 kN). The specimen was made of 2 mm thick carbon/epoxy composite sandwiched between two layers of glass/epoxy composite (Figure 1.18-a). Williamson et al. [65] also studied the biaxial failure of open-hole carbon/epoxy cruciform specimen using the same specimen developed by Hopgood. The specimen was tested under different biaxial tension and compression ratios in order to cover the whole failure envelop of the material. The specimen thickness reduction was also made by adding two layers of 4 mm thick quasi-isotropic glass/epoxy composite on both sides of the carbon composite (Figure 1.18-b). In this study, different hole diameters, specimen thickness and layup orientation were investigated. The biaxial testing machine used in this study has a capacity of 1500 kN. The maximum load reached was 1124 kN for a 10 mm thick carbon specimen with a 6 mm hole diameter. Kumazawa and Takatoya [68] studied the biaxial strength of a cruciform specimen with a rounded central zone (designed by Susuki [69]). The specimen has a smooth transition from arms to central zone (Figure 1.18-c). Glass fiber reinforced epoxy tabs were glued on both sides of the quasi-isotropic carbon/epoxy laminates under biaxial tension/tension and tension/compression tests. The thickness of the CFRP is 1 mm. A maximum load, around 140 kN, is obtained for the equibiaxial tensile test. The authors mentioned that the failure occurs in the center of the specimen and damage was developed towards the GFRP tabs (Figure 1.19).
Figure 1.18 Cruciform specimen presented by: (a) Hopgood [67], (b) Williamson [65], and (c) Kumazawa [68]