HAL Id: tel-03193289
https://tel.archives-ouvertes.fr/tel-03193289
Submitted on 8 Apr 2021
HAL is a multi-disciplinary open access archive for the deposit and dissemination of sci-entific research documents, whether they are pub-lished or not. The documents may come from teaching and research institutions in France or abroad, or from public or private research centers.
L’archive ouverte pluridisciplinaire HAL, est destinée au dépôt et à la diffusion de documents scientifiques de niveau recherche, publiés ou non, émanant des établissements d’enseignement et de recherche français ou étrangers, des laboratoires publics ou privés.
Essays on Financial Analysts
Hiep Manh Nguyen
To cite this version:
Hiep Manh Nguyen. Essays on Financial Analysts. Sociology. Université Panthéon-Sorbonne - Paris I, 2020. English. �NNT : 2020PA01E004�. �tel-03193289�
ECOLE DOCTORALE DE MANAGEMENT PANTHÉON -SORBONNE n°559
ESSAYS ON FINANCIAL ANALYSTS
ESSAIS SUR LES ANALYSTES FINANCIERS
Thèse de Doctorat présentée en vue de l’obtention du grade de docteur en sciences de gestion
par
« Hiep Manh NGUYEN »
dirigée par
Michael TROEGE, Professeur, ESCP Business School Soutenance le 10 juillet 2020
Devant un jury composé de :
Rapporteurs : M. Edith GINGLINGER
Professeur, Université Paris Dauphine - PSL M. Anne-Gaël VAUBOURG
Professeur, Université de Poitiers Suffragants : M. Alberta DI GIULI
Professeur, ESCP Business School M. Joël METAIS
Professeur émérite, Université Paris Dauphine - PSL
Ce travail a bénéficié d'une aide du ministère de l'Éducation et de la Formation du Vietnam et d'une aide de l’Etat Francais gérée par l'Agence Nationale de la recherche au titre du projet Investissements d'Avenir Paris Nouveaux Mondes portant la référence n° ANR-11-IDEX-0006-02. Il a été réalisé dans le cadre du
L’Université n’entend donner aucune approbation ou improbation aux opinions émises dans les thèses. Ces opinions doivent être considérées comme propres à leurs auteurs.
ECOLE DOCTORALE DE MANAGEMENT PANTHÉON -SORBONNE n°559
ECOLE DOCTORALE DE MANAGEMENT PANTHÉON -SORBONNE n°559
Acknowledgements
My doctoral study would not have been possible without the generous scholarships from the Ministry of Education and Training of Vietnam and the Laboratoire d'excellence en régulation financière (LabEx-ReFi), to whom I can only pay my deepest appreciation. I also extend my sincere thanks to the Consulat Général de France au Vietnam, Campus France and other French government agencies, including CROUS, CAF, SMEREP and CPAM, for their aid during my stay in Paris.
I would like to thank the people of ESCP Business School Doctoral Program and the Department of Finance for having assisted me through these years. I would like to especially thank Ms. Christine Rocque for her doing an excellent job and Prof. Claire Dambrin for relentless attentiveness to all doctoral students and to me in particular. I would like to thank Prof. Christophe Moussu, Prof. Alberta Di Giuli and Prof. Joel Metais for their continuous encouragement. My dissertation has also benefited from invaluable comments and suggestions from Prof. Edith Ginglinger and Prof. Anne-Gael Vaubourg, as well as other professors and friends at ESCP Business School.
I would like to thank my friends Nicolas Taillet, Giang Phung, Henry Gonzalez, Laura Litre Valentin, Giovanni Visentin, Dejan Glavas, Chang Gong, Sophie Gourevitch, for all the talks and care, which have given me much comfort in a land far from home.
I would like to thank my friends Alexei Kapychev and the international students at Campus France for the unforgettable days we were together.
I would like to thank Dr. Nguyen Thu Hang and other colleagues at Foreign Trade University. Dr. Hang led me into academia, my colleagues made me feel belonged.
Lastly, I would like to thank my supervisor, Prof. Michael Troege, who has spent countless hours taking care of me not only in research, but also in physical and mental well-being. After my doctoral study, I hope he will give me countless hours more, because I am sure there are much more I can learn from his creativeness, perseverance, perfectionism, and kindness.
ECOLE DOCTORALE DE MANAGEMENT PANTHÉON -SORBONNE n°559
ESSAIS SUR LES ANALYSTES FINANCIERS
Résumé général
Les analystes financiers jouent un rôle important dans les marchés financiers. Grâce à la publication de rapports d’analyse, ils facilitent l’incorporation d’informations privées coûteuses dans les prix des titres, favorisant l’efficacité informationnelle des marchés financiers. Ainsi, la compréhension du comportement des analystes a des implications importantes pour les entreprises, les investisseurs et les regulatuers. Malgré des décennies de recherche sur ce sujet, il reste de nombreuses questions ouvertes concernant les renseignements produits par les analystes financiers et la façon dont ces rapports sont influencés par leur environnement de travail.
Dans cette thèse, nous tentons de contribuer à la littérature sur le comportement des analystes et ses effets sur les marchés financiers en abordant plusieurs nouvelles questions de recherche. Les deux premiers articles de cette thèse tentent de mieux comprendre les incitations derrière le biais bien connu des analystes et d'identifier de nouvelles sources de biais. Le troisième article analyse la gouvernance d'entreprise et le rôle des analystes financiers dans la réduction de l'asymétrie d'information.
Le premier article compare le comportement des analystes employés par des banques émettant de la dette avec celui des analystes employés par des banques émettant des actions. Nous nous concentrons sur les différences dans les prix cibles et les recommandations, et nous démontrons que les analystes embauchés par les banques émettrices d’actions sont nettement plus optimistes que les analystes affiliés à des banques souscrivant de la dette. Il est usuellement admis dans la littérature que les analystes sont plus optimistes pour entretenir des relations commerciales avec les entreprises suivies. Notre résultat n’est pas compatible avec cette hypothèse et jette un nouvel éclairage sur les différents conflits d'intérêts qui influencent le comportement des analystes boursiers.
Dans le deuxième article, nous montrons que les analystes dont les employeurs détiennent une participation dans les entreprises suivies émettent des prix cibles et des recommandations beaucoup plus optimistes. Les mises à jour de leurs recommandations génèrent une réaction plus faible du cours de l’action comparées à celles de leurs pairs. La différence d'optimisme entre les analystes propriétaires et non-propriétaires est encore plus grande en période de repli du marché. Ces
ECOLE DOCTORALE DE MANAGEMENT PANTHÉON -SORBONNE n°559
résultats mettent en évidence les conflits d’intérêts inhérents aux analystes dont les employeurs détiennent les actions dans les entreprises suivies.
Le troisième article examine de plus près la qualité de la gouvernance d'entreprise et l'effet médiateur du travail des analystes. Nous montrons qu'une rémunération excessive des administrateurs externes est associée à une tendance à ne pas divulguer des informations négatives ce qui créé au final un risque de chute important du cours de l’action. Cette relation est surtout présente pour des directeurs dont la rémunération est indexée sur la valeur de l’action, mais n’est pas présente pour des directeurs dont la rémunération est fixe. Ces résultats permettent d’émettre des doutes sur l’efficacité de la rémunération indexée sur la valeur de l’action qui ne permet pas d’aligner les incitations des administrateurs sur celles des actionnaires. De plus, nous constatons que les entreprises suivies par plus d'analystes ont un risque plus faible de chute des cours de l’action associé à la non-divulgation des mauvaises nouvelles.
ECOLE DOCTORALE DE MANAGEMENT PANTHÉON -SORBONNE n°559
ESSAYS ON FINANCIAL ANALYSTS
General abstract
Financial analysts play an important role in capital markets. Through the issuance of analysis reports, they facilitate the incorporation of costly private information into security prices, supporting the informational efficiency of financial markets. Thus, understanding their behavior has important implications for firms, investors, and policy makers. Despite decades of work, there are still many open questions regarding how financial analysts produce and how these reports are influenced by their working environment.
In this dissertation, we attempt at contributing to the literature of analyst behavior and its effects on the capital market by addressing several new research questions. The first two papers of this thesis try to better understand the incentives behind the well-known analyst bias and identify new soucres of bias. The third paper extends into an analysis of corporate governance and the role of financial analysts in alleviating information asymmetry.
The first paper compares analysts affiliated with debt underwriters to analysts affiliated with equity underwriters. We focus on the differences in target prices and recommendations and demonstrate that while equity underwriter analysts are significantly more optimistic in their target prices and recommendations, analysts affiliated with debt underwriters do not exhibit the same bias. While the prominent view in the literature is that equity underwriter analysts are more optimistic to nurture business relationships with the followed firms, the finding that analysts affiliated with debt underwriters behave differently is not consistent with this hypothesis and sheds new light on the different conflicts of interest that influence stock analysts' reporting behavior.
In the second paper, we show that analysts whose employers own a stake in the followed firms issue significantly more optimistic target prices and recommendations. Their recommendation upgrades underperform those of their peers by 0.8% in a two-month window. The difference in optimism between owner and non-owner analysts are even larger in the times of market downturn. These results highlight the conflicts of interest inherent in the analysts whose employers own the followed firms’ stocks.
ECOLE DOCTORALE DE MANAGEMENT PANTHÉON -SORBONNE n°559
The third paper looks more closely at the quality of corporate governance and the mediating effect of analyst coverage. We show that excessive compensation of outside directors is associated with bad-news hoarding and stock price crash risk. This relationship is largely attributed to excessive stock-based compensation, but not cash compensation. These findings cast doubts on the effectiveness of stock-based compensation in aligning the incentives of directors with shareholders' interest. In addition, we find that firms followed by more analysts have lower risk of stock price crashes associated with bad-news hoarding.
Contents
1 Introduction ... 1
1.1 The role of stock analysts in the capital market ... 1
1.2 Stock analyst conflicts of interest ... 3
1.3 Corporate governance and analyst forecast errors ... 6
1.4 An overview of stock analysts during the past two decades ... 7
1.5 The chapters of this dissertation ... 13
References ... 14
2 Why are analysts optimistic? ... 16
2.1 Introduction ... 17
2.2 Literature review and hypothesis development ... 20
2.3 Data and variable construction ... 22
Data ... 22 Dependent variables ... 26 Independent variables ... 28 2.4 Results ... 30 Summary statistics ... 30 Recommendation optimism ... 34
Target price accuracy and optimism ... 36
Earnings forecast accuracy ... 38
Matched samples ... 43
2.5 Conclusion ... 46
References ... 47
3 Stock analysts' behavior when their employers own shares in the covered firms ... 51
3.1 Introduction ... 52
3.2 Literature review and hypotheses ... 56
3.3 Data and variable construction ... 59
Data ... 59
Variables ... 63
3.4 Results ... 68
Summary statistics ... 68
Owner analysts' recommendation optimism ... 70
Owner analysts' target price forecast accuracy and optimism ... 72
Owner analysts' earnings forecast accuracy and optimism ... 74
Market reactions to owner analysts' recommendation changes ... 78
Analyst forecast and the crises ... 81
Propensity score matching ... 82
3.5 Conclusion ... 83
References ... 84
Appendix: Names of 13F owners supposed to be Citigroup's subsidiaries ... 87
4.1 Introduction ... 91
4.2 Literature review and hypotheses ... 93
Director compensation ... 93
Corporate governance, board of directors and stock price crash risk ... 95
Analyst coverage and information discovery ... 96
4.3 Data and variable construction ... 97
Price crash ... 98
Excess director compensation ... 98
Control variables ... 99
Descriptive statistics ... 101
4.4 Results ... 106
Excess director compensation, price crash risk, and bad-news hoarding ... 106
Director cash compensation versus stock-based compensation ... 108
Bad-news hoarding ... 110
Bad-news hoarding and analyst coverage ... 111
4.5 Conclusion ... 114
References ... 118
1
1
Introduction
1.1 The role of stock analysts in the capital
market
Without information about firms and their projects, financial markets cannot efficiently carry out their function of allocating capital. Some information is freely available to investors, but most information is costly and needs to be generated by well-trained specialists. The profession of financial analysts has evolved to carry out this economic function and provide investors with detailed and specialized public information that would otherwise be very hard to come by. Financial analysts have the necessary combination of technical expertise, industry knowledge and financial acumen that is required to understand the future prospects of companies. They assimilate their hard-earned private information by publishing analyst reports and hence drive stock prices closer to intrinsic values, making the market more informationally efficient and channeling capital flows into promising investments.
Traditionally, analyst reports contain three separate pieces of information : 1) earnings forecasts, 2) price forecasts, and 3) buy, hold, or sell recommendations. We know that these forecasts and recommendations disseminate private information or create new information from public information; because a change in the three types of information has significant impact on the market prices of stocks. Prior research has found that recommendation revisions (Chang and Chan, 2008) and forecast revisions (Park and Stice, 2000, Abarbanell et al., 1995, Gleason and Lee, 2003) trigger investor responses, confirming the informativeness of analyst reports. Specifically, recommendation downgrades and forecast negative revisions are considered as conveying bad information, whereas,
2
recommendation upgrades and forecast positive revisions are considered as conveying good information.
Figure 1: Analysts' reporting environment, adopted and modified from Ramnath et al.
(2008).
Figure 1 illustrates the reporting environment surrounding stock analysts. Their input is information from either public or non-public sources. Through the decision processes, assisted and/or constrained by their expertise, incentives, and regulatory or
Analyst and market inefficiency Analysts Analyst Report - Description of the firm's prospect - Earnings forecasts - Price forecasts - Recommendations Information - Macro - Industry - Firm-specific - Private Regulatory/ Institutional factors Analysts' incentives Decision processes Expertise Stock price response Predictable future price changes Predictable forecast error
3
institutional factors, analysts produce the reports, whose content provides new information to the market and creates stock price movements. Given the important role of stock analysts in the capital market, the properties of their reports have attracted extensive research interest in the last decades. Ramnath et al. (2008) provide a taxonomy of this body of research with seven categories: (1) analyst decision processes, (2) analyst expertise, (3) information content of analyst reports, (4) analyst and market inefficiency, (5) analysts' incentives, (6) regulatory or institutional factors, and (7) research design issues.
This dissertation contributes to the stock analyst literature with several new insights. The first two chapters present studies about how analysts' incentives can distort their forecasts and recommendations. The third chapter explores how analysts assist investors when corporate governance is weak and information asymmetry is high.
This introduction is organized as follows. Section 1.2. provides a literature review on analysts' incentives. Section 1.3 reviews prior studies on the relationship between corporate governance and analyst forecast errors. Section 1.4 introduces the evolution of analyst forecasts during the research period. Section 1.5 briefly discusses the research questions and key findings of the three papers comprising this dissertation.
1.2 Stock analyst conflicts of interest
Stock analysts owe fiduciary duties to the users of their reports and this requires them to be objective in their analysis. Analysts may make errors in their calculations and judgements, but these errors must not be a result of economic incentives. However, as utility-maximizing economic agents, they suffer from various conflicts of interests, which introduce biases in their reports and potentially harm the interest of the reports’ users. Understanding these conflicts of interest is vital for policy makers to build a sound and
well-4
functioning market1, for investors to make resource-allocating decisions, and for companies to be able to efficiently communicate with policy makers and investors through stock analysts.
Potential economic incentives that may influence stock analyst behavior come from the analyst himself, from his employer and the employer' customers, and management of the followed firm. Key questions are whether these economic incentives systematically affect the analysts' coverage decisions, effort, optimism, etc., and how the market perceives these incentives and reacts to the analyst reports.
Career prospects, reputation and financial benefits are the major personal concerns of financial analysts when issuing stock reports. Hong and Kubik (2003) demonstrate that brokerage houses reward optimistic analysts with more favorable career outcomes, especially those who cover firms with which they have underwriting relationships. A part of analyst optimism also comes from their selective coverage of stocks about which they have favorable expectations and opinions (McNichols and O'Brien, 1997, Das et al., 2006). Raedy et al. (2006a) argue that, as analyst reputation suffers from an asymmetric loss function of future revisions, analysts tend to underreact to earnings information. Chan et al. (2018) find that analysts issue more optimistic target prices for the stocks they own. Breton et al. (2017) show that a close relationship between the firm and the analyst tends to negatively affect forecast accuracy.
1 Governments around the world has tried to address these conflicts of interest and strengthen investor
protection, notably in the US and EU. For example, in 2007, France implemented new rules to unbundle brokerage commission and research fees. Galanti and Vaubourg (2017) find that these rules reduced analyst optimism. Most recently, effective from Jan 3, 2018, the EU's MiFID II regulations require separate pricing between investment research and executive services. In the US, FINRA 2241 rules that the analysts must be "insulated from the review, pressure or oversight by persons engaged in investment banking services activities or other persons, including sales and trading personnel".
5
In addition, brokerage houses may pressure their analysts to issue biased forecasts to solicit or maintain business relationships. Notably, analysts affiliated with underwriters are more optimistic than non-affiliated analysts (Lin and McNichols, 1998, Dugar and Nathan, 1995). Cowen et al. (2006) show that analysts are more optimistic in their forecasts and recommendations in houses where research is funded by trading commission. Some studies find that analysts are optimistic about stocks in which mutual funds have taken large positions because the funds tend to allocate trading commission fees to the brokerage houses whose opinions about their assets are favorable (Gu et al., 2013, Firth et al., 2013).
Stock analysts are also influenced by the management of the followed firms. There are at least two reasons for this. First, the management of the followed firms is an important source of inputs to guarantee the quality of their reports. Brown et al. (2015) survey financial analysts and find that they value private communication with firm management even higher than their own primary research. Second, the followed firms can be current or prospective customers of the analyst' employers, or potential employers of the analyst himself. One important incentive of the firm management is to meet or beat expectations, as they are rewarded by positive earnings surprises and punished by negative earnings surprises (Matsunaga and Park, 2001, Bartov et al., 2002, Kasznik and McNichols, 2002, Skinner and Sloan, 2002). Archival data and surveys confirm that managers do care about beating analyst forecasts (Brown and Caylor, 2005, Graham et al., 2005). Richardson et al. (2004) find that analysts engage in earnings guidance where they walk-down forecasts to beatable levels in order to assist stock sales by the firms or the managers' personal accounts.
To some extent, the market appears to understand these conflicts of interest embedded in analyst reports. For example, some studies show that the market react less positively to favorable recommendations, and react more negatively to unfavorable
6
recommendations by analysts affiliated with underwriters of the followed firm (Hirst et al., 1995, Michaely et al., 1999).
1.3 Corporate governance and analyst forecast
errors
Prior literature suggests that governance issues substantially influence the accuracy of analyst forecasts. As analysts use financial statements and other firm disclosures as inputs for their reports, governance issues are of important consequence. Kanagaretnam et al. (2007) use the change in market liquidity around quarterly earnings announcements as a proxy for information asymmetry and demonstrate that firms with better quality of corporate governance have lower information asymmetry. Analysts may thus benefit from better corporate governance to produce more accurate forecasts and opinions.
Consistent with this view, Bhat et al. (2006) find that, after controlling for financial transparency, governance transparency and governance-related disclosures significantly improve the information environment and thus improve analyst forecast accuracy. Similarly, Byard et al. (2006) find that better quality of corporate governance improves the quality of financial analysts' information. Xu and Tang (2012) find that analyst forecasts for firms reporting internal control material weaknesses are more optimistically biased and less accurate.
Financial analysts are not simply affected by the informational environment, but also influence the environment. In other word, it is a two-way interaction between the analysts and the environement. Analysts are found to assist information discovery and reduce information asymmetry by either interpreting publicly available information, or disseminating private information through the publication of their research (Ivković and
7
Jegadeesh, 2004). Analysts have relevant expertise and knowledge, have private interactions with firm management, and their job requires them to follow firms closely. Previous studies found that their reports are informative and valuable, especially when information asymmetry is higher (Ayers and Freeman, 2003, Loh and Stulz, 2018, Charitou et al., 2019).
Analysts are after all agents of residual claims (shareholders and debtholders), and thus are expected to act as an extra layer of external monitors to the firms' managers. Dyck et al. (2010) show that analysts are whistle-blowers in various cases of corporate fraud. Yu (2008) finds that analyst coverage discourages firm management from manipulating earnings.
Prior studies on corporate governance and analyst forecasts, however, are much fewer than other topics of analyst literature. This provides us an opportunity to contribute with new research questions and insights.
1.4 An overview of stock analysts during the past
two decades
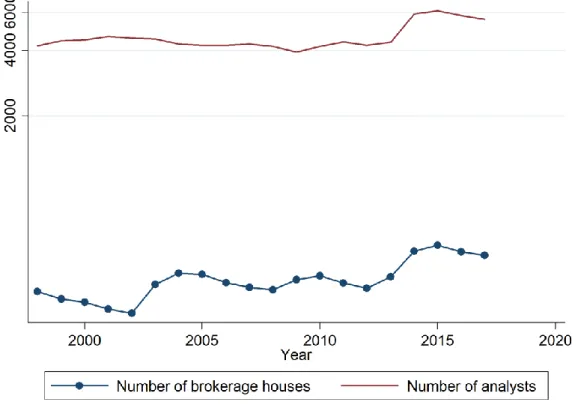
Figure 2 presents the number of brokerage houses that report to I/B/E/S. Overall, the number of brokerage houses reporting to I/B/E/S increased over time, and peaked at 507 in 2015. A small number of large houses, however, dominate the data. Specifically, the 20 largest houses account for two fifths of earnings forecasts.
Figure 2 also reports the average number of analysts per house. This number also varied substantially during this period. It increased strongly in the late 1990s and early 2000s during the dot-com bubble, but since 2002, has steeply declined to the lowest level of 55 analysts per house in 2009, right after the global financial crisis. Then, the average number of analysts per house has steadily increased to around 70 in recent years.
8
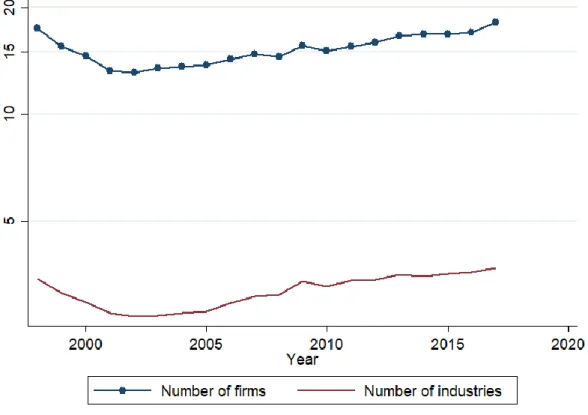
Figure 3 shows a steady increase in the average number of firms and industries covered by an analyst since 2002, suggesting improved productivity. On average in 2015, an analyst issues earnings forecasts for 17 firms in 3.5 industries. The sharp decline at the beginning of the 2000s in analyst firm and industry coverage corresponds to the contraction of the profession in the aftermath of the dot-com bubble as observed in Figure 2.
Figure 2: Number of brokerage houses and number of analysts
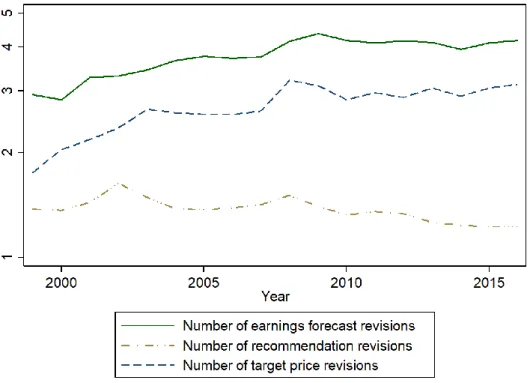
Figure 4 shows the average number of annual earnings forecast revisions, target price revisions, and recommendation revisions of an analyst for a stock. On average, the frequency of price forecasts and earnings forecasts revisions increases over the studied period. The number of earnings forecast and target price revisions appears to level out at the end of the 2000s, reaching four earnings forecast revisions and three target price revisions for a stock each year. Increased numbers of earnings forecasts and target price revisions indicate increased analyst efforts during this period. The number of recommendations,
9
however, has decreased overtime, suggesting that recommendations have become more stable than before.
Not surprisingly, the recommendations, and also to a lesser extent earnings and price forecasts, are most frequently revised in the years of financial crisis, such as 2002 and 2008, when uncertainty is high.
Figure 5 presents the evolution of average accuracy of the last annual earnings forecasts (see Chapter 2 for the definition of earnings forecast accuracy). It appears that the accuracy of earnings forecast in general has improved overtime. However, earnings forecasts at times of market turmoil are much less accurate.
10
Figure 4: Average number of earnings forecast revisions, target price revisions, and
recommendation revisions
11
Figure 6 shows the proportion of buy recommendations in the total number of recommendations issued each year. While buy recommendations comprised about 70% of all recommendations in 2000, this proportion declined strongly as the teach bubble busted and stabilized at around 40% after the Global Analyst Research Settlement was reached on April 28, 2003 (SEC, 2003). Since then, the proportion of buy recommendations have been trending up but are still far less frequent than in 2000. Recommendations also exhibit cyclical movements, as they tend to be less favorable in market downturns and more favorable in market expansions.
Figure 6: Proportion of buy recommendation in total recommendations
Figure 7 plots the 12-month target price errors by year of target price announcement. This measure of target price errors is calculated as the difference between the target price and the realized price after 12 months, divided by the realized price. Positive target price errors indicate optimism and negative errors indicate pessimism. The graph
12
reveals several interesting facts. First, over time, target price errors deviate less from zero and from the median, as indicated by the decreasing distance between the 25th and the 75th percentile. This is encouraging because it suggests that over time financial analysts have improved their accuracy, even if part of the effect might also be explained by increased herding in their forecast behavior. Second, forecast errors are much larger and optimistically biased just before market downturns in 2002 and 2008, and then become excessively pessimistic after the market has bottomed out. Almost 75% of forecasts made in 2003 and 2009 are pessimistic. This cyclical pattern of forecasts suggests that analysts are unable to predict a coming market decline or increase, but are instead lagging the market movements. Third, target price errors disperse more widely in the times of market uncertainty (2002 and 2008), as indicated by the wider distance between the 75th and the 25th percentile.
13
In summary, these figures show that analyst behavior has changed significantly in accordance with the change in their professional environment during the past 20 years. This provides an interesting context to study their behavior in more depths and generate new insights for the academic literature as well as practitioners and policy makers.
1.5 The chapters of this dissertation
Developing on the abovementioned studies, this dissertation presents three papers for a better understanding of financial analyst behavior.
Chapter Two presents the first paper, which revisits the underwriter analysts' conflicts of interest by looking at the behavior of stock analysts affiliated with debt underwriters. The prominent view in the literature is that analysts affiliated with equity underwriters are optimistic to curry business relationship with the followed firms. We show that stock analysts affiliated with debt underwriters are not as optimistic as their counterparts at equity underwriters, suggesting that business relationship is not the incentive behind optimism of equity underwriter analysts. Instead, we argue that they are optimistic due to the need to support the aftermarket performance of the stocks which their employers have underwritten.
The second paper in Chapter Three investigates the relationship between brokerage houses' equity investments and their stock analysts' forecasts and recommendations. We find that analysts whose employers own a stake in the followed firms are significantly more optimistic than their counterparts at non-owner houses.
Finally, in Chapter Four, we investigate the relationship between director compensation, stock price crash risk and analyst coverage. We find that director excessive compensation is associated with significant higher stock price crash risk caused by bad-news hoarding. Analyst coverage can help to alleviate this risk.
14
References
Abarbanell, J. S., Lanen, W. N. & Verrecchia, R. E. 1995. Analysts' forecasts as proxies for investor beliefs in empirical research. Journal of Accounting and Economics, 20, 31-60.
Ayers, B. C. & Freeman, R. N. 2003. Evidence that Analyst Following and Institutional Ownership Accelerate the Pricing of Future Earnings. Review of Accounting Studies, 8(1), 47-67. Bartov, E., Givoly, D. & Hayn, C. 2002. The rewards to meeting or beating earnings expectations.
Journal of Accounting and Economics, 33, 173-204.
Bhat, G., Hope, O.-K. & Kang, T. 2006. Does corporate governance transparency affect the accuracy of analyst forecasts? Accounting & Finance, 46, 715-732.
Breton, R., Galanti, S., Hurlin, C. & Vaubourg, A. G. 2017. La relation firme-analyste explique-t-elle les erreurs de prévision des analystes? Revue économique, 68, 1033-1062.
Brown, L. D., Call, A. C., Clement, M. B. & Sharp, N. Y. 2015. Inside the “black box” of sell-side financial analysts. Journal of Accounting Research, 53, 1-47.
Brown, L. D. & Caylor, M. L. 2005. A temporal analysis of quarterly earnings thresholds: Propensities and valuation consequences. Accounting Review, 80, 423-440.
Byard, D., Li, Y. & Weintrop, J. 2006. Corporate governance and the quality of financial analysts’ information. Journal of Accounting and Public Policy, 25, 609-625.
Chan, J., Lin, S., Yu, Y. & Zhao, W. 2018. Analysts’ stock ownership and stock recommendations.
Journal of Accounting and Economics, 66, 476-498.
Chang, Y.-H. & Chan, C.-C. 2008. Financial analysts’ stock recommendation revisions and stock price changes. Applied Financial Economics, 18, 309-325.
Charitou, A., Karamanou, I. & Lambertides, N. 2019. Analysts to the rescue? Journal of Corporate
Finance, 56, 108-128.
Cowen, A., Groysberg, B. & Healy, P. 2006. Which types of analyst firms are more optimistic?
Journal of Accounting & Economics, 41, 119-146.
Das, S., Guo, R.-J. & Zhang, H. 2006. Analysts' selective coverage and subsequent performance of newly public firms. Journal of Finance, 61, 1159-1185.
Dugar, A. & Nathan, S. 1995. The effect of investment banking relationships on financial analysts' earnings forecasts and investment recommendations. Contemporary Accounting Research, 12, 131-160.
Dyck, A., Morse, A. & Zingales, L. 2010. Who blows the whistle on corporate fraud? Journal of
Finance, 65(6), 2213-2253.
Firth, M., Lin, C., Liu, P. & Xuan, Y. 2013. The client is king: Do mutual fund relationships bias analyst recommendations? Journal of Accounting Research, 51, 165-200.
Galanti, S. & Vaubourg, A. G. 2017. Optimism bias in financial analysts' earnings forecasts: Do commissions sharing agreements reduce conflicts of interest? Economic Modelling, 67, 325-337.
Gleason, C. A. & Lee, C. M. 2003. Analyst forecast revisions and market price discovery.
Accounting Review, 78, 193-225.
Graham, J. R., Harvey, C. R. & Rajgopal, S. 2005. The economic implications of corporate financial reporting. Journal of Accounting and Economics, 40, 3-73.
15
Gu, Z., Li, Z. & Yang, Y. G. 2013. Monitors or Predators: The Influence of Institutional Investors on Sell-Side Analysts. Accounting Review, 88, 137-169.
Hirst, D. E., Koonce, L. & Simko, P. J. 1995. Investor reactions to financial analysts' research reports. Journal of Accounting Research, 33, 335-351.
Hong, H. & Kubik, J. D. 2003. Analyzing the analysts: Career concerns and biased earnings forecasts. Journal of Finance, 58, 313-351.
Ivković, Z. & Jegadeesh, N. 2004. The timing and value of forecast and recommendation revisions.
Journal of Financial Economics, 73(3), 433-463.
Kanagaretnam, K., Lobo, G. J. & Whalen, D. J. 2007. Does good corporate governance reduce information asymmetry around quarterly earnings announcements? Journal of Accounting
and Public Policy, 26, 497-522.
Kasznik, R. & Mcnichols, M. F. 2002. Does meeting earnings expectations matter? Evidence from analyst forecast revisions and share prices. Journal of Accounting Research, 40, 727-759. Lin, H.-W. & Mcnichols, M. F. 1998. Underwriting relationships, analysts' earnings forecasts and
investment recommendations. Journal of Accounting and Economics, 25, 101-127.
Loh, R. K. & Stulz, R. M. 2018. Is sell-side research more valuable in bad times? Journal of Finance, 73(3), 959-1013.
Matsunaga, S. R. & Park, C. W. 2001. The effect of missing a quarterly earnings benchmark on the ceo's annual bonus. Accounting Review, 76, 313-332.
Mcnichols, M. & O'brien, P. C. 1997. Self-selection and analyst coverage. Journal of Accounting
Research, 35, 167-199.
Michaely, R., Michaely, R., Womack, K. L. & Womack, K. L. 1999. Conflict of interest and the credibility of underwriter analyst recommendations. Review of Financial Studies, 12.
Park, C. W. & Stice, E. K. 2000. Analyst forecasting ability and the stock price reaction to forecast revisions. Review of Accounting Studies, 5, 259-272.
Raedy, J. S., Shane, P. & Yang, Y. 2006. Horizon-dependent underreaction in financial analysts' earnings forecasts. Contemporary Accounting Research, 23, 291-322.
Ramnath, S., Rock, S. & Shane, P. 2008. The financial analyst forecasting literature: A taxonomy with suggestions for further research. International Journal of Forecasting, 24, 34-75. Richardson, S., Teoh, S. H. & Wysocki, P. D. 2004. The walk-down to beatable analyst forecasts:
The role of equity issuance and insider trading incentives. Contemporary Accounting
Research, 21, 885-924.
Skinner, D. J. & Sloan, R. G. 2002. Earnings surprises, growth expectations, and stock returns or don't let an earnings torpedo sink your portfolio. Review of Accounting Studies, 7, 289-312. SEC 2003. Ten of nation's top investment firms settle enforcement actions involving conflicts of
interest between research and investment banking, available at https://www.sec.gov/news/press/2003-54.htm
Xu, L. & Tang, A. P. 2012. Internal control material weakness, analysts’ accuracy and bias, and brokerage reputation. Review of Quantitative Finance and Accounting, 39, 27-53.
Yu, F. 2008. Analyst coverage and earnings management. Journal of Financial Economics, 88(2), 245-271.
16
2
Why are analysts optimistic?
Abstract: The paper compares recommendations, target prices, and earnings forecasts of
analysts affiliated with debt underwriters to those of analysts affiliated with equity underwriters. We show that analysts affiliated with equity underwriters are optimistic in their target prices and recommendations, whereas analysts affiliated with debt underwriters do not exhibit this bias. This finding contradicts the prominent view in the literature that in order to nurture business relationships with the followed firms, analysts must be optimistic and sheds new light on the different conflicts of interest that influence stock analysts' reporting behavior.
Keywords: affiliated analysts, earnings forecast, target price, recommendation
17
2.1 Introduction
Financial analysts play an essential role in reducing information asymmetries and increasing market efficiency (Kelly and Ljungqvist, 2012, Derrien and Kecskés, 2013, Ellul and Panayides, 2018). However, the quality of their forecasts and recommendations is affected by a number of conflicts of interests, arising notably from the banking relationship between the analysts’ employer and the followed firms (Lin and McNichols, 1998, Degeorge et al., 2007, Dechow et al., 2000, Kolasinski and Kothari, 2008). Existing studies have focused on equity underwriting relationships, and either disregarded debt underwriting relationships, or treated affiliation to debt underwriters and equity underwriters homogeneously. In this paper, we aim at a better understanding of stock analysts’ conflicts of interests by comparing the behavior of stock analysts affiliated with debt underwriters to the behavior of analysts affiliated with equity underwriters.
The legal framework has recently evolved to address potential conflicts of interests arising from investment banking activities. Most notably in the US, the Sarbanes-Oxley Act of 2002 and the ensuing Global Analyst Research Settlement of 2003 as well as a series of related SEC and FINRA guidelines recognize that investment banking departments may engage in inappropriate practices that damage the objectivity of research analysts. Essentially, these rules mandate a separation between analysis activities and investment banking activities. FINRA rules also "prohibit explicit or implicit promises of favorable research", and prohibit the analysts from "participation in pitches and other solicitations of investment banking services transactions". These regulatory reforms had a positive effect on mitigating the conflicts of interest, but to a limited extent (Guan et al., 2012, Kadan et al., 2009). In particular and analysts remain very much optimistic. Thus, more research is needed to deepen the understanding of
18
the issue and help supervisory agencies in improving their oversight and regulations, fostering transparency and fairness in the financial market.
The literature cites at least three conflicts of interest that could explain why that stock analysts are systematically optimistic. First, it has been argued that optimistic stock reports help the analyst's employer to maintain or solicit cordial investment banking business relationships with the followed firms (Cowen et al., 2006, Agrawal and Chen, 2008). This is the dominant view in the literature. Second, analysts can be optimistic to secure their reputation and career prospects in the investment community (Hong and Kubik, 2003, Groysberg et al., 2011, Jackson, 2005). Third, affiliated analysts are alleged to use optimistic forecasts and recommendations to support the aftermarket performance of the financial assets that their employers have underwritten (Schultz and Zaman, 1994, Ellis et al., 2000, James and Karceski, 2006).
To test these conflicts, the literature has focused on analysts affiliated with equity underwriters, who are afflicted by all these three conflicts of interest. As these conflicts result in the same predictions of analysts' optimistic behavior, prior studies cannot distinguish between the different possible mechanisms.
This is where analysts affiliated with debt underwriters provide an interesting subject of research. Unlike their counterparts at equity underwriters, analysts affiliated with debt underwriters are not equally affected by all the three conflicts of interest. They differ in the importance of aftermarket support of the underwritten securities. The reason is simple: debt underwriters are concerned with the aftermarket of debt and not stock. Stock analysts have little influence on the value of debt, given that debt and equity values are only weakly correlated. Stock analysts working at debt underwriters will therefore be relatively impartial about stock price evolution after the offering.
19
If affiliated analysts are optimistic to curry favor with the followed firms as the prominent view in the literature posit, analysts affiliated with debt underwriters should be as over-optimistic as analysts affiliated with equity underwriters, since they have the same motivation to cultivate banking relationship. However, if affiliated analysts are optimistic in order to support aftermarket stock performance, equity underwriter analysts are much more likely to be optimistic, whereas, debt underwriter analysts have little reason to be so. Thus, by analyzing whether analysts affiliated with debt underwriters are as optimistic as analysts affiliated with equity underwriter, we can confirm which conflict of interest is the key driver behind their optimism.
Our empirical tests show that analysts affiliated with debt underwriters are significantly less optimistic in recommendations and target prices than analysts affiliated with equity underwriters. These findings are robust in our regression analysis, as well as in a propensity score matching procedure. These results do not support the prominent view in prior literature that underwriter-affiliated analysts are optimistic to generate banking relationships but are in line with the conjecture that they are optimistic to support the aftermarket performance of the underwritten securities.
These results have policy implications. While regulations trying to isolate analyst research from the influences of investment banking activities are proliferating, regulations on preventing aftermarket price support appear weak. For example, under FINRA rules, financial analysts and their employers are prohibited from publishing reports or making public appearance relating to the issuer ten days after the initial public offering or three days after the secondary offering where the employer has acted as an underwriter, manager or dealer. Nevertheless, the portfolio turnover ratio of non-index mutual funds in the U.S. is roughly 50%, suggesting that the investors participating in the offering may hold the offered securities for an average of two years (Rowley and Dickson, 2012). The underwriter itself may also retain part
20
of the offered securities on its own portfolio. Unsurprisingly, academic studies show that underwriter analyst optimism may last for several years. Restrictions of three to ten days thus appear in no way sufficient to prevent underwriters from attempting aftermarket support. Our results therefore suggest that financial analyst regulations should be not only focus on the investment banking relationship but also aftermarket price support.
The rest of the paper is structured as follows: Section 2.2 reviews related literature and develops hypotheses; Section 2.3 introduces the data, methodology and variable construction; Section 2.4 presents selected results; Section 2.5 concludes.
2.2 Literature review and hypothesis development
Prior literature has debated analyst optimism in the different components of stock reports, notably recommendations, target prices, and and earnings forecasts. For example, Lin and McNichols (1998) and Michaely et al. (1999) find that equity underwriter analysts issue more favorable and biased recommendations. Target price optimism is also widespread among stock analysts (Brav and Lehavy, 2003, Asquith et al., 2005, Bradshaw et al., 2013), and is used to justified favorable stock recommendations (Bradshaw, 2002). Analysts at investment banks are also found to trade off earnings forecast accuracy for optimism because of concerns about business relationships or career prospects (Francis and Philbrick, 1993, Hong and Kubik, 2003).
Over-optimism is generated by the analysts’ under-reaction to negative information and over-reaction to positive information (Easterwood and Nutt, 1999), and fixation on accounting earnings without accounting for the low persistence of accruals (Bradshaw et al., 2001, Drake and Myers, 2011). This seems to be more a consequence of strategic behavior rather than negligence (Raedy et al., 2006).
21
These studies generally allege that firm management is fond of optimistic forecasts, and because underwriting relationships are costly to build and maintain, investment banks pressure their analysts to favor overly optimistic forecasts to the detriment of forecast accuracy. Understandably, managers dislike pessimistic opinions about their firms. In his book Exile on Wall Street: One Analyst's Fight to Save the Big Banks from Themselves, Mayo (2012) tells the
story of how his conservative views of the firms invite hostile reactions from their managers. Moreover, buy recommendations attract more commission revenue from retail investors (Cowen et al., 2006) and institutional investors (Firth et al., 2013, Gu et al., 2013).
Apart from soliciting banking business and brokerage commissions, stock analysts may be optimistic to support aftermarket performance of the stocks their employers have underwritten (James and Karceski, 2006). Aftermarket stock performance concerns arise not only because underwriters have to buy the unsold amount of an offering, but also because the post-offering performance is crucial for their reputation to customers and investors (Bradshaw, 2011). Because favorable coverage can create positive stock price reactions (Asquith et al., 2005, Francis and Soffer, 1997, Jegadeesh and Woojin, 2010), underwriters may pressure their analysts to use favorable analysis reports to support stock performance.
Note that the relationship incentive and the aftermarket performance incentive concern two different groups of the brokerage house' customers. The former are the issuers of the securities the brokerage house has underwritten, whereas the later are buyers of those securities. These two groups of customers may have their interest not necessarily consistent with each.
As previously discussed, analysts affiliated with debt underwriters are as conflicted by the business relationship incentive as analysts affiliated with equity underwriters. However, they are not concerned about the stock performance after the debt has been issued. Therefore, if the business relationship incentive is the dominant determinant of analyst optimism, analysts
22
affiliated with debt underwriters should be as optimistic as analysts affiliated with equity underwriters. On the contrary, if the aftermarket incentive is the determinant of analyst optimism, analysts affiliated with debt underwriters are not going to be as optimistic. We propose the following hypothesis.
H1: Analysts affiliated with equity underwriters are more likely to be optimistic, while analysts affiliated with debt underwriters are not.
In order to see which incentive is dominant, we run the following regression to test our hypotheses.
𝑂𝑝𝑡𝑖𝑚𝑖𝑠𝑚/𝐴𝑐𝑐𝑢𝑟𝑎𝑐𝑦 = 𝛽0𝑖+ ∑ 𝛽𝑚𝑖𝐴𝑓𝑓𝑖𝑙𝑖𝑎𝑡𝑖𝑜𝑛𝑠𝑚𝑖+ ∑ 𝛽𝑛𝑖𝐶𝑜𝑛𝑡𝑟𝑜𝑙𝑛𝑖+ 𝜀𝑖 (1) Where affiliations are dummies indicating the analyst's employment at either a debt underwriter or an equity underwriter of the subject firm. Control variables include firm characteristics, broker characteristics, and analyst characteristics. In all regressions, we control for cross-sectional and temporal biases by normalizing all variables and adding year fixed effects, firm fixed effects, and analyst fixed effects.
2.3 Data and variable construction
Data
We obtain recommendations, target prices and earnings forecasts from U.S. firms and analysts from the I/B/E/S database for the period from 1999 to 2016. We eliminate duplicate observations of the same analyst for the same firm on the same day. For earnings forecasts, we remove forecasts made less than 30 days before the announcement of the actual earnings, forecasts made before the beginning of the financial year, and observations of actual earnings announced later than 100 days after the end of the fiscal year. Following previous literature, we keep only the latest earnings forecasts of a year. We further trim the data by eliminating
23
extreme observations in the 1st and the 100th percentiles of signed earnings forecast errors. For
target prices, we keep only target prices with a target horizon of 12 months. Stock returns are from CRSP, and financial statement data are from Compustat.
We obtain underwriting relationship data from SDC Thomson One Banker. The original equity issue file has 36,944 offerings from 1999 to 2016, among which 589 are initial public offerings. We use both seasoned equity offerings and initial public offerings in our analysis, as is the case in prior studies such as Kadan et al. (2009). As prior studies argue that lead underwriters and co-managers have similar interest in the issuer firms (Bradley et al., 2008), affiliated analysts are defined as those working for either a lead underwriter or a co-manager. This definition is consistent with prior studies (Kadan et al., 2009, Bradley et al., 2008).
In order to test our hypotheses, we need to match this data with I/B/E/S. The common identifier between these two data is the CUSIP number of the issuers in SDC and the followed firms in I/B/E/S. Unfortunately, there is no common identifier to match the underwriters in SDC and the brokerage houses in I/B/E/S.
We circumvent this obstacle using analyst names in the I/B/E/S target price file and recommendation file. In these files, the broker codes are abbreviations of the brokers’ names. For example, the three brokers that provided the highest number of target prices are coded "MERRILL" (68,022 observations), "GOLDMAN" (67,526 observations), and "SMITH" (67,077 observations). Codes such as "MERRILL" and "GOLDMAN" can be easily guessed to be Merrill Lynch and Goldman Sachs, but the broker code "SMITH" is less straightforward. We therefore apply the following procedure to uncode all brokerage codes, including the straightforward ones.
We first tabulate analyst names associated with a broker in the latest year for which data are available. We find 99 analysts associated with the broker "SMITH" in 2016,
24
accounting for 4,227 target prices. We choose analysts whose names are less common and whose numbers of forecasts are large and search their profiles on the internet, such as tipranks.com, LinkedIn, Bloomberg, and company websites. In the case of broker "SMITH" we look at the following names.
"M Bilerman": Search results show an equity analyst Michael Bilerman working for Citigroup in 2016. "S Gruber": An equity analyst Scott Gruber working for Citigroup in 2016. "P Juvekar": An equity analyst PJ Juvekar working for Citigroup in 2016. "K McShane, CFA": An equity analyst Kate McShane, a CFA charter-holder, working for Citigroup in 2016. "G Badishkanian": An equity analyst Gregory Badishkanian working for Citigroup in 2016, etc.
Based on these searches, we assume that "SMITH" represents Citigroup2. We repeat this procedure for 149 brokers, accounting for almost 95% of all observations in the target price file and recommendation file. In fact, there are more than nine hundred brokers in the data. However, the 149 brokers we have decoded provided the large majority of observations. The remaining codes refer to less well-known brokerage houses and institutions that have ceased to exist.
Having the name of the brokerage houses in I/B/E/S data, we match the underwriting data into I/B/E/S data using the issuer/subject firm CUSIP number, underwriter/broker name, and year.
There exists an additional problem with the earnings forecast file. The brokerage houses' identifiers in the earnings forecast file are different from those in target price file and recommendation file, and there is no variable containing analyst names in the earnings forecast file. We use the following approximate match procedure to decode the underwriting
2 We do not know why "SMITH" represents Citigroup. One explanation can be of historical reason. Citigroup
previously owned a brokerage house called "Smith Barney". In 2009, it is sold to Morgan Stanley and subsequently renamed "Morgan Stanley Wealth Management".
25
relationship for earnings forecast file. We assume that analysts are not going to change employers within a given month. We match the decoded broker name from the target price file and recommendation file into the earnings forecast file using analyst code, month and year. This leads to one problem. Assume that brokerage house X in the target price file has another code X* in earnings forecast file, and brokerage house Y in the target price file has another code Y* in the earnings forecast file. Also assume that analyst A worked at brokerage house X on Jan 1st, 2016 and issues a target price, thus presents in price target file. Assume further that on Jan 20th, 2016 A moves to brokerage house Y* and issues an earnings forecast, thus being
present in the earnings forecast file. In this case, instead of matching X with X*, we will be matching X with Y*. In other words, if the analyst changes employer within a month and issues target price, recommendation and earnings forecasts on different days of that month, there are chances that his/her employer name will be wrongly matched between the two files. To account for this, we assume that it is more frequent for A to remain at a brokerage house in a given month than moving from one brokerage house to another. Thus, given a sufficiently large number of observations, the number of matches between X and X* should be significantly larger than the number of matches between X and Y* (and between X and Z*, etc.). Thus, we assume that the pair with the largest number of matches is indeed the correct match (X and X*). All other pairs (X and Y*, X and Z*, etc.) will have much smaller number of matches and are therefore identified as wrong matches.
Using this procedure, we can decode the brokerage houses in the earnings forecast file for 52% of all observations, which is significantly lower than the 95% coverage in the target price and recommendation files.
Prior studies assume that an underwriting relationship lasts from 2 to 5 years after the offering. We assume that the relationship only stretches over a period of two years after date of the security's issuance, in accordance with prior studies such as Kadan et al. (2009). There
26
are several reasons for why we think that two years is a reasonable time window to test our hypotheses. First, the portfolio turnover ratio of non-index mutual funds in the U.S. is roughly 50%, which implies an investment holding period of 2 years (Rowley and Dickson, 2012). Second, large investors participating in equity issues are very often restricted from selling their shares during the lock-up periods of one year. Our hypothesis is that analysts affiliated with equity underwriters care about the aftermarket of the shares they have underwritten, and thus they may have strong incentives to push stock price within that time frame to support their own portfolio holding or to please the investors who have taken part in the issue.
Dependent variables
In the original dataset, recommendations are coded with values from 1 to 5 corresponding to strong buy, buy, hold, sell, and strong sell recommendation, respectively. It is easier to read the results if higher values represent more positive evaluations. Thus, we recode recommendations by creating the variable RECOM, which still has the integer values but in increasing order with 1 corresponding to strong sell until 5 corresponding to strong buy.
In order to test our hypotheses, we need a set of dependent variables that represent analyst precision and optimism in recommendations, earnings forecasts and price targets. We define the following variables:
Recommendations
Intuitively, an analyst is more optimistic if his recommendation is more favorable. We scale all recommendations by the range of recommendations of all analysts for each firm in each year. By construction, this variable has its value ranging from zero to one. Higher values indicate more favorable recommendations.
𝑅_𝑅𝐸𝐶𝑂𝑀 = 𝑅𝐸𝐶𝑂𝑀 − min(𝑅𝐸𝐶𝑂𝑀)
27
Besides, an analyst is optimistic if his recommendation is more favorable than those of his peers. We use a relative measure of recommendation optimism. Following prior studies, recommendation optimism (RECOPT) of an analyst for a firm is measured relative to mean recommendation of all analysts for the firm in the last 180 days prior to the day before the recommendation announcement (Gu et al., 2013, Firth et al., 2013).
𝑅𝐸𝐶𝑂𝑃𝑇 = 𝑅𝐸𝐶𝑂𝑀 − 𝑚𝑒𝑎𝑛(𝑅𝐸𝐶𝑂𝑀)(3) We also scale RECOPT across all analysts for a firm in a year.
𝑅_𝑅𝐸𝐶𝑂𝑃𝑇 = 𝑅𝐸𝐶𝑂𝑃𝑇 − min(𝑅𝐸𝐶𝑂𝑃𝑇)
𝑚𝑎𝑥(𝑅𝐸𝐶𝑂𝑃𝑇) − min(𝑅𝐸𝐶𝑂𝑃𝑇)(4) Price targets
Most intuitively, target price accuracy can be measured by the distance between the target price and the actual market price at the end of forecast horizon. As we keep only target prices with a 12-month forecast horizon, we measure target price accuracy and optimism relative to realized stock price 365 days after the target is announced (P12). This measure is
consistent with prior studies on target prices (Bilinski et al., 2012, Bradshaw et al., 2013, Chan et al., 2018). If a market price at exactly 365 days ahead is not available, we use up to past ten days of market price as substitutes.
𝑇𝑃𝐴𝐹𝐸 = |𝑇𝑃 − 𝑃12|(5)
𝑇𝑃𝑂𝑃𝑇 = 𝑇𝑃 − 𝑃12(6)
Following Chan et al. (2018), we scale each target price error and optimism by the range of target prices' errors and optimism of all analysts for the firm in the year, as in equation (5) and (6) respectively. This procedure results in two variables ranging from zero to one, with higher values indicating higher accuracy and optimism.
𝑇𝑃𝐴𝐶𝐶𝑈𝑅 = 𝑚𝑎𝑥(𝑇𝑃𝐴𝐹𝐸) − 𝑇𝑃𝐴𝐹𝐸
28
𝑅_𝑇𝑃𝑂𝑃𝑇 = 𝑇𝑃𝑂𝑃𝑇 − min(𝑇𝑃𝐴𝐹𝐸)
𝑚𝑎𝑥(𝑇𝑃𝑂𝑃𝑇) − min(𝑇𝑃𝑂𝑃𝑇)(6) Earnings forecasts
Intuitively, users of an analysis report would probably judge the performance of an earnings forecast primarily by how far the forecast is from the actual accounting earnings. We calculate the forecast error (AFE) as the absolute value of the distance between actual earnings and forecasted earnings (Jacob, 1997, Mikhail et al., 1997, Mikhail et al., 2003, Drake and Myers, 2011) and optimism (OPT) as the signed difference:
𝐴𝐹𝐸 = |𝐸𝑓𝑜𝑟𝑒𝑐𝑎𝑠𝑡− 𝐸𝑎𝑐𝑡𝑢𝑎𝑙|(7) 𝑂𝑃𝑇 = 𝐸𝑓𝑜𝑟𝑒𝑐𝑎𝑠𝑡− 𝐸𝑎𝑐𝑡𝑢𝑎𝑙(8)
Jacob et al. (1999) criticize the use of absolute forecast errors for being contaminated by inter-temporal changes and cross-sectional differences. Following Clement and Tse (2005) and similar to what we did for recommendations and prices, we derive a relative measure of forecast accuracy (ACCUR). Across all analysts, we subtract the maximum absolute forecast error and optimism for a firm in a year by absolute forecast error of each analyst for the same firm, and scale it by the range of absolute forecast errors and optimism. By construction, these variables have a range from zero to one with higher values indicating more accuracy or optimism. 𝐴𝐶𝐶𝑈𝑅 = 𝑚𝑎𝑥(𝐴𝐹𝐸) − 𝐴𝐹𝐸 𝑚𝑎𝑥(𝐴𝐹𝐸) − 𝑚𝑖𝑛(𝐴𝐹𝐸)(9) 𝑅_𝑂𝑃𝑇 = 𝑂𝑃𝑇 − min(𝑂𝑃𝑇) 𝑚𝑎𝑥(𝑂𝑃𝑇) − 𝑚𝑖𝑛(𝑂𝑃𝑇)(10)
Independent variables
Our main independent variables of interest include two dummies: DU and EU, which respectively receive the value of one if the analyst is affiliated with one of the followed firm’s
29
debt underwriters and equity underwriters, and zero otherwise. Because we are concerned with the difference between analysts affiliated with debt underwriters and equity underwriters, DU and EU must not take the value of one at the same time. We create another variable, EDU, which takes the value of one if the analyst’s employer underwriters both debt and equity of the followed firm, and zero otherwise.
We consult the literature to add relevant control variables into our models. Mikhail et al. (1997), followed by many other studies, suggest that analysts’ individual characteristics could potentially affect forecast accuracy. GEXPER is the analyst’s general experience, measured by the number of years the analyst has been in our data to the day of the forecast. FEXPER is the analyst’s firm-specific experience, measured by the number of years the analyst
has covered the followed firm in our data to the day of the forecast. NIND is the number of 2-digit SIC code industries an analyst covers in a given year. NFIRM is the number of firms an analyst covers in a given year. Lower GEXPER, FEXPER, and higher NFIRM, NIND may be associated with higher forecast errors (Mikhail et al., 1997, Mikhail et al., 2003, Clement and Tse, 2005). BSIZE is the size of the brokerage house, calculated as the number of analysts working for the brokerage house in a given year as observed in the dataset. Larger brokerage houses may be able to make more accurate forecasts because they can attract more talented employees and have more resources. FREQ is the number of forecast revisions the analyst issues for a firm in a year. FREQ represents analyst efforts. Higher FREQ is expected to improve forecast accuracy. FCAGE is the number of days from earnings forecast announcement date to announcement of actual earnings. More distant forecasts bear more uncertainty and less updated information, thus are less accurate.
Moreover, Mikhail et al. (2003) show that earnings forecast errors are persistent through time. We add lagged earnings forecast accuracy and optimism as a control variable in
30
the regressions of earnings forecast accuracy and optimism. We also add earnings forecast accuracy as a control variable in the regressions of target prices and recommendations.
Following prior studies (Clement and Tse, 2005, Chan et al., 2018), analyst characteristics are scaled using the same procedure used for the dependent variables. For each firm each year, an analyst characteristics X is scaled relative to all analysts who issue a forecast for that firm in that year using equation (11).
RX = X − min(X)
max(X) − min(X)(11)
We also account for firm-specific factors that may affect analyst forecasts, including book-to-market ratio (BM), profitability (ROA), leverage (LEV) and market capitalization (MV). FOLLOW is information intensity or analyst competition surrounding a given firm, measured by the number of analysts covering that firm in a given year. Following prior studies, for an analyst in a given year, firm characteristics are scaled across all firms for which the analyst issues a forecast in that year using equation (11) above. Note that analyst characteristics are scaled across all analysts covering the same firm, whereas firm characteristics are scaled across all firms the analyst covers.
In order to control for other potential biases, we also add year fixed effects, industry fixed effects (using two-digit SIC codes), and broker fixed effects to all our regressions.
2.4 Results
Summary statistics
Table 1 shows matched affiliations for each of the I/B/E/S files. Debt underwriter affiliations account for 1.9% observations in the earnings forecast file, 7.9% in the target price file, and 4.6% in the recommendation file. The number of matched affiliations in the earnings
31
forecast file is lower than in the other files due to the more demanding matching procedure described above.
Table 2 presents summary statistics of our main variables using the earnings forecast file. There are slight differences compared to previous studies, probably due to the difference in our sample selection. For example, Clement and Tse (2003)'s sample has a mean ACCUR of 0.58, while ours is 0.68, implying that our sampled earnings forecasts are on average more concentrated around zero forecast errors. This may be due to improved forecast accuracy, or due to our sample selection procedure where we trim 1% of the most inaccurate forecasts at each tail of the distribution of the distance between forecasted and actual earnings.
Table 1: The number of affiliated forecasts and recommendations in each I/B/E/S file
Earnings forecast Target price Recommendation
Obs. Mean Obs. Mean Obs. Mean
DU 565,558 0.019 716,004 0.079 455,627 0.046 EU 565,558 0.041 716,004 0.071 455,627 0.065 EDU 565,558 0.005 716,004 0.023 455,627 0.016
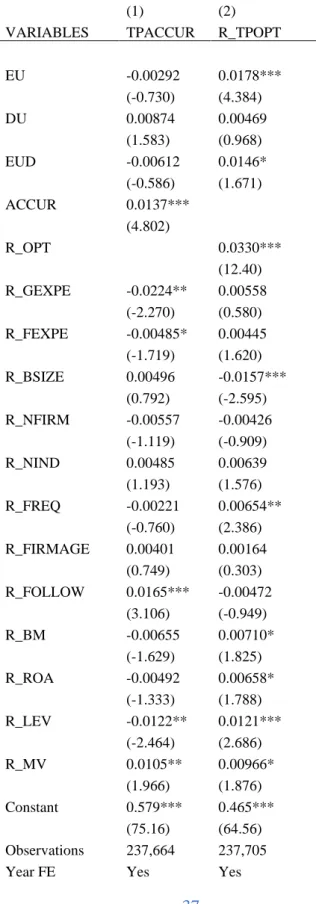
Prior research does not distinguish between analysts affiliated with equity underwriters and debt underwriters, but Table 2 indicates that they behave quite differently. The first row (ACCUR) shows that analysts affiliated with debt underwriters are more accurate as they make smaller earnings forecast errors than analysts affiliated with equity underwriters. This observation is corroborated by Panel B, which shows that analysts affiliated with debt underwriters are more accurate than analysts affiliated with equity underwriters in their target prices.
R_OPT indicates that analysts affiliated with debt underwriters are less optimistic than
analysts affiliated with equity underwriters. They also issue less optimistic target prices, as showed in Panel B. The difference in recommendations is not clear.