1 Modification of petroleum coke by different additives and the impact on anode properties
Sena Ozturk, Duygu Kocaefe*, Dipankar Bhattacharyay, Yasar Kocaefe
UQAC Research Chair on Industrial Materials (CHIMI) University of Quebec at Chicoutimi,
555, boul. d’Université, Chicoutimi, QC, Canada G7H 2B1 Sena Ozturk <[email protected]>,
Duygu Kocaefe <[email protected]>,
Dipankar Bhattacharyay < [email protected]>, Yasar Kocaefe<[email protected]>
*Corresponding author: Tel 1 418-545 5011 ext. 5215
E-mail: [email protected]
Abstract
Anodes, which provide the carbon required for aluminum production, are made from dry aggregates (petroleum coke, rejected anodes and butts) and coal tar pitch as the binder. Good quality anodes require good interaction between coke and pitch, and this relies on good wetting properties. The objectives of this work are to analyze the wetting properties of four different cokes with and without modification using an additive and to test the effect of the modified coke on anode properties. An FT-IR study was done to identify functional groups in non-modified and modified coke samples since they play an important role on coke-pitch interactions. The wetting tests were done using the sessile-drop method to measure the contact angle between coke and pitch. The results showed that the additive improved the wettability of all four cokes by pitch. The least wettable coke was chosen to produce anodes. For anode production, the entire dry aggregate is modified. The additive was mixed with the dry aggregate using two different approaches (one day earlier and five minutes before mixing). The anodes were characterized before and after baking. The early treatment with the additive was found to be better for the modification of dry aggregate.
2 1. Introduction
In primary aluminum production, alumina is reduced to aluminum in electrolytic cells by using carbon anodes according to reaction [1].
2Al2O3+3C 4Al + 3CO2 (1)
There are different steps in anode production: raw material preparation, mixing, compaction, and baking. At the mixing stage, dry aggregate (calcined petroleum coke, butts and recycled anodes) is mixed with coal tar pitch to prepare the anode paste, and this plays an important role in defining anode properties. Pitch, which is used as the binder, must penetrate into the pores of calcined coke and fill the void space between particles [2]. Anode paste is compacted in a vibro-compacter or a press to produce green anodes. Pitch carbonizes during anode baking at high temperature and binds the coke particles together. Good binding between coke and pitch requires good wetting properties between the two components [3]. To achieve this, the interaction between coke and pitch needs to be increased.
Calcined petroleum coke is a solid by-product of the oil refinery, and its quality may vary depending on the source of crude oil and the process conditions used within the refineries [4]. Since it is the major component in terms of mass (around 65-70%) in an anode recipe, properties of calcined coke significantly affects the resulting anode properties. Pitch also plays an important role in anode properties. It is produced from coal tar, a by-product of the metallurgical coke industry. Due to differences in the coal feedstock used for the coal tar production, the pitch quality can also vary. In order to obtain a good anode, which has high density, low electrical resistivity, low air and CO2 reactivities, and good mechanical properties, the raw material
3 The interactions between coke and pitch at the mixing stage have an important effect on resulting anode properties. The wettability gives an indication of the degree of interaction between these two components. If the wettability of coke by pitch improves, pitch can better penetrate into the pores of calcined coke and also fills the void spaces between particles. This results in better quality green anodes. Wettability can be quantified by the contact angle between the solid and the liquid surfaces [5]. The lower the contact angle is, the better the wettability is.
The wettability of coke by pitch is an important parameter to consider in attaining good anode properties. In the work of Sarkar et al [3], the influence of some coke properties on the wettability was investigated. Three calcined cokes with different properties and two different pitches were studied to understand which raw material properties affected the wettability most. Contrary to the other two cokes, the pitch did not penetrate into the third coke, which had lower porosity, lower O2 content, and a higher amount of C-S bond. Jiang et al. [6] studied the effect of
the chemical treatment of petroleum coke by perchloric acid (HClO4) and hydrogen peroxide
(H2O2). After the treatment, the structure of coke changed, and the specific surface area
increased. The oxygen containing functional groups were modified due to the chemical treatment.
Pitch is also one of the important raw materials in anode production. The quality of anodes depends on the quality of pitch as well. Researchers have studied the improvement of the pitch wetting behavior by the use of surfactants and additives. In the work of Rocha et al [7], two additives were used at three different weight percentages to modify petroleum pitch in order to improve its wetting capacity. The results showed that the utilization of additives increased the wettability of coke by the treated petroleum pitch.
4 Starovit and Maliy [8] investigated the addition of organic compounds such as aceptophene, dimethyl-naphthalene, acenaphthene, fluorine, diphenylene-oxide, α-methyl-naphthalene, and polymeric resins in pitch. When additives were mixed with pitch, the surface forces improve by the attachment of hydrogen atoms or hydrocarbon groups of the additives to the pitch surface. After modifying the pitch with the addition of different chemicals, it wetted the coke better. Two different experiments were conducted by Rocha et al [9]. First, a non-wetting and a wetting pitch were mixed at different ratios in order to create a pitch with a good wetting capacity. Second, an active surface agent, in this case a fatty acid, was added to the non-wetting pitch. As a result, the wettability of coke by the modified pitch was increased depending on the increase in temperature and the quantity of material added. In addition, during the sessile-drop tests, the use of nitrogen and high heating rate helped achieve good wettability.
In the work of Rocha et al [10], a coal tar pitch, a petroleum pitch treated with a surfactant (a by-product of the petroleum refining industry), and four substrates (petroleum coke, graphite, carbon black, and magnesia) were used. The use of additives improved the wetting behavior of petroleum pitch. They also observed that the Quinoline Insoluble (QI) content of pitch played an important role on the wettability of coke by pitch.
Another work on the improvement of the wettability of coke by pitch was reported by Rocha et al [11]. They added surfactants to pitch at different weight ratios in order to modify its properties. One petroleum pitch and three additives were used. Two additives were commercial active-surface agents (alkyl/carbonyl and alkyl/sulfur) and one was a product of petroleum refining. The results showed that the addition of these additives improved the wetting.
5 As it can be seen from these works, there are some studies on the improvement of coke and pitch properties using different chemicals. However, there is no work reported on the effect of these modifications on anode properties.
In the current study, four different cokes were modified using an additive. The type and the amount of additive were chosen based on the results of the authors’ previous work, during which different additives were tested [12]. The wettability of the modified cokes by pitch was improved compared to that for the non-modified cokes. The aim of this study was also to determine the best approach for the modification of the dry aggregate with the additive so that the anodes have better properties compared to those made with the same coke without modification. Anodes were fabricated using non-modified and modified cokes. Then they were characterized in the carbon laboratory of the University of Quebec at Chicoutimi (UQAC) Research Chair on Industrial Materials (CHIMI) to see the effect of the coke modification method on anode properties.
2. Experimental
2.1. Materials
In this study, four calcined petroleum cokes (coke 1, coke 2, coke 3, and coke 4) and one coal tar pitch were used. They were obtained from the industry. The softening point of the pitch was around 120°C. The additive and the solvent used were purchased from Sigma Aldrich. As mentioned previously, the additive selection and amount of additive used were based on the previous work of the authors [12]. The additive did not leave any inorganic residue that may contaminate the anodes. A polar solvent with a high-dielectric constant and a low boiling point was used to ensure that the chemicals would dissolve in this solvent. The names of the additive and the solvent are not disclosed due to confidentiality.
6 2.2. Modification of the Calcined Coke/Aggregate with Additive
a) For wettability experiments
Calcined coke particles were crushed in a laboratory hammer mill (Retsch SK 100), and the crushed particles were sieved using a sieve shaker (Humboldt MFG). Then, -125+100 µm particles were collected [13, 14]. This particle fraction was modified using the additive for the wettability tests.
The solvent was used since the addition of a small amount of viscous additive directly into the coke would not have ensured homogeneous mixing, and the modification of all coke particles would not have been achieved. A measured quantity of the additive was dissolved in a specific volume of the solvent using a magnetic stirrer. Then, a measured quantity of coke was added to the solution, which was stirred for 10 minutes. The mixture was dried in a furnace at 85°C for 1.5 h. The modified coke sample was finally cooled to room temperature and used for the wetting experiments.
b) For anode preparation
Coke 1, which was found to be the least wettable coke by the pitch based on the results of the wettability study, was chosen for the anode production. One standard anode (used as reference) and two anodes with modified dry aggregate were produced, all using coke 1. As explained previously, the anodes are made using a dry aggregate composed of coke as well as rejected anodes and butts. It is hard to know the sources of these materials. In this study, all three anodes contained the same recycled material (anodes and butts) so that their impact would be the same. During anode production, the whole dry aggregate was modified before mixing for Anode1 and
Anode2. The contact time of the additive with the aggregate was changed to determine the
7 were maintained the same. Standard anode (Anodestd) was manufactured using non-modified
coke 1.
During the production of anodes made with modified coke, the whole dry aggregate was treated with the additive. A certain amount of additive was dissolved in the solvent. The dry aggregate was placed in a container. For the first anode (Anode1), the solution was added slowly to the dry
aggregate. The temperature was increased to 50°C and maintained for five minutes. Then, the mixture was left at room temperature for one day for drying before Anode1 was produced. The
second anode (Anode2) was manufactured after the additive was mixed with the dry aggregate
for five minutes right before the preparation of the anode paste and subsequent anode production. This was done to determine the effect of contact time between the additive and the coke.
2.3. Sample Characterization
2.3.1. Fourier Transform Infrared Spectroscopy (FT-IR)
An FT-IR study was carried out in order to identify the functional groups in all coke samples (non-modified and modified with additive) using Nicolet 6700 FT-IR spectrometer. The experiments were done using KBr pellet, and the ratio of KBr to sample was 200 to 1. For each sample, 36 scans were carried out. The IR spectra were collected for the wavenumber range of 400-4000 cm-1. The spectra were smoothened, and the linear baseline correction was done using
Omnic software. Each sample was analyzed two times at room temperature, and the average value was used.
2.3.2. Wettability
Wettability experiments were performed using the sessile-drop method with a set-up available in the carbon laboratory of the Chair CHIMI. All experiments were carried out under nitrogen
8 atmosphere and at 170°C which is the typical mixing temperature used in industry [13, 14]. Images of the pitch drop on the coke bed were saved at predetermined time intervals. Contact angles were calculated at different times using the software FTA-32. Further information on the sessile-drop system was published elsewhere [13]. The sessile-drop test was carried out twice for each case, and the average of the contact angles measured in these two experiments was used for the analysis. If the contact angle values measured at any given time differed by more than 5° between the two experiments, the test was repeated.
2.4. Fabrication of laboratory anodes
A measured quantity of dry aggregate (modified or non-modified) was mixed with molten coal tar pitch. The paste temperature was maintained at around 170°C. The paste was compacted in a vibro-compactor for one minute. Green anodes (nearly 10 kg) of rectangular cross-section were obtained after compaction. Four cylindrical cores of 50 mm in diameter were cut from the green anodes [13]. The density and the electrical resistivity of the green cores were measured. Two of the cores (same positions for all the anodes) were baked in a baking furnace under conditions similar to those used in the industry. These baked cores were used for further studies as explained below. A detailed description of the anode manufacturing process and the baking conditions were published elsewhere [13, 15].
2.5. Characterization of Anode Properties
Four cylindrical cores (φ50 mm) were taken from the anodes (see Figure 1(a)). Top and bottom of the cores were removed to have a core of 130 mm length (Figure 1(b)).
9 Figure 1: (a) Anode coring plan (b) Preparation of green anode cores (c) Anode samples used
for reactivity tests
The density (GAD) and the electrical resistivity (GER) of all the green anode cores (φ50 x 130 mm) were measured (cores 1 - 4) according to ASTM D5502-00 (2015) and ASTM D6120-97 (2012), respectively.
Cores 2 and 3 were baked. The baked anode density (BAD), the baked anode electrical resistivity (BER) of these cores (φ50 x 130 mm), and the flexural strength of core 3 were measured according to ASTM D5502-00 (2015), ASTM D6120-97 (2012), and ISO N 848, respectively. Then, two φ50 x 50 mm samples were cut (one from the top and the other from the bottom of core 2, Figure 1(c)). The φ50 x 50 mm sample from the top was used for the air reactivity measurement (ASTM-D6559-00a), and the sample from the bottom was used for the CO2
reactivity measurement (ASTM-D6558-00a). The dusting due to both air and CO2 reactivities
10 elsewhere [13]. For cases where more than one core was used, the average value and the standard deviation were calculated. The average value gives an idea about the quality of the anode, whereas the standard deviation represents the non-homogeneity of the anode
3. Results and Discussion
3.1. FT-IR Results
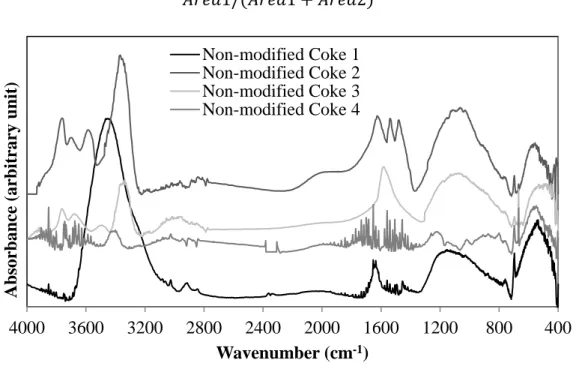
The presence of different functional groups in coke and pitch can be investigated using the FT-IR analysis. Figure 2 shows the FT-FT-IR spectra of non-modified cokes. The results show that all cokes have aromatic and aliphatic functional groups. They also have heteroatom-containing (O and N) functional groups. Three types of interactions are possible between coke and pitch, namely electrostatic interaction, hydrogen bond, and acid-base/condensation reaction [3]. Aliphatic functional groups are usually not favorable for coke-pitch interaction due to the steric hindrances of the long aliphatic chains [13]. However, aromatic and heteroatom-containing functional groups play an important role in these interactions. The differences between the spectra of non-modified cokes in the wavenumber range of 750-900 cm-1 (substitution reaction of the aromatic ring) might lead to condensation reactions between heteroatom-containing functional groups [16]. Some differences were observed in the regions for heteroatom-containing functional groups in the wavenumber ranges of 1000-1300 cm-1, 1700-1800 cm-1, 3300-3600
cm-1, and 3600-3800 cm-1 [16, 17]. The region of 3600-3800 cm-1 mostly shows the presence of moisture. Also, 1700-1800 cm-1 region shows the presence of carbonyls. As this region might contain a peak due to the presence of carbon dioxide, this wavenumber range was not considered in the analysis. Thus, the analysis of heteroatom-containing functional groups was restricted to the two wavenumber ranges, 1000-1300 cm-1 and 3300-3600 cm-1.
11 The region of 1000-1300 cm-1 represents primary alcohol/secondary alcohol/ether, which can help the interaction between coke and pitch. The surface functional groups in the region of 3300-3600 cm-1 represent mostly hydrogen bonded OH and NH. The functional groups of this range can also be due to inter/intra molecular hydrogen bonding. The area of spectra in the range of 1000-1300cm-1 (Area1) and 3300-3600cm-1 (Area2) were calculated for each sample. In order to have an idea of the primary alcohol/secondary alcohol/ether functional groups in the sample, the ratio of Equation 2 was calculated.
𝐴𝐴𝐴𝐴𝐴𝐴𝐴𝐴1/(𝐴𝐴𝐴𝐴𝐴𝐴𝐴𝐴1 + 𝐴𝐴𝐴𝐴𝐴𝐴𝐴𝐴2) (2)
Figure 2: FT-IR analysis of four non-modified cokes
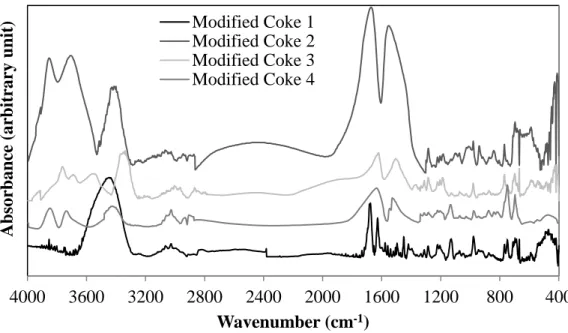
The objective of using an additive is to create bridges between coke and pitch in order to enhance the coke-pitch interactions. The additive was chosen in such a way that it has minimum two functional groups to bind with coke and pitch. Figure 3 shows the spectra of the cokes modified with the additive. All samples (modified coke 1, modified coke 2, modified coke 3 and modified coke 4) contain aromatic, aliphatic, and heteroatom-containing functional groups. Also,
400 800 1200 1600 2000 2400 2800 3200 3600 4000 A b so rb a n ce ( a rb it ra ry u n it ) Wavenumber (cm-1) Non-modified Coke 1 Non-modified Coke 2 Non-modified Coke 3 Non-modified Coke 4
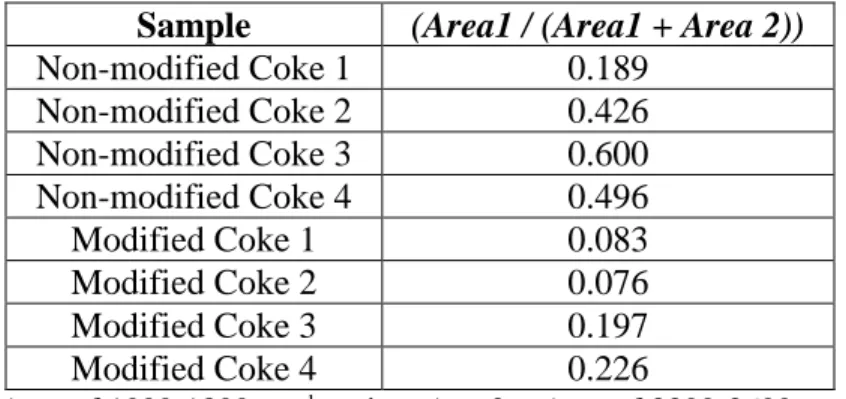
12 the ratio shown in Equation 2 was calculated for the modified coke samples. It was assumed that a high value of this ratio would indicate the availability of heteroatom containing functional groups capable of binding with pitch. This assumption was later validated by the wettability test results. Improved interactions between coke and pitch can result in better wettability of coke by pitch. Table 1 shows the values of the ratio for the non-modified cokes and the cokes modified using the additive. The results showed that coke 1 has the lowest ratio in non-modified state and the second lowest in modified state.
Figure 3: FT-IR analysis of four cokes modified using the additive 400 800 1200 1600 2000 2400 2800 3200 3600 4000 A b so rb a n ce ( a rb it ra ry u n it ) Wavenumber (cm-1) Modified Coke 1 Modified Coke 2 Modified Coke 3 Modified Coke 4
13 Table 1: Area ratio determined from FT-IR results for four cokes
Sample (Area1 / (Area1 + Area 2))
Non-modified Coke 1 0.189 Non-modified Coke 2 0.426 Non-modified Coke 3 0.600 Non-modified Coke 4 0.496 Modified Coke 1 0.083 Modified Coke 2 0.076 Modified Coke 3 0.197 Modified Coke 4 0.226
Area1= Area of 1000-1300 cm-1 region, Area2 = Area of 3300-3600 cm-1 region
3.2. Wettability
The wettability experiments were done using sessile-drop system. Figure 4 shows the wettability results for the non-modified cokes (solid lines) and the cokes modified with the additive (dash lines). The contact angle decreased with increasing time for each coke. Hence, wetting is increased with time. Also, all the modified cokes were wetted better by the pitch compared to the non-modified cokes. It was found that the addition of the additive to coke improved the wettability of coke by pitch.
Figure 4: Wettability of for non-modified cokes and cokes modified with additive 0 10 20 30 40 50 60 70 80 90 0 100 200 300 400 500 C on tac t A n gl e (° ) Time (s) Non-modified coke 1 Non-modified coke 2 Non-modified coke 3 Non-modified coke 4 Modified coke 1 Modified coke 2 Modified coke 3 Modified coke 4
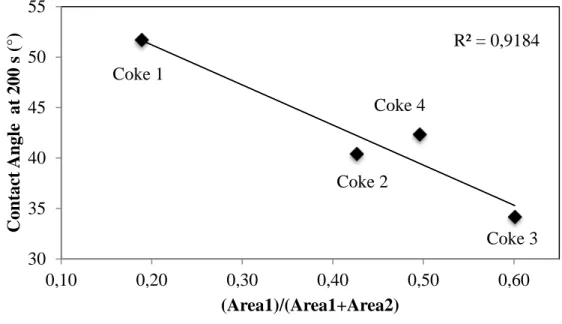
14 In order to analyze the correlation between FT-IR results and wettability experiments, contact angles at 200 second was determined for each sample. Figure 5 shows that a lower value of the area ratio determined from the FT-IR spectra corresponds to a higher contact angle at a given time. Similar trend was observed at different times. High contact angle represents weak interaction between coke and pitch (low wettability). If a non-modified coke sample has less heteroatom-containing functional groups (low value of the area ratio), the interaction between that non-modified coke and pitch will be weak. Thus, these results validated the assumption made in section 3.1.
Figure 5: Relation between contact angle and the area ratio at 200 s
3.3. Effect of Additive on Anode Properties
It was observed from the FT-IR analysis and the wettability results that the interaction between coke 1 and pitch was poor compared to that of the other coke samples. Thus, coke 1 was chosen for the anode production. Two approaches were tried to determine the best way to mix the additive with the dry aggregate containing this coke (contact time for the additive-dry aggregate
Coke 1 Coke 2 Coke 3 Coke 4 R² = 0,9184 30 35 40 45 50 55 0,10 0,20 0,30 0,40 0,50 0,60 C on tac t A n gl e at 200 s ( °) (Area1)/(Area1+Area2)
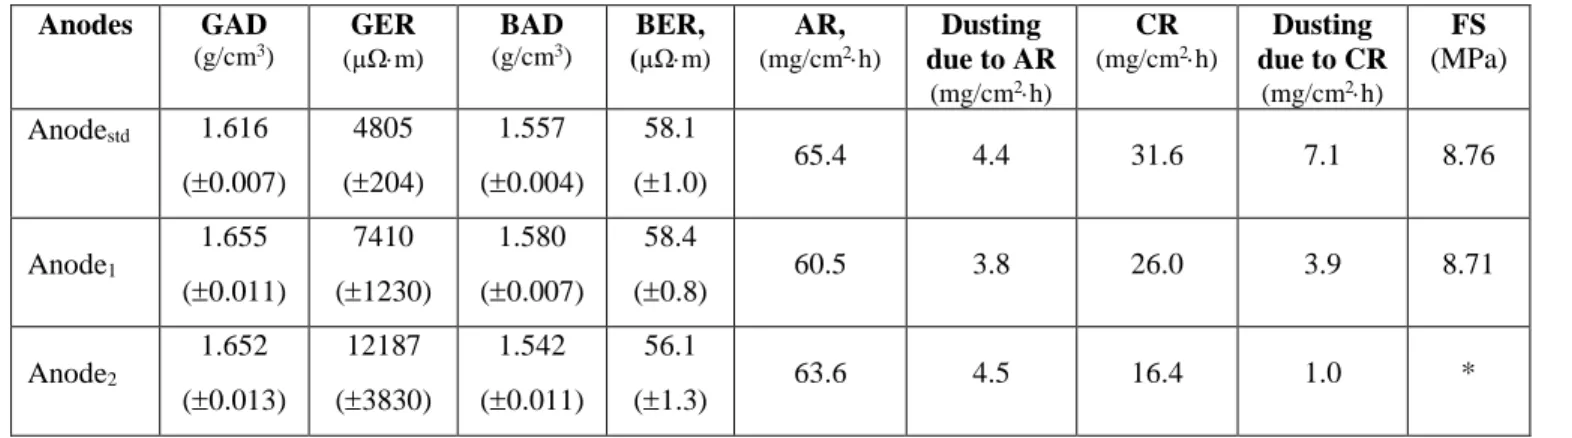
15 mixture) in order to produce better quality anodes. Table 2 shows the characterization results for the standard anode (no additive) and the anodes produced using these two approaches. The table shows that not only the green anode density (GAD) of the modified anodes (Anode1 and Anode2)
but also the air and CO2 reactivities showed significant improvement compared to the anode
produced with non-modified coke (Anodestd). Dusting due to the air and CO2 reactivities of
Anode1 also improved. However, dusting due to the air reactivity of Anodestd and Anode2 is quite
similar (no improvement). The difference in the electrical resistivity of Anodestd and Anode1 is
within the range seen in the industry due to the non-homogeneity of raw materials. Their baked electrical resistivities are similar as it can be seen from Table 2. The non-homogeneity of Anode2
was caused due to the vaporization (a lot of vapor was observed during the mixing of the additive) of the solvent as the coke was already hot when the additive-solvent mixture was added. As the solvent evaporated, the additive could not mix uniformly with the dry aggregate. The non-homogeneity of Anode2 reflected in the texture of the cores (Figure 6). The flexural
strength of Anode2 was not measured due to the visible cracks. The flexural strength of Anode1
is almost the same with Anodestd. Thus, there is no significant change in the flexural strength
after the modification.
It can be seen from Table 2 that Anode1 (treated with the additive one day earlier) showed
improvement compared to that for Anode2 (treated with the additive five min before mixing with
pitch) in terms of green and baked anode density, green electrical resistivity, and air reactivity. Anode2 had high GAD, but low BAD. However, Anode2 had better for CO2 reactivity and
dusting due to CO2 reactivity. The physical appearances (visible defects) of Anodestd and Anode1
before baking were similar and appeared to be better than that of Anode2 (Figure 6). The
16 those for Anode2 (treated one day earlier). This shows that Anode2 was more non-homogeneous
with respect to Anode1. However, the standard anode had the minimum standard deviation
values (except for BER).
Improvement of a particular property is not an ideal indicator of an anode quality; a good anode should have reasonable values for all properties. Based on the physical appearance (visible defects), BAD, BER, and the reactivities of anodes made with the modified dry aggregate, the approach for the modification of coke one day earlier was found to be better to produce good quality anodes.
Table 2: Characterization results for different anodes
Anodes GAD (g/cm3) GER (µΩ⋅m) (g/cmBAD 3) BER, (µΩ⋅m) AR, (mg/cm2⋅h) Dusting due to AR (mg/cm2⋅h) CR (mg/cm2⋅h) Dusting due to CR (mg/cm2⋅h) FS (MPa) Anodestd 1.616 (±0.007) 4805 (±204) 1.557 (±0.004) 58.1 (±1.0) 65.4 4.4 31.6 7.1 8.76 Anode1 1.655 (±0.011) 7410 (±1230) 1.580 (±0.007) 58.4 (±0.8) 60.5 3.8 26.0 3.9 8.71 Anode2 1.652 (±0.013) 12187 (±3830) 1.542 (±0.011) 56.1 (±1.3) 63.6 4.5 16.4 1.0 *
The numbers are the average values. The numbers in brackets are the standard deviation. * Could not be measured due to visible cracks.
(GAD: green anode density; GER: green anode electrical resistivity; BAD: baked anode density; BER: baked anode electrical resistivity; AR: air reactivity; CR: CO2 reactivity; FS: flexural strength)
17 Figure 6: Physical appearance of green anode cores (50 mm diameter, 130 mm height) (a) Standard anode (b) Anode produced with coke treated one day earlier (c) Anode produced
with coke treated five minutes before mixing
4. Conclusions
In this work, the modification of four different cokes by an additive was studied in order to analyze the effect of coke modification on anode quality. The additive improved the wettability of all cokes for the same pitch. The results showed that the ratio, which represents the heteroatom-containing functional groups in coke, is inversely correlated with the contact angle (wettability of coke by pitch). Better coke-pitch interaction requires a high ratio. Coke 1, which was least wettable by pitch, had the lowest ratio among the cokes studied. It is quite likely that a quick FT-IR analysis can be helpful for the industry in choosing their raw material.
Three anodes were produced with coke 1 to see if the modified coke will improve the anode properties. Anodes made with the chosen additive had better properties compared to those of the standard anode made with non-modified coke (except for GER of both anodes made with modified coke, and BAD for Anode2). It was also seen that the method of mixing the additive
18 earlier before anode production resulted in an anode with better properties compared to those obtained when the additive was combined with the coke right before the paste preparation (mixing).
Since it is possible to obtain better quality anodes by modifying the coke, this will most likely lead to energy saving, lower carbon consumption, and lower greenhouse gas emissions. However, further study is needed with the other cokes and pitches to study the effect of the additive, and industrial trials need to be carried out to determine the behavior of anodes (made with modified aggregate) during electrolysis.
5. References
1. Hulse KL. Anode Manufacture, raw materials formulation and processing parameters. New Zealand: R&D Carbon 2000.
2. Adams AN, Schobert HH. Characterization of the surface properties of anode raw materials. TMS Light Metals. 2004; p. 495-498.
3. Sarkar A, Kocaefe D, Kocaefe Y, Sarkar D, Bhattacharyay D, Morais B, et al. Coke– pitch interactions during anode preparation. Fuel 2014; 117, Part A(0): p. 598-607.
4. Fernandez R. Petroleum coke, grades and production, CarboMat Seminar Trondheim: 2003.
5. Abdallah W, Buckley J.S, Carnegie A, Edwards J, Herold B, Fordham E, et al. Fundamentals of wettability. Oilfield Review, 2007; 19(2).
6. Jiang B, Zhang Y, Zhou J, Zhang K, Chen S. Effects of chemical modification of petroleum cokes on the properties of the resulting activated carbon. Fuel 2008; 87(10– 11): p. 1844-1848.
7. Rocha VG, Granda M, Santamaria R, Blanco C, Diestre EI, Menendez R. Improvement of pitch/coke iteractions by addition of surface tension modifiers. Instituto Nacional del Carbon 2004.
8. Starovoit A and Maliy Y. Research of polymeric additive influence of organic composition on thermochemical conversion of carbon masses. Chemistry & Chemical Technology 2008; 2(1): p. 69-73.
19 9. Rocha VG, Blanco C, Santamaria R, Diestre EI, Menendez R, Granda M. Pitch/coke
wetting behaviour. Fuel 2005; 84(12-13): p. 1550-1556.
10. Rocha VG, Blanco C, Santamaria R, Diestre EI, Menendez R, Granda M. The effect of the substrate on pitch wetting behaviour. Fuel Processing Technology 2010; 91(11): p. 1373-1377.
11. Rocha VG, Granda M, Santamaria R, Blanco C, Diestre EI, Menendez R. Pyrolysis behaviour of pitches modified with different additives. Journal of Analytical and Applied Pyrolysis 2005; 73(2): p. 276-283.
12. Ozturk S, Kocaefe D, Bhatacharyay D, Kocaefe Y, and Morais B. Modification of coke by different additives to improve anode properties. Fuel 2017; 211: p. 102-109.
13. Sarkar A. Effect of coke properties on anode properties. Univesity of Quebec at Chichoutimi: Canada, PhD thesis, 2015.
14. Lu Y. Effect of pitch properties on anode properties. University of Quebec at Chicoutimi: Canada, Master thesis, 2016.
15. Amrani S. Impact de la préparation des anodes crues et des conditions de cuisson sur la fissuration dans des anodes. University of Quebec at Chicoutimi (UQAC): Canada, PhD thesis, 2015.
16. Menendez JA, Pis JJ, Alvarez R, Barriocanal C, Fuente E, Diez MA. Characterization of petroleum coke as an additive in metallurgical cokemaking. Modification of thermoplastic properties of coal. Energy & Fuels 1996: 10(6): p. 1262-1268.
17. Guillen MD, Iglesias MJ, Dominguez A, Blanco CG. Semi-quantitative FTIR. Analysis of a coal tar pitch and its extracts and residues in several organic solvents. Energy & Fuel 1992; 6(4): p. 518-525.