HAL Id: tel-01133709
https://tel.archives-ouvertes.fr/tel-01133709
Submitted on 20 Mar 2015HAL is a multi-disciplinary open access archive for the deposit and dissemination of sci-entific research documents, whether they are pub-lished or not. The documents may come from teaching and research institutions in France or abroad, or from public or private research centers.
L’archive ouverte pluridisciplinaire HAL, est destinée au dépôt et à la diffusion de documents scientifiques de niveau recherche, publiés ou non, émanant des établissements d’enseignement et de recherche français ou étrangers, des laboratoires publics ou privés.
data for predictive maintenance
Wissam Sammouri
To cite this version:
Wissam Sammouri. Data mining of temporal sequences for the prediction of infrequent failure events : application on floating train data for predictive maintenance. Signal and Image processing. Université Paris-Est, 2014. English. �NNT : 2014PEST1041�. �tel-01133709�
Universit´
e PARIS-EST
`
Ecole doctorale Mathmatiques et Sciences et Technologies de l’Information et de la Communication (MSTIC)
TH `ESE
pr´esent´ee en vue de l’obtention du Grade de
Docteur de l’Universit´e Paris-Est
Sp´ecialit´e: Signal, Image et Automatique
par
Wissam Sammouri
Data mining of temporal sequences for the prediction of
infrequent failure events: Application on Floating Train
Data for predictive maintenance
Fouille de s´
equences temporelles pour la maintenance
pr´
edictive. Application aux donn´
ees de v´
ehicules traceurs
ferroviaires
Jury :
AbdelHakim ARTIBA Professeur Rapporteur
Universit´e de Valenciennes
Walter SCH ¨ON Professeur Rapporteur
Universit´e de Technologie de Compi`egne
Said MAMMAR Professeur Examinateur
Universit´e d’Evry Val d’Essonne
Latifa OUKHELLOU Directrice de Recherche Directrice de th`ese IFSTTAR
Etienne C ˆOME Charg´e de Recherche Examinateur
IFSTTAR
Patrice AKNIN Directeur Scientifique Examinateur
SNCF
Charles-Eric FONLLADOSA Chef de Projet R&D Invit´e ALSTOM
`
Acknowledgements
Je voudrais tout d’abord exprimer mes plus profonds remerciements `a ma directrice de th`ese Mme Latifa Oukhellou pour ses pr´ecieux conseils, support et encouragements. J’aimerais aussi remercier mon encadrant Etienne Cˆome pour son ´ecoute.
Je remercie tous les membres du jury de m’avoir fait l’honneur de par-ticiper `a l’´evaluation de mes travaux de th`ese. Je remercie notammenet Mr Walter Schon et Mr AbdelHakim Artiba, qui ont accept´e de rapporter sur ces travaux, pour leur lecture attentive du manuscrit et leurs observations toujours constructives. Merci ´egalement `a tous ceux qui ont contribu´e `a me faire avancer et qui m’ont transmis leurs connaissances, les nombreux professeurs qui ont marqu´e ma scolarit´e et m’ont fait choisir cette direction. Je remercie Alstom de m’avoir confi´e `a une mission enterprise, ce qui ´etait une contribution majeure `a cette th`ese. Il n’y a pas de fouille de donn´ees sans donn´ees.
Plus g´en´eralement, je tiens `a adresser mes remerciements les plus chaleureux `
a l’ensemble des membres de l’´equipe de recherche du GRETTIA avec qui j’ai eu le plaisir d’´echanger et aussi de me d´etendre. Avec une pens´ee particuli`ere pour Hani El Assaad. Merci ´egalement `a Allou S., Olivier F., Moustapha T., Annie T., Andry R., Carlos D-M., Laura P. et Ferhat A. pour leur aide.
Je souhaite remercier mes amis pour leur support et leurs encouragements en particulier pendant la p´eriode de r´edaction. Cette phase aurait ´et´e beaucoup plus difficle sans vous. En particulier Mahmoud Sidani, Ghaydaa Assi et Elena Salameh d’avoir ´et´e l`a dans les moments les plus difficiles. Je pense aussi `a Hiba F., Hasan S., Kamar S., Diala D., Youmna C., Christel M-M. et Aura P..
Je terminerai ce pr´eambule en remerciant mes parents et ma famille pour leur amour et support inconditionnel, pour leurs encouragements infaillibles et pour une infinit´e de choses. Sans vous rien n’aurait ´et´e possible.
Wissam Sammouri Paris, 20 Juin 2014
Abstract
Data mining of temporal sequences for
pre-dictive maintenance: Application on
float-ing train data
In order to meet the mounting social and economic demands, railway operators and manufacturers are striving for a longer availability and a better reliability of railway transportation systems. Commercial trains are being equipped with state-of-the-art on-board intelligent sensors monitoring various subsystems all over the train. These sensors provide real-time flow of data, called floating train data, con-sisting of georeferenced events, along with their spatial and temporal coordinates. Once ordered with respect to time, these events can be considered as long tempo-ral sequences which can be mined for possible relationships. This has created a necessity for sequential data mining techniques in order to derive meaningful asso-ciations rules or classification models from these data. Once discovered, these rules and models can then be used to perform an on-line analysis of the incoming event stream in order to predict the occurrence of target events, i.e, severe failures that require immediate corrective maintenance actions. The work in this thesis tackles the above mentioned data mining task. We aim to investigate and develop vari-ous methodologies to discover association rules and classification models which can help predict rare tilt and traction failures in sequences using past events that are less critical. The investigated techniques constitute two major axes: Association analysis, which is temporal and Classification techniques, which is not temporal. The main challenges confronting the data mining task and increasing its complex-ity are mainly the rarcomplex-ity of the target events to be predicted in addition to the heavy redundancy of some events and the frequent occurrence of data bursts. The results obtained on real datasets collected from a fleet of trains allows to highlight the effectiveness of the approaches and methodologies used.
Keywords: Data mining, Temporal sequences, Association rules, Pattern recog-nition, Classification, Predictive maintenance, Floating Train Data.
Abstract
Fouille de s´
equences temporelles pour la
maintenance pr´
edictive.
Application aux
donn´
ees de v´
ehicules traceurs ferroviaires.
De nos jours, afin de r´epondre aux exigences ´economiques et sociales, les syst`emes de transport ferroviaire ont la n´ecessit´e d’ˆetre exploit´es avec un haut niveau de s´ecurit´e et de fiabilit´e. On constate notamment un besoin croissant en termes d’outils de surveillance et d’aide `a la maintenance de mani`ere `a anticiper les d´efaillances des composants du mat´eriel roulant ferroviaire. Pour mettre au point de tels outils, les trains commerciaux sont ´equip´es de capteurs intelligents envoyant des informations en temps r´eel sur l’´etat de divers sous-syst`emes. Ces informations se pr´esentent sous la forme de longues s´equences temporelles constitu´ees d’une succession d’´ev´enements. Le d´eveloppement d’outils d’analyse automatique de ces s´equences permettra d’identifier des associations significatives entre ´ev´enements dans un but de pr´ediction d’´ev´enement signant l’apparition de d´efaillance grave. Cette th`ese aborde la probl´ematique de la fouille de s´equences temporelles pour la pr´ediction d’´ev´enements rares et s’inscrit dans un contexte global de d´eveloppement d’outils d’aide `a la d´ecision. Nous visons `a ´etudier et d´evelopper diverses m´ethodes pour d´ecouvrir les r´egles d’association entre ´ev´enements d’une part et `a construire des mod`eles de classification d’autre part. Ces r`egles et/ou ces classifieurs peuvent ensuite ˆetre exploit´es pour analyser en ligne un flux d’´ev´enements entrants dans le but de pr´edire l’apparition d’´ev´enements cibles correspondant `a des d´efaillances. Deux m´ethodologies sont consid´er´ees dans ce travail de th`ese: La premi`ere est bas´ee sur la recherche des r`egles d’association, qui est une approche temporelle et une approche `a base de reconnaissance de formes. Les principaux d´efis auxquels est confront´e ce travail sont principalement li´es `a la raret´e des ´ev´enements cibles `
a pr´edire, la redondance importante de certains ´ev´enements et `a la pr´esence tr´es fr´equente de “bursts”. Les r´esultats obtenus sur des donn´ees r´eelles recueillies par des capteurs embarqu´es sur une flotte de trains commerciaux permettent de mettre en ´evidence l’efficacit´e des approches propos´ees.
Mots cl´es: Fouille de donn´ees, S´equences temporelles, R`egles d’associations, Classification, Maintenance Pr´edictive, V´ehicules traceurs ferroviaires.
Contents
Contents xii
1 Introduction 1
1.1 Context and Problematic . . . 1
1.2 Positioning, objectives and case study of the thesis . . . 2
1.3 Organization of the dissertation . . . 3
2 Applicative context: Predictive maintenance to maximize rolling stock availability 5 2.1 Introduction. . . 5
2.2 Data Mining: Definition and Process Overview . . . 7
2.3 Railway Context . . . 10
2.3.1 Existing Maintenance Policies . . . 11
2.3.2 Data mining applied to the railway domain: A survey . . . 13
2.4 Applicative context of the thesis: TrainTracer . . . 17
2.4.1 TrainTracer Data . . . 18
2.4.2 Raw data with challenging constraints . . . 19
2.4.3 Cleaning bursts . . . 24
2.5 Positioning our work . . . 24
2.5.1 Approach 1: Association Analysis . . . 25
2.5.2 Approach 2: Classification . . . 27
3 Detecting pairwise co-occurrences using hypothesis testing-based ap-proaches: Null models and T-Patterns algorithm 29 3.1 Introduction. . . 30
3.2 Association analysis . . . 31
3.2.2 Association Rule Discovery: Basic notations, Initial problem . . 32
3.3 Null models . . . 36
3.3.1 Formalism . . . 36
3.3.2 Co-occurrence scores . . . 37
3.3.3 Randomizing data: Null models. . . 38
3.3.4 Calculating p-values . . . 39
3.3.5 Proposed Methodology: Double Null Models . . . 39
3.4 T-Patterns algorithm. . . 40
3.5 Deriving rules from discovered co-occurrences . . . 42
3.5.1 Interestingness measures in data mining . . . 42
3.5.2 Objective interestingness measures . . . 43
3.5.3 Subjective Interestingness measures . . . 44
3.6 Experiments on Synthetic Data . . . 46
3.6.1 Generation Protocol . . . 46
3.6.2 Experiments . . . 46
3.7 Experiments on Real Data. . . 50
3.8 Conclusion . . . 54
4 Weighted Episode Rule Mining Between Infrequent Events 56 4.1 Introduction. . . 56
4.2 Episode rule Mining in Sequences . . . 58
4.2.1 Notations and Terminology . . . 58
4.2.2 Literature review . . . 59
4.3 Weighted Association Rule Mining: Relevant Literature . . . 63
4.4 The Weighted Association Rule Mining Problem . . . 65
4.5 Adapting the WARM problem for temporal sequences . . . 67
4.5.1 Preliminary definitions . . . 67
4.5.2 WINEPI algorithm . . . 68
4.5.3 Weighted WINEPI algorithm . . . 69
4.5.4 Calculating weights using Valency Model . . . 71
4.5.5 Adapting Weighted WINEPI to include infrequent events . . . . 72
4.5.6 Adapting Weighted WINEPI to focus on target events: Oriented Weighted WINEPI . . . 73
4.5.7 Experiments on synthetic data . . . 73
4.5.8 Experiments on real data . . . 78
CONTENTS
5 Pattern recognition approaches for predicting target events 81
5.1 Pattern Recognition . . . 82
5.1.1 Introduction . . . 82
5.1.2 Principle . . . 83
5.1.3 Preprocessing of data . . . 83
5.1.4 Learning and classification. . . 84
5.2 Supervised Learning Approaches . . . 85
5.2.1 K-Nearest Neighbours Classifier . . . 85
5.2.2 Naive Bayes . . . 86
5.2.3 Support Vector Machines . . . 86
5.2.4 Artificial Neural Networks . . . 90
5.3 Transforming data sequence into a labelled observation matrix . . . 93
5.4 Hypothesis testing: choosing the most significant attributes . . . 94
5.5 Experimental Results. . . 96
5.5.1 Choice of performance measures . . . 96
5.5.2 Choice of scanning window w . . . 97
5.5.3 Performance of algorithms . . . 99
5.6 Conclusion . . . 105
6 Conclusion and Perspectives 107 6.1 Conclusion . . . 107
6.2 Future Research Directions . . . 110
Appendix A 113 A.1 Expression of the critical interval of the test of equality of proportions . 113 A.2 Central Limit Theorem and Slutsky’s Theorem . . . 115
Bibliography 117
List of Figures 135
List of Tables 139
Glossary 141
Chapter 1
Introduction
1.1
Context and Problematic
In order to meet the mounting social and economic demands as well as the pressure to stand out within fierce global competitivity, railway operators and manufacturers are striving for a longer availability and a better reliability of railway transportation sys-tems. A permissive and lax maintenance strategy such as “run-to-failure” can lead to sizable maintenance costs not to mention the loss of public credibility and commercial image. Also, a systematic schedule-based maintenance policy can be uselessly time and resource consuming. From an intuitive point of view, the most intelligent maintenance policy exploits the functional lifetime of a component till the end. We thus speak of opportunistic maintenance which refers to the scheme in which preventive maintenance is carried out at opportunities based on the physical condition of the system. The automatic diagnosis of the physical condition of systems allows to detect degradation or failures either prior or directly upon their occurrence. Diagnosis is a term which englobes at the same time the observation of a situation (monitoring of an industrial system) and the relevant decisions to be taken following this observation (system de-graded or not, etc.). It is a vast research field uniting researchers of multiple scientific communities such as control, signal processing, statistics, artificial intelligence, machine learning, etc.
In order to establish this maintenance policy in the railway domain, probe train vehicles equipped with intelligent sensors dedicated for the monitoring of railway in-frastructure (rail, high-voltage lines, track geometry, etc.) have been widely used in the recent years. However, these vehicles require certain logistic measures since they cannot circulate all the time. This shifted railway operators and manufacturers towards instrumenting commercial trains with sensors for the same purpose. While a commer-cial train is operating, these sensors monitor different systems and send information in real time via wireless technology to centralized data servers. This new approach thus allows the constant and daily diagnosis of both vehicle components and railway infras-tructure. However, the high number of commercial trains to be equipped demands a trade-off between the equipment cost and their performance in order to install sensors
on all train components. The quality of these sensors reflects directly on the frequency of data bursts and signal noise, both rendering data analysis more challenging. The main advantage of this approach lies in the huge quantity of obtained data, which if exploited and mined, can contribute to the benefit of the diagnosis process.
1.2
Positioning, objectives and case study of the thesis
The recent leaps in information technology have reflected a boost in the capacity to stock data as well as in both processing and computational powers. This has leveraged the use of intelligent monitoring systems which paved the way for automatic diagnosis procedures. Similar to floating car data systems which are now broadly implemented in road transportation networks, floating train data systems have also been recently developed in the railway domain. Commercial trains equipped with state-of-the-art on-board intelligent sensors provide real-time flow of data consisting of georeferenced events, along with their spatial and temporal coordinates. Once ordered with respect to time, these events can be considered as long temporal sequences which can be mined for possible relationships. This has created a necessity for sequential data mining techniques in order to derive meaningful association rules or classification models from these data. Once discovered, these rules and models can then be used to perform an on-line analysis of the incoming event stream in order to predict the occurrence of target events, i.e, severe failures that require immediate corrective maintenance actions.
The work in this thesis tackles the above mentioned data mining task. We aim to investigate and develop various methodologies to discover associations (association rules and episode rules) and classification models which can help predict rare failures in sequences. The investigated techniques constitute two major axes: Association analysis, which is temporal, and aims to discover rules of the form A −→ B where B is a failure event using significance testing techniques (T-Patterns, Null models, Double Null models) as well as Weighted association rule mining (WARM)-based algorithms, and Classification techniques, which is not temporal, where the data sequence is transformed using a methodology that we propose into a data matrix of labeled observa-tions and selected attributes, followed by the application of various pattern recognition techniques, namely K-Nearest Neighbours, Naive Bayes, Support Vector Machines and Neural Networks to build a classification model that will help predict failures.
The main challenges confronting the data mining task and increasing its complexity are mainly the rarity of the target events to be predicted in addition to the heavy redundancy of some events and the frequent occurrence of data bursts.
Industrial subsystems susceptible to be the most monitored are those presenting strong security requirements and low intrinsic reliability. Within a railway context, in a train, the tilt and traction systems correspond to this type of description. A failure in any of these subsystems can result in an immediate stop of the vehicle which can heavily impact the whole network both financially and operationally. The present work will focus on the prediction of these two types of target events using past events that are less critical. The real data upon which this thesis work is performed was
1.3 Organization of the dissertation
provided by Alstom transport, a subsidiary of Alstom. It consists of a 6-month extract from the TrainTracer database. TrainTracerTMis a state-of-the-art Centralized Fleet
Management (CFM) software conceived by Alstom to collect and process real-time data sent by fleets of trains equipped with on-board sensors monitoring 31 various subsystems such as the auxiliary converter, doors, brakes, power circuit and tilt.
1.3
Organization of the dissertation
This document consists of six chapters.
In Chapter 2, we introduce the context and the problematic of the study. We precise where the work of this thesis stands in the corresponding research field and identify the objectives and the applicative case study. First, we discuss the field of Data Mining and explain its general process, we then highlight the different types of maintenance policies while emphasizing on predictive maintenance in which the context of this thesis lies. We present an extended state of the art survey on data mining approaches applied to the railway domain. Following that, we then tackle the applicative context of the thesis. We introduce TrainTracer, from which the data extracts used in this thesis were furnished and describe how data is organized. We then invoke the major constraints and expected difficulties. Finally, we converge the above tackled subjects into formally defining the applicative and theoretical contexts in which the thesis lie.
Chapter 3 introduces our first contribution in this thesis. We first formally define the association rule mining problem and discuss its two most influential breadth-first and depth-first approaches used. In this chapter, two hypothesis-test-based signif-icance testing methods are especially adapted and compared to discover significant co-occurrences between events in a sequence: Null models and T-Patterns algo-rithm. In addition to that, a bipolar significance testing approach, called Double Null Models (DNM) is proposed, applied and confronted with the above mentioned approaches on both synthetic and real data.
In Chapter 4, We focus on the problem of Episode rule mining in sequences. We for-malize the problem by introducing basic notations and definitions and then discussing related work in this context. Following an extensive literature survey, we formally define the weighted association rule mining problem and adapt it to the problem of mining episode rules in temporal sequences. We propose a methodology called Weighted Winepi aimed to find significant episode rules between events and an approach de-rived from it to better include infrequent events in the mining process. We also propose “Oriented Weighted Winepi” which is more suitable to the applicative problematic of this thesis which is to find episodes leading to target events. Methods are confronted and tested on synthetic and real data.
In Chapter 5, we first introduce the general principle of pattern recognition. We explain briefly the principal approaches used in our work: K-Nearest Neighbours,
Naive Bayes, Support Vector Machines and Neural Networks. We propose a methodology to transform data sequence into a labelled data matrix of labelled obser-vations and selected attributes. We then propose a hypothesis-testing-based approach to reduce the dimensionality of the data. Results obtained by all classifiers on real data are confronted and analyzed.
In the last part of this thesis in Chapter6, we review and conclude the contributions of our work and discuss research perspectives as well as arising issues.
Chapter 2
Applicative context: Predictive
maintenance to maximize rolling
stock availability
Contents
2.1 Introduction . . . 5
2.2 Data Mining: Definition and Process Overview . . . 7
2.3 Railway Context . . . 10
2.3.1 Existing Maintenance Policies . . . 11
2.3.2 Data mining applied to the railway domain: A survey . . . . 13
2.4 Applicative context of the thesis: TrainTracer . . . 17
2.4.1 TrainTracer Data . . . 18
2.4.2 Raw data with challenging constraints . . . 19
2.4.3 Cleaning bursts . . . 24
2.5 Positioning our work . . . 24
2.5.1 Approach 1: Association Analysis . . . 25
2.5.2 Approach 2: Classification. . . 27
2.1
Introduction
Computers have promised us a fountain of wisdom but delivered a flood of data. – A frustrated MIS executive (Fayyad et al., 1996)
The recent couple of decades have witnessed an unprecedented advancement in information technologies which has leveraged a gigantic upgrade in data storage
capac-ities. For instance, the amount of data that can be stocked in hard drives has increased from the order of Kilobytes (103 bytes) in the 1980s to Petabytes (1015 bytes) very recently. This on-the-go advancement did not only concern hardware but software as well. Database utilities have been revolutionized in its various functional aspects such as: data collection, database creation, data management (storage and retrieval), ad-vanced data analysis (ERP software, data warehousing and mining) and visualization. This technology reflected in the boost of the database and information industry, and led to the abundancy of huge volumes of databases and information repositories which can be analyzed and mined for valuable information within various domains and appli-cations. However, the enormous amounts of data have far exceeded our human analysis ability, thus transforming data repositories into data archives that are rarely consulted. This situation can best be described as a data rich but information poor situation. This has created a need for data mining techniques to do an automated analysis that is at the same time powerful and fast.
In this thesis, we are particularly interested in the railway transportation field. Sys-tem failures and general upkeep of rolling stock aren’t just costly to operators because of repairs. The time loss in maintenance depots as well as in corrective maintenance procedures affects negatively the quality of the operator’s service due to reduced fleet availability. Diagnosing the problem, ordering replacement parts, troubleshooting: all of these time-consuming activities are the greatest impediments keeping operators from peak efficiency, and thus from optimal profit. The recent leaps in information and communication technologies have revolutionized support techniques for rail equipment maintenance and triggered an evolution in preventive maintenance strategies towards more optimized and cost effective solutions that aim to provide longer availability and better reliability of transportation systems. Similar to smart vehicles, commer-cial trains are being equipped with positioning and communication systems as well as on-board intelligent sensors monitoring various subsystems such as tilt, traction, signalling, pantograph, doors, etc. These sensors provide a real-time flow of spatio-temporal data consisting of georeferenced alarms, called events, which are transferred wirelessly towards centralized data servers where they are stocked and exploited within a specially-conceived data-warehousing and analysis system called Floating Train Data system (FTD). The information extracted from these data are used to es-tablish a unified preventive (condition-based) maintenance management as well as a more-advanced predictive maintenance approach which consists of performing an on-line analysis of the incoming event stream in order to predict and alert the imminent arrival or the increased probability of occurrence of severe failure events, i.e., failures requiring immediate corrective maintenance actions, also called target events.
In this chapter, we introduce the applicative context of this thesis which is the maximization of rolling stock availability by mining floating train data sequences within a predictive maintenance framework. We first define Data Mining and explain its general process in section 2.2. We then highlight the different types of maintenance
2.2 Data Mining: Definition and Process Overview
policies in 2.3.1 while emphasizing on predictive maintenance in which the context of this thesis lies. In 2.3.2 we present an extended literature survey on data mining approaches applied to the railway domain. We then tackle the applicative context of the thesis in2.4. We introduce TrainTracer, from which the data extracts used in this thesis were furnished and describe how data is organized in 2.4.1. We then invoke the major constraints and difficulties in 2.4.2 and the approaches used to clean data in 2.4.3. Finally, we converge the above tackled subjects into positioning the work of this thesis by formally defining the applicative and theoretical contexts in2.5.
2.2
Data Mining: Definition and Process Overview
Data mining refers to the extraction or “mining” of knowledge from large amounts of observed data. It is a vast domain of diverse algorithms and techniques which comply with different types of data types and problems. It involves an integration of techniques and methods from multiple disciplines such as database and warehouse technology, statistics, probability, pattern recognition (Neural Networks, Support Vector Machine, K-Nearest Neighbours, Decision Trees, etc.), data visualization, etc. It is an essential step in the process of Knowledge Discovery in Databases (KDD).
KDD is the nontrivial process of identifying valid, novel, potentially useful, and ultimately understandable patterns in data (Fayyad et al.,1996) and consists of an iter-ative sequence of steps that can be classified into three main categories: pre-processing, data mining and post-processing, which will be briefly defined next.
1. Data Pre-processing
This stage is considered as preparing the data for mining. It consists of a set of measures and operations executed over data in order to improve its quality, which will directly reflect on mining results. This step consists of three main types of techniques precised by (Han et al., 2006) to be: data integration, data cleaning and data reduction.
- Data Integration
Data integration consists of concatenating and merging data from different sources. The main obstacles are mainly homogenizing data by neutralizing possible struc-tural differences behind the different data sources without losing valuable infor-mation, in addition to the identification and removal of redundancies, i.e duplicate data records.
- Data Cleaning
Once the data integration is achieved, noise and errors should be handled. Data is cleaned in order to enhance mining quality. The cleaning process aims to
eliminate inconsistent or missing values, outliers and noise either manually or automatically. The approaches used to deal with this problem consist mainly of either ignoring/deleting records that contain missing or inconsistent values or correcting these records by injecting acceptable values.
- Data Reduction
One of the most important challenges facing data mining algorithms is scalabil-ity. Practically all learning algorithms consider in advance that data are fit to main memory and disregard how extremely sizable databases could be dealt with when only a limited portion of data can be viewed. In addition to that, computa-tional time increases significantly with the size or complexity of the data. For this reason, data reduction is a real need to simplify the mining process. Several pos-sible approaches can be carried out to reduce dimensionality including removing redundancies and irrelevant data, data sampling, feature selection, windowing, batch-incremental mode and parametric modelling for a lighter presentation of the data.
2. Data Mining
This step is the core and the major challenge in the KDD process. It involves the selection and application of appropriate algorithms and methodologies to extract patterns or knowledge from the data. One big challenge, which is also the main motivation behind this thesis, is to adapt existing algorithms, exploiting all known information and imposing constraints, on “dirty and ambiguous” data in order to focus the discovery process to comply with users expectations as well as with the applicative context. Another related challenge is the analysis of complex temporal data, which will be discussed more in details in the next chapter.
Data mining is a vast domain of algorithms and techniques that can be very diversified to comply with different types of problems such as mining frequent or rare patterns in different types of data such as transaction databases or se-quences of events that can be temporal or non temporal. These techniques can be assembled into three main categories: classification/prediction, clustering and association rule mining, succinctly described below.
- Classification and Prediction
Classification is the task of assigning observations to one of several predefined data classes. In order to describe and differentiate between these classes, classifi-cation methods aim at learning a classifying model or function, called classifier c, which can be defined as a function from a set of instances each with an attribute set x and a set of class labels y (c : x −→ y). For the model to be derived within
2.2 Data Mining: Definition and Process Overview
a supervised context, a set of already labelled observations, called training set, is used. This model will then be implemented to predict the class of unlabelled observations. A classification model can be viewed as a black box that automat-ically assigns a class label when presented with the attribute set of an unknown observation. Book references: (Bishop,2006;Han et al.,2006;Hastie et al.,2003)
- Cluster analysis
Cluster analysis divides data into clusters that are meaningful, useful or both (Tan et al., 2005). It is used in situations where the privilege of having a train-ing set with known class labels does not exist, which means that the traintrain-ing is performed in an unsupervised framework. Clustering techniques analyze similari-ties and dissimilarisimilari-ties between instances and partition data into natural classes, clusters, which are then used to predict labels. The similarity measure used to identify clusters, also called distance function, is a major challenge to define, es-pecially in the presence of complex data types. Book references: (Han et al.,
2006;Hastie et al.,2003)
- Association analysis: Association and Episode rule mining
Association rule mining is the discovery of existing reliable (and not necessary fre-quent) dependencies between items in transaction data or events in a sequence. These dependencies are called association rules. More formally, an association rule is an implication of the form A =⇒ B, where Ai (for i ∈ 1, ..., m) and Bj
(for j ∈ 1, ..., n) are attribute-value pairs, indicating that when A occurs, B oc-curs with a certain probability P (B|A), called confidence. Association analysis, although initially developed for market basket analysis problems, is now widely used for transaction data analysis and more recently in sequence analysis to dis-cover what is called episode rules between events (Mannila and Toivonen,1996). Most of the developed algorithms are frequency-oriented, i.e, discover frequent itemsets and episodes first before generating the rules, which leads to a sizable number of discovered associations that are not necessarily significant and inter-esting. Strong but rare associations remain usually undetected, mainly due to frequency constraints set to reduce time complexity. This problem is a major motivation in this thesis and will be discussed further. Book references: (Han et al.,2006;Hastie et al.,2003;Ye,2003).
3. Post-processing
With insufficient ground truth or the lack of it, data mining operations may lead classification and clustering algorithms to discover various models that can explain or describe the data very differently. Furthermore, after a learning system discovers concept models from the training set, their evaluation should take place
on a testing set using several criteria and measures such as classification accuracy, mean square error, correct classification rate, scalibility, etc.
Similarly, association rule mining algorithms are destined to estimate a huge number of associations of which the majority is of low significance and utility. It is vital to analyze results in order to select the best ones to the final users. This has motivated a large number of researchers to develop interestingness measures that are used to evaluate results. Interestingness measures can be assembled into two main categories: Objective and Subjective. Objective interestingness measures are generally probability-based and are usually functions of a 2x2 contingency table. A survey of those measures can be found in (Nada Lavrac et al.,1999;Tan and Kumar,2002) as well as in (Lenca et al.,2004;Ohsaki et al.,2004).
In some cases, the information provided by objective measures might not be suffi-cient to judge if a rule is significant enough to be considered and thus a subjective point of view is needed. A subjective interestingness measure takes into account both the data and the user’s knowledge. Such a measure is appropriate when: (1) the background knowledge of users varies, (2) the interests of the users vary, and (3) the background knowledge of users evolve. Subjective measures cannot be represented by simple mathematical formulas because the user’s knowledge may be expressed in various forms such as visualization, experience, etc. Instead, they are usually incorporated into the mining process.
Although we agree that data mining is a step in the knowledge discovery process, however in reality, the term data mining is used by industry, media and research to describe the whole knowledge discovery process instead of just a step in it. Therefore in this thesis, we choose to adopt the latter view since it broadens the data mining functionality and is more appropriate for the industry-oriented applicative nature of this work.
2.3
Railway Context
The recent leaps in information and communication technologies have revolutionized support techniques for rail equipment maintenance and triggered an evolution in preven-tive maintenance strategies toward more optimized and cost effecpreven-tive solutions. These processes aim to provide longer availability and better reliability of transportation sys-tems. Similar to smart vehicles, commercial trains are being equipped with positioning and communication systems as well as on-board intelligent sensors monitoring various subsystems such as tilt, traction, signalling, pantograph, doors, etc. These sensors pro-vide a real-time flow of spatio-temporal data consisting of georeferenced alarms, called events, which are transferred wirelessly towards centralized data servers where they are stocked and exploited within a specially-conceived data-warehousing and analysis sys-tem called Floating Train Data syssys-tem (FTD). The information extracted from these
2.3 Railway Context
data are used to establish a unified preventive (condition-based) maintenance manage-ment as well as a more-advanced predictive maintenance approach which consists of performing an on-line analysis of the incoming event stream in order to predict and alert the imminent or increased probability of occurrence of severe failure events, i.e., failures requiring immediate corrective maintenance actions, also called target events.
2.3.1 Existing Maintenance Policies
Maintenance costs are a major portion of the total operating costs of all manufacturing or production plants. Depending on the specific industry, these costs can represent between 15 and 60 percent of the costs of goods produced (Mobley,2002). The recent development of microprocessor and computer-based instrumentation that can be used to monitor the operating condition of equipment and systems have provided the means to eliminate unnecessary repairs, prevent catastrophic machine failures and reduce the negative impact of maintenance operations on the profitability of manufacturing and production plants.
To understand what predictive maintenance is, traditional policies should first be considered. Figure 2.1 shows the evolution of maintenance strategies in time. The earliest technique (and the most frequent up-till-now), corrective maintenance (also called Run-to-failure or reactive maintenance), is a simple and straightforward proce-dure which consists of waiting till the failure occurs to replace defected pieces. The main disadvantages of this approach include fluctuant and unpredictable production as well as the high costs of un-planned maintenance operations. The advancement in industrial diagnosis instrumentation led to the emergence of time-driven preventive maintenance policies such as schedule-based preventive maintenance where pieces are replaced before their formally-calculated Mean Time To Failure (MTTF) is attained. In order to efficiently implement this periodic maintenance policy, an operational re-search is required to find the optimal maintenance schedule that can reduce operation costs and increase availability. This scheduling takes into consideration the life cycle of equipment as well as man power and work hours required. In many cases, mainte-nance policies are still based on the maintemainte-nance schedules recommended by the user, which are usually conservative or are only based on qualitative information driven by experience and engineering rationale (Zio,2009). Several approaches were developed to assess the performance of a maintenance policy, especially in case of complicated sys-tems. For instance, in (Marseguerra and Zio,2002;Zio,2013), Monte Carlo simulation is used in order to avoid the introduction of excessively simplifying hypotheses in the representation of the system behavior. This framework was extended in (Baraldi et al.,
2011) by combining it with fuzzy logic in the aim of modelling component degradation in electrical production plants.
Figure 2.1: Evolution of maintenance policies in time
The development of intelligent sensors and condition-assessment tools have paved the way for a condition-based maintenance policy. The operating state of a system is constantly monitored by means of a dedicated monitoring tool. Once degradation is detected, the system is replaced. This method increases the component operational lifetime and availability and allows preemptive corrective actions. On the other hand, it necessitates an increased investment in efficient monitoring equipment as well as in maintenance staff training.
The steady progress of computer hardware technology as well as the affordability and availability of computers, data collection equipment and storage media has reflected a boost in the amount of data stocked by people and firms. However, the abundance of these data without powerful analysis tools has led to data rich but information poor situations where data repositories became data archives that are seldomly visited. The presence of this data has inspired researchers to develop algorithms which automati-cally analyze data in order to find associations or models that can help predict future failures. These algorithms have established what is now called predictive maintenance. Predicting system degradation before it occurs may lead to the prevention or at least the avoidance of bad consequences.
Predictive maintenance can be defined as the measurements which detect the com-mencement of system degradation and thus an imminent breakdown, thereby allowing to control or eliminate causal stressors early enough to avoid any serious deterioration in the component’s physical state. The main difference between predictive maintenance and schedule-based preventive maintenance is that the former bases maintenance needs on the actual condition of the machine rather than on some predefined schedule and hence it is condition-based and not time-based. For example, the VCB (Vacuum Cir-cuit Breaker), whose role is to isolate the power supply of high voltage lines when there is a fault or need for maintenance is replaced preventively every 2 years without any concern for its actual condition and performance capability. It is replaced simply be-cause it is time to. This methodology would be analogous to a time-based preventive maintenance task. If, on the other hand, the operator of the train, based on formerly
2.3 Railway Context
acquired experience, have noticed some particular events or incidents which frequently precede the failure of the VCB, then, after insuring that safety procedures are being respected, he/she may be able to extend its replacement until these events or incidents appear, and thus optimizing the usage of material and decreasing maintenance costs. Figure 2.2 shows a comparison between maintenance policies in terms of total main-tenance cost and total reliability. Predictive mainmain-tenance, in cases where it can be applied efficiently, is the least expensive and assures an optimal reliability with respect to other policies.
Figure 2.2: Comparison of maintenance policies in terms of total maintenance costs and total reliability
2.3.2 Data mining applied to the railway domain: A survey
The mounting socio-economic demand on railway transportation is a challenge for rail-way network operators. The availability and reliability of the service has imposed itself as the main competitivity arena between railway manufacturer moguls. Decision-making for maintenance and renewal operations is mainly based on technical and eco-nomic information as well as knowledge and experience. The instrumentation of railway vehicles as well as infrastructure by smart wireless sensors has provided huge amounts of data that, if exploited, might reveal some important hidden information that can contribute to enhancing the service and improving capacity usage. For this reason, recent years have witnessed an increasing uprise in applicative research and projects in this context. Research fields receiving the biggest focus were railway infrastructure and railway vehicles. Other fields include scheduling and planning as well as predicting train delays to increase punctuality. All of which we discuss below.
1. Monitoring railway infrastructure
Railway infrastructure maintenance is a major concern for transportation compa-nies. Railway infrastructure is constantly subjected to traffic and environmental effects that can progressively degrade track geometry and materials. It is vital to
discover these degradations at early stages to insure safety as well as comfort of the service. There are three main systems that can be used for inspection ( Bocci-olone et al.,2002,2007;Grassie,2005): Portable manual devices (which can give information on a relatively low length of track, operated by maintenance techni-cians), Movable devices (which are fully mechanically driven and can cover long distances), and very recently the implementation of sensors on active commercial or probe vehicles to perform various types of measures in order to identify track irregularities. The advantage of the latter system is that data can be collected more frequently and at anytime.
Several tools and methods exploiting collected data for infrastructure condition inspection (tracks, track circuit, rail switches and power supply system) have been proposed in the recent years. Table2.1summarizes some of the recent works.
Reference Subsystem
con-cerned
Methodologies Used
(Insa et al., 2012), (Vale and Lurdes, 2013), ( An-drade and Teixeira,2012), (Weston et al., 2006,
2007), (Rhayma et al.,
2011, 2013),(Bouillaut et al.,2013), (Yella et al.,
2009), (Fink et al.,2014)
Track defects Statistical methods, Stochastic probabilistic model, Bayesian Networks, Probabilistic ap-proaches, Stochastic finite elements methods, Monte-Carlo simulation procedure, Bayesian networks, Multilayer feedfor-ward neural networks based on multi-valued neurons, Pattern recognition, Classification (Kobayashi et al., 2013; Kojima et al., 2005,2006; Matsumoto et al., 2002; Tsunashima et al.,2008) Track inspec-tion using probe vehicles
Signal processing
(Oukhellou et al., 2010), (Chen et al., 2008), ( Lin-Hai et al.,2012)
Track circuit Neural networks and decision tree classifiers, Neuro-fuzzy sys-tem, Genetic algorithm
(Chamroukhi et al.,2010), (Sam´e et al.,2011)
Rail switches Mixture model-based approach for the clustering of univari-ate time series with changes in regime, Regression model (Cosulich et al., 1996),
(Wang et al.,2005), (Chen et al.,2007)
Power supply sys-tem
Probabilistic approach based on stochastic reward nets, Radial basis neural networks, finite ele-ment analysis with Monte Carlo simulation, Fault Tree Analysis
Table 2.1: Examples of recent research work along with the methodologies used for the condition inspection of various train infrastructure subsystems
2.3 Railway Context
2. Monitoring railway rolling stock
The recent years have witnessed the development of numerous approaches for the monitoring of railway rolling stock material. One of the subsystems receiving a lot of focus is doors. In general, doors of public transportation vehicles are subject to exhaustive daily use enduring a lot of direct interactions with passengers (pushing and leaning on the doors). It is important to note that malfunctions encountered with doors are usually due to mechanical problems caused by the exhaustive use of components. Each train vehicle is equipped with two doors from each side which can be either pneumatic or electric.
Reference Subsystem Methodologies
(Miguelanez et al., 2008), (Lehrasab, 1999; Lehrasab et al., 2002), (Roberts et al., 2002), (Dassanayake, 2002), (Dassanayake et al., 2009),(Han et al.,2013)
Doors Ontology-based methods, Neural networks, Classification, fuzzy logic, statistical learning
(Bruni et al.,2013) Axle Statistical methods (Randall and Antoni,
2011),(Capdessus et al.,
2000),(Zheng et al.,
2013),(Antoni and Ran-dall, 2006),(Pennacchi et al.,2011)
Rolling element bearings
Envelope analysis, Squared enve-lope spectrum, 2nd order cyclo-stationary analysis, Spectral kur-tosis , Empirical mode decompo-sition, Minimum entropy decon-volution
(Wu and Thompson,
2002),(Pieringer and Kropp, 2008),(Belotti et al., 2006),(Jia and Dhanasekar, 2007),(Wei et al., 2012),(Liang et al.,
2013)
Wheels Dynamic modelling, Signal
processing, Wavelet transform methods, Fourier Transform, Weigner-Villa Transform
Table 2.2: Examples of recent research work along with the methodologies used for the condition inspection of various train vehicle subsystems
Other subsystems receiving focus are the axle and the rolling element bearings since they are the most critical components in the traction system of high speed trains. Monitoring their integrity is a fundamental operation in order to avoid catastrophic failures and to implement effective condition based maintenance strategies. Generally, diagnosis of rolling element bearings is usually performed by analyzing vibration signals measured by accelerometers placed in the prox-imity of the bearing under investigation. Several papers have been published
on this subject in the last two decades, mainly devoted to the development and assessment of signal processing techniques for diagnosis.
With the recent significant increases of train speed and axle load, forces on both vehicle and track due to wheel flats or rail surface defects have increased and critical defect sizes at which action must be taken are reduced. This increases the importance of early detection and rectification of these faults. Partly as a result of this, dynamic interaction between the vehicle, the wheel, and the rail has been the subject of extensive research in recent years.
Table 2.2 resumes some of the important works on train vehicle subsystems in the recent years.
3. Other projects related to railway predictive maintenance
Numerous projects have been developed in the railway domain that are not only related to railway infrastructure and vehicles but to other applications as well. For example, in (Ignesti et al.,2013), the authors presented an innovative Weight-in-Motion (WIM) algorithm aiming to estimate the vertical axle loads of railway vehicles in order to evaluate the risk of vehicle loading. Evaluating constantly the axle load conditions is important especially for freight wagons, which are more susceptible to be subjected to risk of unbalanced loads which can be extremely dangerous both for the vehicle running safety as well as for infrastructure in-tegrity. This evaluation could then easily identify potentially dangerous over-loads or defects of rolling surfaces. When an overload is detected, the axle would be identified and monitored with non-destructive controls to avoid and prevent the propagation of potentially dangerous fatigue cracks. Other examples include the work in (Liu et al.,2011), where the Apriori algorithm is applied on railway tunnel lining condition monitoring data in order to extract frequent association rules that might help enhance the tunnel’s maintenance efforts. Also, in (Vettori et al.,2013), a localization algorithm is developed for railway vehicles which could enhance the performances, in terms of speed and position estimation accuracy, of the classical odometry algorithms.
Due to the high cost of train delays and the complexity of schedule modifications, many approaches were proposed in the recent years in an attempt to predict train delays and optimize scheduling. For example, in (Cule et al., 2011), a closed-episode mining algorithm, CLOSEPI, was applied on a dataset containing the times of trains passing through characteristic points in the Belgian railway net-works. The aim was to detect interesting patterns that will help improve the total punctuality of the trains and reduce delays. (Flier et al.,2009) tried to discover dependencies between train delays in the aim of supporting planners in improving timetables. Similar projects were carried out in the Netherlands (Goverde,2011;
Nie and Hansen,2005;Weeda and Hofstra,2008), Switzerland (Flier et al.,2009), Germany (Conte and Shobel,2007), Italy (De Fabris et al., 2008) and Denmark
2.4 Applicative context of the thesis: TrainTracer
(Richter, 2010), most of them based on association rule mining or classification techniques.
In the next section, we present the applicative context of this thesis.
2.4
Applicative context of the thesis: TrainTracer
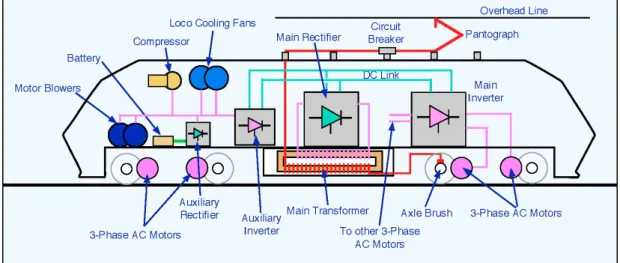
TrainTracer is a state-of-the-art centralized fleet management (CFM) software con-ceived by Alstom to collect and process real-time data sent by fleets of trains equipped with on-board sensors monitoring various subsystems such as the auxiliary converter, doors, brakes, power circuit and tilt. Figure2.3 is a graphical illustration of Alstom’s TrainTracerTM. Commercial trains are equipped with positioning (GPS) and com-munications systems as well as on-board sensors monitoring the condition of various subsystems on the train and providing a real-time flow of data. This data is transferred wirelessly towards centralized servers where it is stocked, exploited and analyzed by the support team, maintainers and operators using a secured intranet/internet access to provide both a centralized fleet management and unified train maintenance (UFM).
Figure 2.3: Graphical Illustration of Alstom’s TrainTracerTM. Commercial trains are equipped with positioning (GPS) and communications systems as well as onboard sensors monitoring the condition of various subsystems on the train and providing a real-time flow of data. This data is transferred wirelessly towards centralized servers where it is stocked and exploited.
2.4.1 TrainTracer Data
The real data on which this thesis work is performed was provided by Alstom trans-port, a subsidiary of Alstom. It consists of a 6-month extract from the TrainTracer database. This data consists of series of timestamped events covering the period from July 2010 to January 2011. These events were sent by the Trainmaster Command Con-trol (TMCC) of a fleet of pendolino trains that are currently active. Each one of these events is coupled with context variables providing physical, geographical and technical information about the environment at the time of occurrence. These variables can be either boolean, numeric or alphabetical. In total, 9,046,212 events were sent in the 6-month period.
Figure 2.4: Design of a traction-enabled train vehicle (http://railway-technical.com)
• Subsystems
Although all events are sent by the same unit (TMCC) installed on the vehicles, they provide information on many subsystems that vary between safety, electrical, mechanical and services (consider figure2.4). There are 1112 distinct event types existing in the data extract with varying frequencies and distributions. Each one of these event types is identified by a unique numerical code.
• Event Criticality Categories
Events belonging to the same subsystem may not have the same critical impor-tance. Certain events can indicate normative events (periodic signals to indicate a functional state), or are simply informative (error messages, driver information messages) while others can indicate serious failures, surpass of certain thresholds whose attributes were fixed by operators or even unauthorized driver actions. For this reason, events were divided by technical experts into various intervention cat-egories describing their importance in terms of the critical need for intervention.
2.4 Applicative context of the thesis: TrainTracer
The most critical category is that of events indicating critical failures that require an immediate stop/slow down or redirection of the train by the driver towards the nearest depot for corrective maintenance actions. Example: the ”Pantograph Tilt Failure” event. These events require high driver action and thus we refer to their category by “Driver Action High”.
• Target Events
As mentioned before, events are being sent by sensors monitoring subsystems of diverse nature: passenger safety, power, communications, lights, doors, tilt and traction etc. Among all events, those requiring an immediate corrective maintenance action are considered as target events, that is mainly, all “Driver Action High” events. In this work, we are particularly interested in all subsystems related to tilt and traction. The tilt system is a mechanism that counteracts the uncomfortable feeling of the centrifugal force on passengers as the train rounds a curve at high speed, and thus enables a train to increase its speed on regular rail tracks. The traction system is the mechanism responsible for the train’s movement. Railways at first were powered by steam engines. The first electric railway motor did not appear until the mid 19th century, however its use was limited due to the high infrastructure costs. The use of Diesel engines for railway was not conceived until the 20th century, but the evolution of electric motors for railways and the development of electrification in the mid 20th century paved the way back for electric motors, which nowadays, powers practically all commercial locomotives (Faure, 2004; Iwnicki, 2006). Tilt and traction failure events are considered to be among the most critical, as they are highly probable to cause a mandatory stop or slowdown of the train and hence impact the commercial service and induce a chain of costly delays in the train schedule.
In the data extract under disposal, Tilt and Traction driver action high failure events occur in variable frequencies and consist a tiny portion of 0.5% of all events. Among them, some occur less than 50 times in the whole fleet of trains within the 6-month observation period.
2.4.2 Raw data with challenging constraints
In order to acquire a primary vision of the data and to identify the unique charac-teristics of target events, a graphical user interface (GUI) was developed using Matlab environment. This interface enabled the visualization of histograms of event frequencies per train unit as well as in the whole data and provided statistics about event counts and inter-event times (Figure2.5).
Figure 2.5: GUI designed for data vi-sualization, implemented in Matlab. It enabled the visualization, for a selected event and train unit, of various his-tograms and plots, along with various statistics concerning counts and inter-event times
Figure 2.6: GUI designed for data vi-sualization, implemented in Matlab. It enabled the request and visualization, for a selected target event T, of var-ious histograms and plots, along with various statistics concerning events and their inter-event times
Another graphical interface was developed by a masters degree intern ( Randria-manamihaga,2012) working on the same data and was also used to visualize the en-semble of sequences preceding the occurrences of a given target event. This interface is shown in Figure2.6. Figure 2.7is one of many examples of data visualization we can obtain. In this figure, we can visualize a sequence of type (ST, tT − t, tT) where ST is
2.4 Applicative context of the thesis: TrainTracer
Figure 2.7: Example of a visualized sequence, after request of target event code 2001. The y-axis refers to subsystems, the colors represent different intervention categories and the length of each event designate its count
Both tools developed to visualize data lead to the following interpretation: many obstacles are to be considered and confronted, namely the rarity and redundancy of events.
• Rarity:
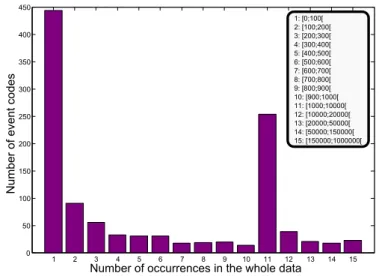
The variation in event frequencies is remarkable. Some events are very frequent while others are very rare. Out of the 1112 event types existing in the data, 444 (≈ 40%) have occurred less than 100 times on the fleet of trains in the whole 6-month observation period (see Figure2.8). These events, although rare, render the data mining process more complex.
1 2 3 4 5 6 7 8 9 10 11 12 13 14 15 0 50 100 150 200 250 300 350 400 450 1: [0;100[ 2: [100;200[ 3: [200;300[ 4: [300;400[ 5: [400;500[ 6: [500;600[ 7: [600;700[ 8: [700;800[ 9: [800;900[ 10: [900;1000[ 11: [1000;10000[ 12: [10000;20000[ 13: [20000;50000[ 14: [50000;150000[ 15: [150000;1000000[ Nu m be r of eve nt co de s
Number of occurrences in the whole data
Figure 2.8: Histogram of event frequencies in the TrainTracer data extract under dis-posal
• Redundancy:
Another major constraint is the heavy redundancy of data. A sequence w ↓ [{A}] of the same event A is called redundant (also called bursty), see Figure 2.9, if in a small lapse of time (order of seconds for example), the same event occurs multiple times. More formally, if w ↓ [{A}] = h (A, t1), (A, t2), . . . , (A, tn) i is a
sequence of n A events subject to a burst, then
∃ t = tf usion such as ∀ (i, j) ∈ {1, . . . , n}2 , | ti− tj| ≤ tf usion (2.1)
The reasons to why these bursts occur are many. For example, the same event can be detected and sent by sensors on multiple vehicles in nearly the exact time. It is obvious that only one of these events needs to be retained since the others do not contribute with any supplementary useful information. These bursts might occur due to emission error caused by a hardware or software failure, as well as reception error caused by similar factors.
2.4 Applicative context of the thesis: TrainTracer
Figure 2.10 illustrates data bursts in a sequence. We can identify two types of bursts. The first type consists of a very dense occurrence of multiple types of events within a short time lapse. Such bursts can occur normally or due to a signalling/reception error. The second type on the other hand consists of a very dense occurrence of a single event type within a short period of time, usually due to a signalling or reception error as well (event sent multiple times, received multiple times). Bursty events can be generally identified by a typical form of the histogram of inter-event times depicted in Figure2.11. This latter has a peak of occurrences (usually from 0 to 15 seconds) that we can relate to bursts. For example, 70% of all the occurrences of the code 1308 1 (an event belonging to category 4 and appears in the data 150000 times) are separated by less than one second!
Figure 2.10: Illustration of the two types of bursts
Nu m be r of O ccu rr en ces
Inter-event times (seconds)
0 15 320 -10
Figure 2.11: Histogram of inter-event times of a bursty event (Randriamanamihaga,
2012)
1
2.4.3 Cleaning bursts
Several pre-treatment measures have been implemented to increase the efficiency of data mining algorithms to be applied. For instance, 13 normative events that are also very frequent were deleted from the data. Erroneous event records with missing data or outlier timestamps were also neglected in the mining process. The work by (Randriamanamihaga,2012) during a masters internship on the TrainTracer data has tackled the bursts cleaning problem and applied tools based on finite probabilistic mixture models as well as combining events of the same type occurring very closely in time (≤ 6 seconds, keeping the first occurrence only) to decrease the number of bursts. This cleaning process has decreased the size of data to 6 million events (instead of 9.1), limited the number of distinct event codes to 493 (instead of 1112), and the number of available target events to 13 (instead of 46). Although a significant proportion of data was lost, the quality of the data to be mined was enhanced, which leads to a better assessment of applied algorithms and obtained results. For this reason, the resulting “cleaned” data was used in this thesis work.
2.5
Positioning our work
In the railway domain, instrumented probe vehicles that are equipped with dedicated sensors are used for the inspection and monitoring of train vehicle subsystems. Main-tenance procedures have been optimized since then so that to rely on the operational state of the system (Condition-based maintenance) instead of being schedule-based. Very recently, commercial trains are being equipped with sensors as well in order to perform various measures. The advantage of this system is that data can be collected more frequently and anytime. However, the high number of commercial trains to be equipped demands a trade-off between the equipment cost and their performance in order to install sensors on all train components. The quality of these sensors reflects directly on the frequency of data bursts and signal noise, both rendering data more challenging to analyze. These sensors provide real-time flow of data consisting of geo-referenced events, along with their spatial and temporal coordinates. Once ordered with respect to time, these events can be considered as long temporal sequences that can be mined for possible relationships.
This has created a necessity for sequential data mining techniques in order to derive meaningful associations (association and episode rules) or classification models from these data. Once discovered, these rules and models can then be used to perform an on-line analysis of the incoming event stream in order to predict the occurrence of target events, i.e, severe failures that require immediate corrective maintenance actions.
The work in this thesis tackles the above mentioned data mining task. We aim to investigate and develop various methodologies to discover association rules and
clas-2.5 Positioning our work
sification models which can help predict rare failures in sequences. The investigated techniques constitute two major axes: Association analysis, which is temporal, and aims to discover association rules of the form A −→ B where B is a failure event using significance testing techniques (T-Patterns, Null models, Double Null models) as well as Weighted association rule mining (WARM)-based algorithm to discover episode rules, and Classification techniques, which is not temporal, where the data sequence is transformed using a methodology that we propose into a data matrix of labelled obser-vations and selected attributes, followed by the application of various pattern recogni-tion techniques, namely K-Nearest Neighbours, Naive Bayes, Support Vector Machines and Neural Networks to train a static model that will help predict failures.
We propose to exploit data extracted from Alstom’s TrainTracer database in order to establish a predictive maintenance methodology to maximize rolling stock availability by trying to predict failures prior to their occurrence, which can be considered as a technological innovation in the railway domain. Once association rules or classification models are found, both can then be implemented in rule engines analyzing arriving events in real time in order to signal and predict the imminent arrival of failures. In the analysis of these sequences we are interested in rules which help predict tilt and traction “driver action high” failure events, which we consider as our target events.
To formalize the problem, we consider the input data as a sequence of events, where each event is expressed by a unique numerical code and an associated time of occurrence.
Definition 2.5.1. (event) Given a set E of event types, an event is defined by the pair (R, t) where R ∈ E is the event type (code) and t ∈ <+ its associated time of occurrence, called timestamp.
Definition 2.5.2. (event sequence) An event sequence S is a triple (S, Ts, Te), where
S = {(R1, t1), (R2, t2), ..., (Rn, tn)} is an ordered sequence of events such that Ri ∈
E ∀i ∈ {1, ..., n} and Ts≤ t1 ≤ tn≤ Te.
2.5.1 Approach 1: Association Analysis
Definition 2.5.3. (Association rule) We define an association rule as an implication of the form A −→ B, where the antecedent and consequent are sets of events with A ∩ B = φ.
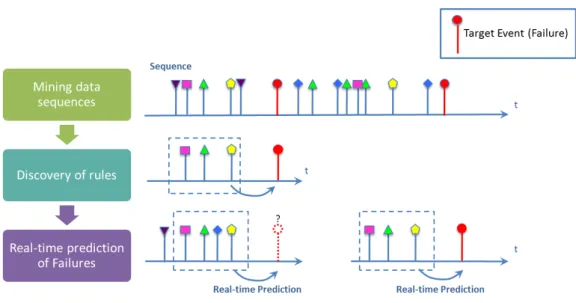
Figure 2.12: A graphical example of mining data sequences for association rules. Discovered rules are then used for real-time prediction of failures
Consider the Figure2.12, in the analysis of sequences we are interested in discovering associations between normal events and target events. Once such relationships are discovered, they can be integrated in an online rule engine monitoring the incoming event stream, hence allowing the prediction of target events (failures). Once a target event is predicted, the maintenance teams are alerted to initiate predictive maintenance procedures. In order for this prediction to be effective, it is subject to two important constraints:
• First, target events should be predicted within a time delay that should be suf-ficient enough to allow logistic and maintenance measures to be taken, such as directing a train towards a stand-by maintenance team in a nearby depot, thus avoiding the costly consequences of a train breaking down in-between stations. This time delay is called warning time (See Figure 2.13).
Figure 2.13: An illustration of warning time prior to the occurrence of a target event
• Secondly, prediction accuracy should be high enough due to high intervention costs in the case of false predictions. The whole process is depicted in Figure2.14 below.
2.5 Positioning our work
Figure 2.14: Mining association rules for predictive maintenance. Discovering significant as-sociations between events and validating their abidance to the warning time and accuracy con-straints leads to association rules. These rules are validated by railway experts and integrated in online monitoring tools to predict target events.
However, due to the rareness of target events, the existing sequence mining tech-niques cannot be used since they are designed to discover frequent patterns and associa-tions between frequent events and not rare ones. Rare events would be directly pruned out in the process and any correlation between them and other frequent/infrequent events would remain undiscovered. This problem was the main motivation in orienting and structuring the theoretical work of this thesis.
This thesis hence tackles the problem of mining temporal sequences for association rules between infrequent events, an important problem that has not received much aca-demic attention until recently. In data mining literature, the use of the term “pattern” is attributed to the repetitive series of correlated events discovered in a sequence and mostly signifies frequent patterns. However, since in this thesis we are interested in infrequent patterns, we preferred using the term association and episode rules.
2.5.2 Approach 2: Classification
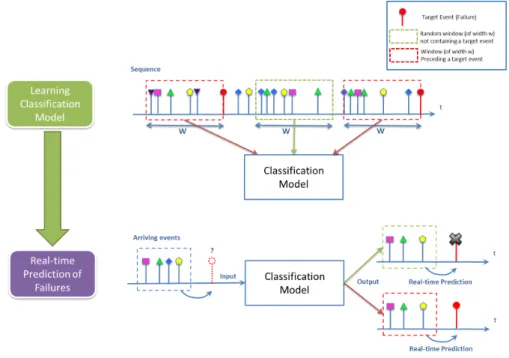
The second approach which we will adopt is pattern recognition and classification meth-ods. Figure2.15illustrates the process. In this approach we neglect the temporal aspect of the sequence and transform it into a data matrix of labelled observations and se-lected attributes. For each occurrence of a target event, events observed within a time window of width w preceding this event are considered as an observation and given a label 1. This window is equivalent to a bad window followed by a failure. Random windows are chosen and constitute the good windows each with a label 0. A random window is omitted if it contained a failure event. Since the training data are labelled, the problem in hand is a supervised learning classification problem. All observations are used to train and learn a classification model using multiple pattern recognition methods, namely K-Nearest Neighbours, Naive Bayes, Support Vector Machines and Neural Networks.
Once the classification model is learned, it is tested using a cross validation tech-nique. Events arriving in real time are considered as an input attribute set (x) to the
classification model which outputs a class label 1 if a nearby occurrence of a target event is predicted and a label 0 if not.
Figure 2.15: A graphical illustration of how a classification model can be trained from a data sequence and then used to predict the near-by occurrence of failures
At the end, the performance of both approaches: Association analysis and Clas-sification methods are confronted and compared.