HAL Id: tel-02614337
https://tel.archives-ouvertes.fr/tel-02614337
Submitted on 20 May 2020HAL is a multi-disciplinary open access archive for the deposit and dissemination of sci-entific research documents, whether they are pub-lished or not. The documents may come from
L’archive ouverte pluridisciplinaire HAL, est destinée au dépôt et à la diffusion de documents scientifiques de niveau recherche, publiés ou non, émanant des établissements d’enseignement et de
High-frequency trading : statistical analysis, modelling
and regulation
Pamela Saliba
To cite this version:
Pamela Saliba. High-frequency trading : statistical analysis, modelling and regulation. Trading and Market Microstructure [q-fin.TR]. Université Paris Saclay (COmUE), 2019. English. �NNT : 2019SACLX044�. �tel-02614337�
délisation et régulation
High-frequency trading : Statistical
analysis, modelling and regulation
Thèse de doctorat de l'Université Paris-Saclay
préparée à l’Ecole Polytechnique
École doctorale n°574 Ecole doctorale de mathématiques Hadamard
(EDMH)
Spécialité de doctorat : Mathématiques appliquées
Thèse présentée et soutenue à Paris, le 18 juillet 2019 par
Pamela Saliba
Composition du Jury : Nicole El Karoui
Professeur émérite, Sorbonne Universités (LPSM) Présidente Jean-Philippe Bouchaud
Responsable de la recherche, Capital Fund Management Rapporteur Alain Chaboud
Economiste principal, Federal Reserve Bank Rapporteur Frédéric Abergel
Professeur, CentraleSupélec (MICS) Examinateur
Alexandra Givry
Directrice de la Surveillance des Marchés,
Autorité des Marchés Financiers Examinatrice
Olivier Guéant
Professeur, Université Paris I Panthéon Sorbonne (CES) Examinateur Charles-Albert Lehalle
Chercheur senior, Capital Fund Management Examinateur Mathieu Rosenbaum
Professeur, Ecole Polytechnique (CMAP) Directeur de thèse
N
N
T
: 2
01
9SAC
LX0
44
THÈSE
présentée pour obtenir
LE GRADE DE DOCTEUR EN MATHÉMATIQUES APPLIQUÉES
DE L’ÉCOLE POLYTECHNIQUE
par
Pamela
S
ALIBAHigh-frequency trading:
Statistical analysis, modelling
and regulation
Soutenue le 18 juillet 2019 devant un jury composé de :
Nicole
E
L KAROUISorbonne Universités
Présidente
Jean-Philippe
B
OUCHAUDCapital Fund Management
Rapporteur
Alain
C
HABOUDFederal Reserve Bank
Rapporteur
Fabrizio
L
ILLOScuola Normale Superiore di Pisa
Rapporteur
Frédéric
A
BERGELCentraleSupélec
Examinateur
Alexandra
G
IVRYAutorité des Marchés Financiers
Examinatrice
Olivier
G
UÉANTUniversité Paris I Panthéon Sorbonne Examinateur
Charles-Albert
L
EHALLECapital Fund Management
Examinateur
Remerciements
Été 2014, j’hésitais énormément entre deux masters di érents, l’un appliqué à la Ænance (master El Karoui) et l’autre à la biologie. A l’époque, j’ignorais encore complètement le monde des mathématiques Ænancières, et face à une telle hésitation, j’ai contacté Mathieu Rosenbaum, le co-responsable du master El Karoui, pour obtenir des renseignements. J’ai été agréablement surprise par sa disponibilité, son objectivité et son implication pour m’orienter vers la bonne voie. Finalement, il a réussi, avec délicatesse, à m’introduire au monde des mathématiques Ænancières, devenant par la suite mon directeur de thèse. Mathieu (ou Prof Rosenbaum), c’est avec toi que j’ouvre le bal des remerciements non par coutume mais par conviction. Je te remercie pour ta bienveillance, ta disponibilité malgré tes nombreuses occupations, et surtout pour ta positivité et tes encouragements tout au long de ma thèse. Au-delà de ce que tu m’as apporté sur le plan scientiÆque, tu m’as transmis ta curiosité qui touche plusieurs centres d’intérêts à la fois : recherche, histoire, art, séries sans oublier ta passion pour les langues . . . domaines qu’à ma grande surprise, tu maîtrises tous aussi bien l’un que l’autre. Mathieu, sans toi cette thèse n’aurait jamais vu le jour, merci inÆniment.
Je tiens à remercier Nicolas Megarbane qui a encadré une partie de ma thèse à l’AMF avant qu’il se lance dans la fondation de sa propre startup. Nicolas, merci beaucoup pour le temps que tu m’as consacré et pour ta volonté continue de me tirer vers le haut malgré nos divergences d’avis et nos petits désaccords professionnels. J’ai énormément apprécié nos longs échanges sur le voyage, photographie, philosophie et plein d’autres sujets. EnÆn, je suis sûre que ton esprit novateur, ta ténacité et ta rigueur se reØèteront parfaitement dans ta startup ! Je suis très reconnaissante envers Charles-Albert Lehalle avec qui j’ai eu tout au long de ma thèse de nombreuses et enrichissantes discussions scientiÆques. Charles, merci pour notre collaboration scientiÆque, pour tes précieux et brillants conseils livrés toujours avec humilité, et pour ta disponibilité même en plein milieu de tes vacances. Merci également pour avoir accepté d’être membre du jury de ma soutenance.
Je tiens à remercier Agostino Capponi et Othmane Mounjid avec qui j’ai eu la chance d’avoir des collaborations scientiÆques et des échanges d’idées très fructueux.
Je remercie chaleureusement Jean-Philippe Bouchaud, Alain Chaboud et Fabrizio Lillo pour avoir accepté d’être les rapporteurs de ma thèse. Merci pour le temps énorme qu’ils m’ont consacré, leur lecture attentive, leur intérêt pour ma recherche et surtout pour leurs commen-taires très constructifs et encourageants. Je remercie particulièrement Jean-Philippe Bouchaud qui, lors de nos rares mais si enrichissantes discussions, m’a impressionnée par son humil-ité et sa grande culture à la fois scientiÆque et artistique (et surtout sa connaissance des artistes et cinéastes libanais). Tous mes remerciements à Alain Chaboud pour son accueil très chaleureux à la FED, pour m’avoir donné l’opportunité de présenter mes travaux de recherche et d’échanger avec lui ainsi qu’avec d’autres économistes de cette institution, et pour l’agréable
visite de Washington en sa compagnie.
Je remercie sincèrement Frédéric Abergel, Nicole El Karoui et Olivier Guéant, qui me font l’honneur de participer au jury de ma soutenance. Je suis particulièrement touchée par la présence de Nicole El Karoui qui, lors des quelques échanges que j’ai eus avec elle au cours du master, est rapidement devenue «la Ægure féminine scientiÆque» inspirante. J’en proÆte pour la remercier pour son implication très active dans l’encouragement des femmes à s’orienter vers les Ælières scientiÆques, une cause qui m’est personnellement très chère.
Je mesure la chance que j’ai eue d’avoir pu bénéÆcier des connaissances de mes professeurs du master, en particulier Emmanuel Gobet, Gilles Pages et Nizar Touzi.
Je suis très reconnaissante envers tous mes collègues de l’AMF à qui je présente mes excuses de ne pas pouvoir adresser des remerciements personnels à chacun d’entre eux. Je remercie premièrement Philippe Guillot capable de transformer toute problématique Ænancière en une étude de cas vélo. Au-delà de son humilité, c’est particulièrement cette aisance dans la vulgarisation et la communication de ses idées, si enrichissantes et éclairantes, que j’apprécie énormément chez lui. Je remercie également Alexandra Givry qui derrière son air sérieux et in-telligent (aucun doute là-dessus) se cache une personne dotée de valeurs humaines que j’admire énormément. Alexandra, merci de m’avoir soutenue pendant les moments di ciles et d’avoir accepté d’être membre de mon jury. Je remercie également Julien Leprun pour sa légendaire courtoisie, sa lumineuse culture, et surtout sa grande Øexibilité qui m’a permis d’e ectuer ma thèse dans les meilleures conditions possibles. J’adresse mes remerciements à toute l’équipe d’ingénierie Ænancière de l’AMF : Alexis pour ses blagues de «très haut niveau» et pour notre complicité amicale, Antoine pour ses conseils champagne et technologie, Franck R. pour ses petit cadeaux très expressifs (oui oui . . . je parle bien des stylos en forme d’armes). Iris, je te remercie «en tant que personne et en tant qu’amie» pour ta bonne humeur continue et ta très grande bienveillance, Joshua pour nos gentilles taquineries mutuelles, Martin pour tes services de conseil dans la langue de Molière. EnÆn, ce serait pêcher de ne pas remercier Franck L. pour toutes ses photos «spontanées», Olivier (ex-AMF) et Pascale (à qui je souhaite un très bon rétablissement) pour nos petites soirées AMF les vendredis et pour tous leurs sages conseils. Mes grands remerciements vont aux membres de la Team Rosenbaum. Je mentionne en particulier Aditi, dont l’arrivée au sein de la Team, très masculine à l’époque, fut vécue par moi comme un événement victorieux. Aditi, merci pour ta bonne humeur et ton air exotique très new-yorkais. Je tiens à remercier également les inséparables Bastien et Paul pour leur dynamisme, leur bienveillance et surtout leur joie de vivre. Je ne peux surtout pas oublier de remercier Omar pour l’ambiance très agréable qu’il a su instaurer à travers ses inlassables petites taquineries. Omar, Saad, je saurai me souvenir de votre dévouement sans faille dans le transport de mes valises lors de notre conférence à Venise ;) Une pensée particulière à Emel, Marcos et Mehdi.
Je remercie égalemement tout le secrétariat du CMAP, notamment Maud Cadiz-Pena, Nasséra Naar et Alexandra Noiret pour leur disponibilité et leur aide.
Il me tient à coeur de remercier Aline Lefebvre-Lepot et Aldjia Mazari, responsables des TPs dont j’ai été chargée dans le cadre de mes missions d’enseignement à l’Ecole Polytechnique. Merci pour votre dévouement pour l’enseignement et votre Øexibilité pendant les périodes les plus chargées. Martin et Mathilde, ce fut un plaisir de collaborer avec vous, merci pour votre entraide et votre esprit d’équipe.
Je souhaiterais remercier également Dr (Karam) Fayad que j’ai contacté la première fois via
Messenger (merci Facebook !) quand j’étais encore au Liban. C’est un ami en commun qui m’a
transmis son contact (eh oui, le bouche à oreille à la libanaise fonctionne bien Ænalement) aÆn de me renseigner sur la vie et les études en France. Karam, merci pour tous les renseignements que tu m’as donnés à l’époque et surtout pour m’avoir présentée auprès de mes docteurs favoris Dr (Marwa) Banna, Dr (Safaa) El Sayed et Dr (Pierre) Youssef. Je vous remercie tous pour votre amitié, vos conseils, votre soutien et pour avoir supporté mes interminables hésitations. Je tiens à remercier également mes amis à Paris, Charbel, Collince, Eliane, Hassina, Jinane, Sandrine, Steven, Xavier et Zorba pour leur soutien continu. Je remercie mes amies au Liban, Josiane, Stéphanie et Vola, mon amie aux US Marie-José, et mon amie sans situation géographique Æxe Lise pour leur disponibilité malgré les milliers de kilomètres qui nous séparent (merci Whatsapp au passage).
Je tiens à exprimer ma gratitude envers mes deux pays: le Liban, mon pays d’origine, et la France, mon pays d’adoption (drôle de coincidence, j’ai été naturalisée le 18 juillet 2018, soit exactement un an avant la date de la soutenance de ma thèse). C’est au Liban que j’ai suivi l’intégralité de ma formation scolaire et une partie de ma formation universitaire. J’en proÆte pour exprimer ma reconnaissance envers le Collège de la Sainte Famille Française ( Jounieh et Fanar) pour son haut niveau accadémique, et l’Université Libanaise ainsi que ses professeurs pour leur implication dans le rayonnement des sciences malgré les moyens Ænanciers très limités qui sont mis à leur disposition. C’est en France que j’ai poursuivi mes études supérieures, à Paris 6 pour mon master et à l’Ecole Polytechnique pour mon doctorat. Comment ne pas être reconnaissante envers ce pays qui a o ert avec générosité à la simple étrangère que j’étais encore, l’opportunité d’accéder aux meilleures formations universitaires du monde sans aucune attente en retour ?
Permettez-moi de m’attarder un peu pour remercier ma famille (je vous préviens, nous sommes nombreux !). Je commence par remercier mes frères et sœur par ordre d’âge décroissant pour éviter tout sentiment d’envie. David Fadi, son ambition l’a poussé à quitter le Liban alors que je n’avais encore que quelques mois. Mais depuis mon arrivée à Paris en Septembre 2013, il a réussi à surcompenser tous les moments que nous n’avons pas partagés plus jeunes. Ceci en m’appelant presque quotidiennement pour prendre des nouvelles sur le déroulement de mon master, puis de mon doctorat. David Fadi, merci pour ta GRANDE bienveillance que je n’ai jamais réussi à tarir malgré mes tentatives persistantes et continues. Je ne peux remercier mon frère aîné sans remercier son épouse Darine pour avoir été comme une deuxième soeur pour moi depuis mon arrivée en France. Darine, merci pour ton amabilité, tes plats libanais savoureux, et surtout pour nos soirées de discussions interminables! Chadi, merci pour ton écoute maîtrisée avec art pendant les moments les plus di ciles et les plus joyeux, ta mémoire infaillible, et surtout tes réponses qui se réduisaient parfois à un silence total . . . mais un silence si parlant. Chadi, par pitié, pas de scoops ! Plus jeune, j’étais inséparable de Hadi qui m’a appris à nager, à conduire et bien évidemment quelques petites prises de Karaté toujours très importantes à maîtriser. Je lui suis reconnaissante malgré le manque de douceur de ses modes d’apprentissage. Il est resté Ædèle à ce rôle d’enseignant qui ressurgit face à tout échec ou succès à travers ses fameuses expressions : «Bravo Pam», «Courage Pam» et «Go forward». Hadi, merci pour tes mots doux et encourageants, à l’opposé de tes moyens d’apprentissage. Je remercie ma sœur Paula pour nos nombreuses discussions téléphoniques, parfois incompatibles avec mon emploi du temps, mais (malheureusement) rien ne l’arrête quand elle veut aborder un sujet. Merci pour tous ses conseils lors des conférences auxquelles j’ai participé . . . je parle
évidemment de ses conseils mode (que j’ai pris, parfois, en considération). Paula, merci pour ta bienveillance, toujours masquée par ton air moqueur, et pour tes blagues imbattables qui ont l’art d’alléger la gravité de n’importe quelle situation.
EnÆn, je dédie cette thèse (et toutes mes futures réalisations) à mes chers parents Boulos et Camélia. Comment ne pas le faire alors qu’ils sont à l’origine de tous mes accomplissements ? Camélia (oui j’ai cette curieuse habitude d’appeler mes parents par leurs prénoms), merci d’avoir réussi à te délester complètement de cet attachement maternel parfois accaparant pour m’encourager à poursuivre mes études en France. Merci pour ta sagesse, ton ouverture d’esprit et surtout pour ta surveillance méticuleuse et «très» discrète de mon last seen sur Whatsapp qui déclenche un état d’urgence dès qu’il dépasse les huit heures ! Boulos, par ton ambition et ta pugnacité, tu es parvenu à m’apprendre qu’on peut toujours accomplir nos objectifs avec une petite dose de persévérance, d’audace et d’ambition, sans pour autant que celle-ci n’empiète sur le contentement, me répétant sans cesse ce proverbe qui m’accompagnera toujours «Contentement passe richesse».
Résumé
Cette thèse est constituée de deux parties liées l’une à l’autre. Dans la première, nous étudions empiriquement l’impact de l’activité de trading haute fréquence, déÆnie comme étant une sous-catégorie du trading algorithmique caractérisée par une courte période de détention de titres, sur les marchés Ænanciers européens. Nous utilisons les résultats obtenus aÆn de construire dans la seconde partie de nouveaux modèles multi-agents. L’objectif principal de ces modèles est de fournir aux régulateurs et plateformes de négociation des outils innovants leur permettant de mettre en place des règles pertinentes pour la microstructure et de quantiÆer l’impact des divers participants sur la qualité du marché.
Dans la première partie, nous e ectuons deux études empiriques sur des données uniques fournies par le régulateur français. Nous avons accès à l’ensemble des ordres et transac-tions des actifs du CAC 40, à l’échelle de la microseconde, avec par ailleurs les identités des acteurs impliqués. Nous commençons par comparer le comportement des traders haute fréquence à celui des autres intervenants, notamment pendant les périodes de stress, en termes de provision de liquidité et d’activité de négociation. Nous arrivons à montrer dans cette étude une caractéristique cruciale relative aux traders à haute fréquence: leur activité n’est pas limitée à la tenue de marché pure et plus de 50% de leurs sont agressifs (ordres consommant la liquidité). Cette constatation nous pousse à approfondir notre analyse en nous focalisant sur les ordres agressifs. Nous étudions leur impact sur le processus de formation des prix et leur contenu informationnel selon les di érentes catégories de Øux : traders haute fréquence, participants agissant pour compte client et participants agissant pour compte propre. De plus, nous parvenons dans cette analyse à mettre en évidence empiriquement le lien existant entre les transactions et l’avantage informationnel des traders à haute fréquence. Dans la seconde partie, nous proposons trois modèles multi-agents. Dans le premier modèle, nous cherchons à incoroprer la relation entre transactions et information. Cette relation est dans le coeur du modèle Glosten-Milgrom, mais ce dernier se limite à la modélisation des meilleurs prix à la vente et à l’achat. À l’aide d’une approche à la Glosten-Milgrom, nous parvenons à construire l’ensemble du carnet d’ordres (spread et volume disponible à chaque prix) à partir des interactions entre trois types d’agents : un agent informé, un agent non informé et des teneurs de marché. Ce modèle nous permet par ailleurs de développer une méthodologie de prédiction du spread en cas de modiÆcation du pas de cotation et de quantiÆer la valeur de la priorité dans la Æle d’attente. L’inconvénient principal de ce modèle est celui d’agréger les di érents participants de marché par groupes. Ainsi, il ne permet pas de mettre en évidence les disparités existantes entre les participants de marché appartenant au même groupe. AÆn de se concentrer sur une échelle individuelle, nous proposons une deuxième approche où les dynamiques spéciÆques des agents sont modélisées par des processus de type Hawkes non linéaires et dépendants de l’état du carnet d’ordres. Dans ce cadre, nous sommes en mesure de calculer en fonction des Øux individuels plusieurs indicateurs pertinents relatifs à la microstructure. Il est notamment possible de classer les
teneurs de marché selon leur contribution propre à la volatilité. EnÆn, nous introduisons un modèle où les fournisseurs de liquidité optimisent leurs meilleurs prix à l’achat et à la vente en fonction du proÆt qu’ils peuvent générer et du risque d’inventaire auquel ils sont confrontés. Nous mettons alors en évidence théoriquement une corrélation négative entre inventaire des teneurs de marché et pression exercée sur les prix. Nous conÆrmons ce résultat empiriquement en étudiant les inventaires individuels des teneurs de marché dans un contexte multi-plateformes.
Abstract
This thesis is made of two related parts. In the Ærst one, we study the empirical behaviour of high-frequency traders on European Ænancial markets. We use the obtained results to build in the second part new agent-based models for market dynamics. The main purpose of these models is to provide innovative tools for regulators and exchanges allowing them to design suitable rules at the microstructure level and to assess the impact of the various participants on market quality.
In the Ærst part, we conduct two empirical studies on unique data sets provided by the French regulator. It covers the trades and orders of the CAC 40 securities, with microseconds accuracy and labelled by the market participants identities. We begin by investigating the behaviour of high-frequency traders compared to the rest of the market, notably during periods of stress, in terms of liquidity provision and trading activity. We work both at the day-to-day scale and at the intraday level. We then deepen our analysis by focusing on liquidity consuming orders. We give some evidence concerning their impact on the price formation process and their information content according to the di erent order Øow categories: high-frequency traders, agency participants and proprietary ones.
In the second part, we propose three di erent agent-based models. Using a Glosten-Milgrom type approach, the Ærst model enables us to deduce the whole limit order book (bid-ask spread and volume available at each price) from the interactions between three kinds of agents: an informed trader, a noise trader and several market makers. It also allows us to build a spread forecasting methodology in case of a tick size change and to quantify the queue priority value. To work at the individual agent level, we propose a second approach where market participants speciÆc dynamics are modelled by non-linear and state dependent Hawkes type processes. In this setting, we are able to compute several relevant microstructural indicators in terms of the individual Øows. It is notably possible to rank market makers according to their own contribution to volatility. Finally, we introduce a model where market makers optimise their best bid and ask according to the proÆt they can generate and the inventory risk they face. We then establish theoretically a negative relationship between market makers inventories and price pressure. We conÆrm this result studying empirically individual market makers inventories in a multi-platform framework.
List of papers being part of this thesis
• Charles-Albert Lehalle, Nicolas Megarbane, Mathieu Rosenbaum and Pamela Saliba
The behaviour of high-frequency traders under di erent market stress scenarios, Market
Microstructure and Liquidity, Vol. 03, No. 03n04, 1850005, 2017.
• Pamela Saliba, The information content of high-frequency traders aggressive orders: recent
evidences, submitted, 2019.
• Weibing Huang, Mathieu Rosenbaum and Pamela Saliba From Glosten-Milgrom to the
whole limit order book and applications to Ænancial regulation, submitted, 2019.
• Othmane Mounjid, Mathieu Rosenbaum and Pamela Saliba, From asymptotic properties of
general point processes to the ranking of Ænancial agents , submitted, 2019.
• Agostino Capponi, Mathieu Rosenbaum and Pamela Saliba, Market makers inventories
Contents
Contents xv
Introduction 1
Motivations . . . 1
Outline . . . 3
1 Part 1: Empirical analysis of high-frequency traders behaviour . . . 4
1.1 Chapter I - The behaviour of high-frequency traders under di erent market stress scenarios . . . 5
1.2 Chapter II - The Information content of high-frequency traders ag-gressive orders: recent evidences . . . 9
2 Part 2: From empirical observations to agent-based modelling . . . 14
2.1 Chapter III - From Glosten-Milgrom to the whole limit order book and applications to Ænancial regulation . . . 14
2.2 Chapter IV - From asymptotic properties of general point processes to the ranking of Ænancial agents . . . 19
2.3 Chapter V - Market makers inventories and price pressure: theory and multi-platform empirical evidences . . . 24
2.4 Multi-platform empirical analysis . . . 25
Part 1 Empirical analysis of high-frequency traders behaviour 31 I The behaviour of high-frequency traders under di erent volatility market stress scenarios 33 1 Introduction . . . 33
2 Data description, HFTs identiÆcation and volatility metrics . . . 37
2.1 Description . . . 37 2.2 HFT identiÆcation . . . 38 2.3 Volatility metrics . . . 39 3 Liquidity provision by HFTs . . . 43 3.1 Liquidity metrics . . . 43 3.2 Preliminary statistics . . . 44 3.3 Day-to-day analysis . . . 45
3.4 Intraday analysis . . . 47
4 Trading activity of HFTs: Amounts traded and aggressiveness . . . 50
4.1 Metrics used . . . 51
4.2 Preliminary statistics . . . 52
4.3 Typical behaviour of market makers . . . 52
4.4 Day-to-day analysis . . . 53
4.5 Intraday analysis . . . 55
5 A more quantitative analysis around the 4 p.m. announcement . . . 61
5.1 Analysis of HFTs market share in terms of market depth . . . 62
5.2 Analysis of HFTs aggressive/passive ratio . . . 63
5.3 Analysis of HFTs share in amounts traded . . . 64
5.4 Summary . . . 65
6 Detailed analysis of two events . . . 65
6.1 Focus on the3r d of December 2015 . . . 65
6.2 Focus on the24th of June 2016 (Brexit announcement) . . . 71
7 Conclusion . . . 78
I.A Raw OLS regressions of Section 5 . . . 80
II The information content of high-frequency traders aggressive orders: re-cent evidences 83 1 Introduction . . . 83
2 Data description and HFTs identiÆcation . . . 85
2.1 Data description . . . 85
2.2 The di erent order Øow categories . . . 86
2.3 HFTs identiÆcation . . . 87
3 QuantiÆcation of the price impact and the informational advantage . . . 88
4 Analysis of aggressive orders with respect to consumed share . . . 89
4.1 Three di erent groups of aggressive orders . . . 89
4.2 Some preliminary statistics . . . 89
4.3 Relationship between imbalance and aggressive order group . . . 90
4.4 Price impact according to the groups of aggressive orders . . . 91
4.5 Focus on partial and exact aggressive orders . . . 92
5 Potential proÆts according to the di erent order Øow categories . . . 95
5.1 Potential proÆts after partial aggressive orders . . . 95
5.2 Potential proÆts after exact aggressive orders . . . 96
5.3 Does the potential proÆt vary among members within the same order Øow category? . . . 97
5.4 Disparities in potential proÆts for a same member code according to the di erent order Øow categories . . . 99
6 From single aggressive orders to strategies . . . 100
6.1 Autocorrelation of aggressive orders according to the di erent order Øow categories . . . 100
6.2 A classiÆcation tool . . . 101
6.3 A more granular classiÆcation using the di erent connectivity channels 103
6.4 Di erent strategies . . . 104
7 Conclusion . . . 107
II.A Generalisation to all HFTs . . . 107
Part 2 From empirical observations to agent-based modelling 109 III From Glosten-Milgrom to the whole limit order book and applications to Ænancial regulation 111 1 Introduction . . . 111
2 Model and assumptions . . . 114
2.1 Modelling the e cient price . . . 115
2.2 Market participants . . . 115
2.3 Assumptions . . . 116
2.4 Computation of the market makers expected gain . . . 117
2.5 The emergence of the bid-ask spread and LOB shape . . . 120
2.6 Variance per trade . . . 121
3 The case of non-zero tick size . . . 122
3.1 Notations and assumptions . . . 122
3.2 Computation of the market makers expected gain . . . 122
3.3 Bid-ask spread and LOB formation . . . 124
3.4 Variance per trade . . . 125
3.5 Queue position valuation . . . 125
4 First practical application: Spread forecasting . . . 126
4.1 The tick size issue and MiFID II directive . . . 127
4.2 Data . . . 127
4.3 Prediction of the spread under MiFID II and optimal tick sizes . . . 127
5 Second practical application: Queue position valuation . . . 128
5.1 Data . . . 128
5.2 Pareto parameters estimation methodology . . . 128
5.3 Queue position valuation . . . 129
III.A Proofs . . . 130
III.A.1 Proof of Proposition 1 . . . 130
III.A.2 Proof of Theorem 1 . . . 131
III.A.3 Proof of Theorem 2 . . . 132
III.A.4 Proof of Proposition 1 . . . 133
III.A.5 Proof of Theorem 1 . . . 134
III.A.6 Proof of Corollary 1 . . . 135
IV From asymptotic properties of general point processes to the ranking of Ænancial agents 137 1 Introduction . . . 137
2.1 Introduction to the model . . . 140
2.2 Order book dynamic . . . 141
2.3 Market reconstitution . . . 144
2.4 Some speciÆc models . . . 144
3 Ergodicity . . . 146
3.1 Notations and deÆnitions . . . 146
3.2 Ergodicity . . . 146
4 Limit theorems . . . 150
5 Formulas . . . 151
5.1 Stationary probability computation . . . 151
5.2 Spread computation . . . 152
5.3 Price volatility computation . . . 153
5.4 An alternative measure of market stability . . . 154
6 Numerical experiments . . . 154
6.1 Database description. . . 155
6.2 Computation of the intensities and the stationary measure . . . 156
6.3 Ranking of the market makers . . . 157
IV.A Market reconstitution . . . 159
IV.B Proof of Remark 5 . . . 160
IV.C Proof of Theorem 1 . . . 161
IV.C.1 Preliminary results . . . 161
IV.C.2 Outline of the proof . . . 163
IV.C.3 Proof . . . 163
IV.D Proof of Theorem 2 . . . 167
IV.D.1 Preliminary result . . . 167
IV.D.2 Uniqueness . . . 169
IV.D.3 Speed of convergence . . . 178
IV.E Proof of Propositions 2 and 3 . . . 179
IV.F Stationary distribution computation . . . 179
IV.G Proof of Proposition 5 . . . 180
IV.H Proof of Remark 19 . . . 182
IV.I Supplementary numerical results . . . 183
V Market makers inventories and price pressure: theory and multi-platform empirical evidences 189 1 Introduction . . . 189
2 Model . . . 191
2.1 Buy and sell investors . . . 191
2.2 Multiple market makers . . . 191
3 Case of identical market makers . . . 192
4 Case of heterogeneous market makers . . . 194
4.1 Comparison with the case where market makers are homogeneous (i1= i2) . . . 197
5 Data description and preliminary statistics . . . 198
5.1 Data description . . . 198
5.2 Market makers activity and identiÆcation . . . 199
6 Market makers aggressiveness . . . 203
6.1 Preliminary statistics on market makers aggressiveness . . . 203
6.2 Market makers aggressiveness according to the inventory . . . 204
7 Price pressure and market makers inventories . . . 207
7.1 Measure of the price pressure . . . 207
7.2 Empirical analysis of the impact of market makers inventories on prices207 7.3 Regression analysis . . . 209
Introduction
The guiding principle of this thesis is to understand and model how high-frequency traders (HFTs) impact the market and suggest ways to mitigate their e ects. After studying empirically the HFTs behaviour, we aim at proposing models reproducing our empirical observations, and allowing us to design new regulatory tools. Let us begin with presenting and motivating the di erent questions on which we want to shed some light in this thesis.
Motivations
HFTs are commonly deÆned as a subset of algorithmic traders using co-location and proximity services to minimise latency, submitting a large number of orders that are cancelled shortly after submission and holding assets over very short periods. The signiÆcant growth in high-frequency trading in the recent years has created a debate among regulators, academics and practitioners. They aim at understanding how HFTs a ect the markets. Does their activity improve or damage market quality? Some argue that HFTs are beneÆcial for the market: they increase liquidity provision, do not withdraw from markets in bad times, contribute more to price discovery than non-HFTs and reduce volatility. On the contrary, others assert that they have toxic consequences on the market. This is because when speed disparities exist between traders, adverse selection may increase and liquidity becomes more expensive. We contribute to this debate by considering the following question:
Question 1. What is the intraday behaviour of HFTs, and how do they react during periods of
stress?
Addressing Question 1, we highlight the behaviours disparities across HFTs. We also give interpretations for the variations of HFTs shares in market depth and traded amounts accord-ing to the volatility and to macroeconomic announcements. Furthermore, we show a crucial feature relative to HFTs: their activity is not restrained to pure market making, and more than 50% of their orders are aggressive. Recall that a transaction is derived from the matching of an aggressive order with a passive one: the passive order is the one standing in the order book and providing liquidity, while the aggressive order is the one consuming liquidity. It is well known that HFTs may use aggressive orders for inventory management purpose (we will support this argument by giving empirical proofs later on, when answering Question 5), but the ratio between aggressive and passive orders we obtain, which is higher than 50%, is quite
Introduction
surprising. This pushes us to wonder whether these aggressive orders can potentially generate proÆts for HFTs. In addition to this, aggressive orders are rarely studied in the high-frequency trading literature. Consequently, we naturally consider the following question:
Question 2. Do HFTs trade opportunely when they trade aggressively?
When answering the question above, we establish that the aggressive trades of HFTs are driven by an informational advantage over the rest of the market. We also show that it is possible to build a classiÆcation of market participants based on the potential proÆt of their aggressive orders. Furthermore, we emphasise the connection between Limit Order Book (LOB) states and price moves. From a theoretical viewpoint, relationships between trades and information are at the heart of the celebrated Glosten-Milgrom model. However, this model is limited to the modelling of the best bid and ask quotes. We wish to model the whole LOB by showing how the latter can emerge from the interaction between market participants with disparities in terms of information. Doing so, our goal is in particular to quantify the queue priority value. This represents the advantage of an order placed on top of a queue in the book compared to an order placed at the bottom. We are interested in quantifying this concept because it has a crucial role in HFTs strategies. This is one of the key elements allowing fast HFTs to generate proÆts. Therefore, we consider the following question:
Question 3. How could we extend the Glosten-Milgrom model to the whole LOB?
As an answer to Question 3, we propose an agent-based model enabling us to forecast the spread according to the tick size, and to quantify the queue priority value. Thanks to the simplicity of the model, computations are explicit. However, it has some limitations. First, it restrains the activity of market makers to passive orders and that of informed traders to aggressive orders, which is not really realistic according to our answers to Questions 1 and 2. Second, it does not take into account the inØuence of the LOB state on trading behaviours, illustrated in the results of Question 2. Third, in this model, agents are aggregated into three groups: informed traders, noise traders and market makers. Consequently, it is impossible to disentangle disparities among behaviours of market participants belonging a priori to the same group. Therefore, based on this approach we cannot propose any kind of individual regulatory measure or compare market participants across each others. However, these disparities, highlighted in our answer to Question 1, play a key role in the impact of market participants on market quality. Furthermore, we know from our answer to Question 2 that a comparison across market participants is possible based on the potential proÆt of their aggressive trades. So, we want to propose a general ranking methodology of market participants according to their impact on market quality, based on their individual strategies. This leads us to the following question:
Question 4. How to build a model for the interactions between strategies of individual market
participants and use it to assess their speciÆc contribution to market quality?
Investigating Question 4, we design a model enabling us to derive a mathematical link be-tween individual agents trading Øows (insertion, cancellation and aggressive orders) and mar-ket quality, measured for example through the volatility. This relationship is actually in line 2
Outline
with our answer to Question 1 where, at the aggregated level, we empirically Ænd a strong correlation between on the one hand market depth, aggressiveness and market share, and on the other hand volatility. The focus of Question 4 is on high-frequency market makers since they are the most active market participants. The main risk faced by these participants is related to their inventory management, which is not investigated in details when answering Question 4. Hence, the Ænal question of this thesis is the following:
Question 5. Do high-frequency market makers inventories have an endogenous impact on prices?
Outline
Each chapter of this thesis addresses one of the questions above. This work can be separated into two main parts. In Part 1, we give empirical answers to Questions 1 and 2 by analysing unique datasets labelled by market participants identities, with microsecond granularity cov-ering the trades and orders of the CAC 40 securities. In Part 2, we deal with Questions 3, 4 and 5 by proposing some suitable agent-based models taking into account empirical obser-vations of Part 1.
In Chapter I, we answer Question 1 by studying the trades and orders of the CAC 40 French securities, on Euronext Paris from November 2015 to July 2016. First, we analyse HFTs contribution to liquidity that we measure in terms of spread and market depth at the three best limits. Second, we evaluate the trading practices of HFTs by assessing their share in traded amounts, and whether they are mainly liquidity providers or liquidity consumers. We show that the behaviour of HFTs during the day can be split into four distinct phases. Fur-thermore, we identify signiÆcant changes of regime in HFTs behaviour in the presence of scheduled news, going beyond the expected reaction to volatility variations. Finally, we shed light on their response towards non-scheduled announcements or pre-market announcements. In Chapter II, we tackle Question 2 by investigating the same type of data as that of Chapter I, from September 2017 to November 2017. We start with looking at how the price impact of a single aggressive order varies according to the amount of liquidity consumed. This is why we split these orders into three groups: those consuming less than the liquidity available at the Ærst limit (partial aggressive orders), those consuming exactly the liquidity available at the Ærst limit (exact aggressive orders), and those consuming more than the liquidity available at the Ærst limit (n-limit aggressive orders). Then, in contrast to several earlier studies, we show that HFTs aggressive orders have an informational advantage compared to the rest of the market, suggesting an evolution in HFTs activity in the recent years. This result is obtained by com-puting the potential proÆts of the di erent order Øow categories (HFTs, agency participants and proprietary participants) over various time horizons, and comparing those of HFTs to the rest of the market. Finally, we display how aggressive orders can be used in order to clas-sify market participants as HFTs or non-HFTs, or to deduce the market participants strategies.
Introduction
Answer to Question 3 lies in Chapter III. Using a Glosten-Milgrom type approach, we are able to deduce the whole LOB (bid-ask spread and volume available at each price) from the inter-actions between three di erent types of agents: an informed trader, a noise trader and several market makers. This model enables us to build several relevant tools for regulators, exchanges and market participants. For instance, we provide a device to forecast consequences of a tick size change on the spread. To validate the e ciency of this method, we predict the spread changes due to the new tick size regime under the recent European regulation MiFID II, and compare our results to the e ective spread values. It turns out that our predictions are very accurate: the average relative error we obtain is around 5%. This model also enables us to value quantitatively the queue position of a limit order in the book. We estimate this quantity for Æve small tick assets from the CAC 40 and show that the values of queue position are of the same order of magnitude as the bid-ask spreads.
We address Question 4 in Chapter IV. For this, we restrict ourselves to the modelling of the best bid and ask limits. We propose an approach based on the individual behaviours of market participants modelled by non-linear and state dependent Hawkes like processes. Our model encompasses the well-known Poisson, Queue-reactive and Hawkes Queue-reactive dy-namics for order books. Under mild assumptions, we prove the ergodicity and di usivity of our model. We also derive semi-closed formulas for the spread, imbalance and market volatil-ity in terms of the intensities of the Øows of the di erent market participants. Thanks to these results, we are for example able to rank market makers according to their contribution to volatility. This ranking is illustrated on several CAC 40 assets. Interestingly the obtained rankings are quite homogeneous from one asset to another.
Question 5 is answered in Chapter V. We extend the literature establishing a negative re-lationship between price pressure and the inventory of homogeneous market makers to the case where the agents can be heterogeneous.. The price pressure can be deÆned as the local price impact due to submitted market and limit orders: a highly positive (resp. negative) inventory pushes the price down (resp. up). Thanks to a unique dataset with participants level information, we illustrate this relationship empirically by conducting a multi-platform study of high-frequency market making. Such an empirical study is to our knowledge the Ærst of its kind in the literature.
1 Part 1: Empirical analysis of high-frequency traders behaviour
In Part 1, we conduct empirical analyses in order to answer Questions 1 and 2. A mar-ket participant is identiÆed as an HFT if either he belongs to the Supplemental Liquidity Provider (SLP) programme of Euronext, which is a market making programme, or if he meets some criteria related to the lifetime of cancelled orders, detailed in the core of the thesis. When focusing on market making activity, high-frequency market makers are deÆned as SLP members.1. Part 1: Empirical analysis of high-frequency traders behaviour
1.1 Chapter I - The behaviour of high-frequency traders under di erent market stress scenarios
In Chapter I, we answer Question 1: What is the intraday behaviour of HFTs, and how do they react during stress periods? We focus on the behaviour of HFTs on a daily scale (by studying their behaviour day by day) according to the level of stress measured mainly by the implied volatility, on an intraday scale (by studying their seasonal behaviour during a trad-ing day), and around macroeconomic news. To do so, we have access to a unique labelled dataset covering the trades and orders of the CAC 40 French securities, on Euronext Paris from November 2015 to July 2016. On both daily and intraday scales, we analyse liquidity and trading activity. Liquidity is quantiÆed by measuring the bid-ask spread and market depth at the three best limits. The HFTs trading activity is assessed by their aggressive/passive ratio (the ratio of amounts traded aggressively by HFTs over their total traded amounts) and their market share in traded amounts. We deepen our analysis by considering least square regres-sions for our metrics with respect to the volatility and other explanatory variables where we distinguish between days with and without macroeconomic announcements. We then focus on HFTs behaviour regarding unscheduled and pre-market announcements.
We Ærst analyse how HFTs contribute to liquidity. We give in the following our main Ændings. 1.1.1 Liquidity analysis
On a daily scale Market depth decreases sharply and spreads widen when implied volatility increases.
Result 1. Implied volatility a ects all participants evenly: the HFTs market share in terms of
market depth remains almost constant, independent of the implied volatility level, close to 80% at the three best price limits.
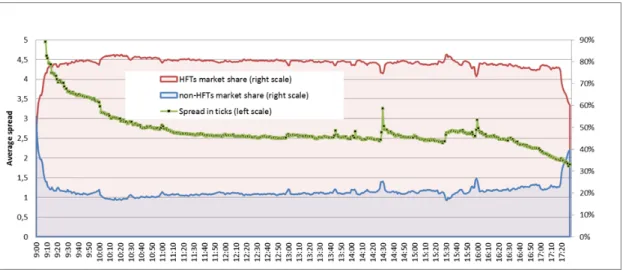
On an intraday scale Non-HFTs provide a relatively constant amount of market depth in the order book throughout the day. For HFTs, both their market depth share and the amount they o er increase during the Ærst hour of the day. HFTs contribute to spread tightening at the beginning of the day: their share in market depth increases while spread tightens. The levels remain stable during the day, albeit with temporary declines before the usual announcement times. At the end of the day, HFTs market depth share and HFTs amounts o ered decrease rapidly. Indeed, HFTs do not generally hold overnight positions.
During macroeconomic announcements Before macroeconomic announcements, HFTs sharply reduce their liquidity provision a few minutes (generally 3 minutes) before the an-nouncements, unlike other market participants who decrease slightly their amount of limit orders. This withdrawal before announcement times contributes to bid-ask spread widening. Then HFTs liquidity returns quickly to the order book after the announcements (generally one or two minutes later).
Introduction
The main intraday HFTs and non-HFTs liquidity contribution behaviours are summarised in Figure .1.
Figure .1 – Intraday evolution of HFTs and non-HFTs market share in terms of market depth compared to the bid-ask spread evolution in ticks.
Second, we analyse the trading behaviour of HFTs by measuring their market share in traded amounts and their aggressive/passive ratio with respect to the volatility and other explanatory variables. Our main Ændings are summarised below.
1.1.2 Trading activity analysis: market share and aggressiveness
On a daily scale HFTs share in amounts traded is slightly dependent on the implied volatil-ity (positive correlation) while their aggressive/passive ratio is not.
Result 2. On average, HFTs share in amounts traded oscillates around 60% and they consume more
liquidity than they provide, with an aggressive/passive ratio around 53%.
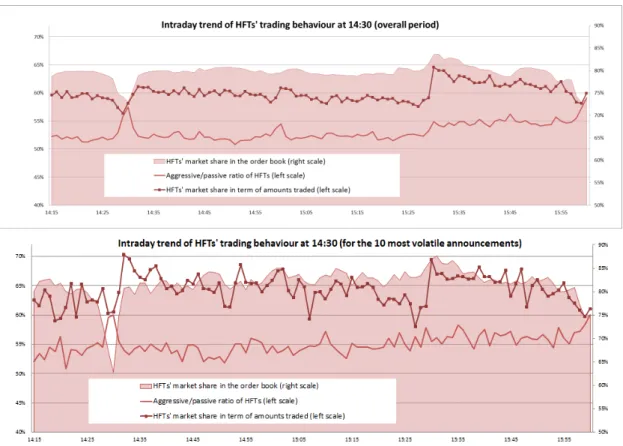
On an intraday scale The relationship between historical volatility and amounts traded remains true: the higher the historical volatility, the larger the amounts traded over all par-ticipants. However, at the very end of the day, this relationship does no longer hold: amounts traded increase sharply while historical volatility tends to decrease. Regarding the behaviour of HFTs, we can distinguish between four distinct phases:
• At the beginning of the day, HFTs share in amounts traded increases gradually from 50% to 58%. At the same time, their aggressive/passive ratio falls from 65% to 55%. • Before the U.S. market opening, amounts traded by the market as a whole are relatively
stable, as is HFTs share in amounts traded (60%) and their aggressive/passive ratio (52%).
1. Part 1: Empirical analysis of high-frequency traders behaviour
• After the U.S. market opening, HFTs share in amounts traded rises from 58% to 65%. Their aggressive/passive ratio also increases from 52% to 55%. This surge in aggressive-ness is most likely due to the appearance of arbitrage opportunities. HFTs therefore consume more liquidity than they provide.
• At the end of the day, HFTs gradually withdraw and their share in amounts traded decreases from 60% to 55%. Their aggressiveness increases due to the decrease in their market depth and probably their desire to unwind positions before the close, which tends to trigger aggressive behaviours.
During macroeconomic announcements Before an announcement, HFTs share in amounts traded decreases and their aggressive/passive ratio increases. Both features are mainly due to a decrease in passive orders because HFTs withdraw from the order book. After an an-nouncement, prices are often severely a ected. This leads to a sudden increase in aggressive Øows from HFTs (as is the case after the U.S. market opening). HFTs share in amounts traded therefore rises, as their aggressive/passive ratio, now because of an increase in their aggressive orders. When the price Øuctuates widely, the aggressive/passive ratio for these participants increases signiÆcantly. This probably reØects some transformation of mean reversion strate-gies into short-term directional (momentum) ones, which can hardly be considered as market making.
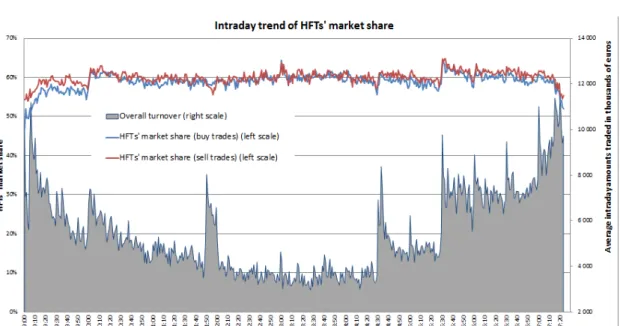
The main intraday HFTs trading behaviours are summarised in Figure .2.
Figure .2 – Intraday evolution of HFTs aggressiveness and HFTs market share in terms of market depth and amounts traded.
Note that all these observations can signiÆcantly di er from one HFT to another: each HFT has a very di erent level of aggressiveness, and the distribution of the share in market depth and traded amounts is unequal across them.
Introduction
1.1.3 Regression based analysis of these empirical results
We sharpen our observations related to the behaviour of HFTs during macroeconomic an-nouncements by using least square regressions of our metrics with respect to the volatility and other explanatory variables. We distinguish between days with and without scheduled announcements at 4 p.m. All these regression results are in line with the empirical observa-tions, and point out in a quantitative way that:
Result 3. The behaviour of HFTs around announcements cannot be read as a simple reaction to
associated variations of volatility. In fact, HFTs do contribute less to market depth before, during and after announcements, their market share in traded amounts decreases and their aggressive/passive ratio increases before and during announcements even once a volatility e ect is taken into account.
After studying in details the HFTs behaviour with respect to scheduled macroeconomic an-nouncements, we investigate their reaction when the announcement is unscheduled or when it takes place overnight.
1.1.4 Focus on an unscheduled announcement and a pre-market announcement We focus on the response of HFTs with respect to two speciÆc events. The unexpected and misleading macroeconomic announcement released by the Financial Times on Twitter on December3r d 2015 concerning the monetary policy of the European Central Bank, and the Brexit referendum announcement occurring before the opening of the markets on June24th
2016.
Following the unscheduled announcement of December 3r d 2015, liquidity obviously de-creased. However, in opposite to what typically happens before the scheduled macroeco-nomic news, and despite the withdrawal of HFTs and non-HFTs from the order book, HFTs market share increased from 80% to 90%. It is likely that non-HFTs could not track the price drop and hence were unable to update their orders, whereas HFTs were able to quickly move their orders and maintain part of their passive liquidity provision in the order book. The behaviour of market participants is signiÆcantly di erent in the case of the Brexit pre-market announcement: HFTs diminished signiÆcantly their presence in the market, while non-HFTs partially o set HFTs reduced liquidity by providing a market depth twice larger than their usual level. We can interpret this Ænding as follows: when non-HFTs have time to adapt to announcements (they had the overnight in the case of the Brexit, in contrast to the situation on the3r d of December 2015), they may act as market makers.
One of our remarkable Ændings in this chapter is that the activity of HFTs is not limited to market making: more than 50% of their orders are aggressive. We aim at analysing these aggressive orders rarely studied in literature: are they used only for inventory management or also for directional trading? We address this issue in Chapter II.
1. Part 1: Empirical analysis of high-frequency traders behaviour
1.2 Chapter II - The Information content of high-frequency traders aggressive orders: recent evidences
In this chapter, we answer Question 2: Do HFTs trade opportunely when they use aggressive orders? We present some evidence concerning the impact of aggressive orders on the price formation process and the information content of these orders according to the di erent order Øow categories (high-frequency traders, agency participants, proprietary participants and retail members). For this, we conduct a study on CAC 40 stocks data from September 2017 to November 2017. Over the analysed period, we use both trade and LOB data to describe the dynamics of the LOB accurately before and after each aggressive order. The whole dataset contains approximately 8 millions aggressive orders and 423 millions events (an event can be an order insertion, an order cancellation, an order modiÆcation or a transaction). We summarise in the following our main Ændings.
1.2.1 Three di erent groups of aggressive orders
We begin with looking at how the price impact of a single aggressive order varies according to the proportion of liquidity it consumes compared to that present at the best limit. This is why we split aggressive orders into three groups:
• Partial aggressive orders: they consume less than the quantity present at the best limit. • Exact aggressive orders: they consume exactly the quantity present at the best limit. • N-limit aggressive orders: they consume more than the quantity present at the best
limit.
Partial (resp. exact) aggressive orders constitute approximately 50% (resp. 47%) of aggressive orders in number. Partial and exact aggressive orders are unequally distributed across the di erent order Øow categories. Indeed HFTs send more exact aggressive orders than partial ones: 63% of the exact aggressive orders are sent by HFTs, while only 39% of partial ones are sent by them. Furthermore, we Ænd that exact aggressive orders take place when the LOB is signiÆcantly unbalanced. The imbalance at time t, just before the aggressive buy (resp. sell) order takes place, is computed as follows:
Imbt=
Q1t°Qt2 Q1
t+Qt2
,
where Q1t denotes the volume available at the best bid (resp. ask) at time t, andQ2t that at the best ask (resp. bid) at timet when it is a buy (resp. sell) aggressive order. We Ænd that the value of the imbalance one microsecond before the exact aggressive trades (on average equal to 27%) is signiÆcantly higher than that (on average equal to 3%) before the partial aggressive trades.
Introduction
1.2.2 Price impact according to the groups of aggressive orders
In order to measure the price impact related to each group of aggressive orders, we Ærst deÆne our price impact measure.
QuantiÆcation of the price impact The price impact of an individual buy (resp. sell) aggressive order, taking place at time t and evaluated at time t + h is denoted byPIt+h and deÆned as follows:
PIt+h=BPt+h° BPt°
S § si g nt
where BPt° denotes the best ask (resp. bid) one microsecond before the buy (resp. sell) aggressive order andS the average spread of the asset. For a given Øow of aggressive orders, and for a given timet + h, we compute the average of this measure weighted by the executed quantity across all aggressive orders. This is done from 17 minutes before till 17 minutes after the aggressive order. The results, relative to each group of aggressive orders are the following. Result 4. As expected, one microsecond after the aggressive order, because of the mechanical impact,
the price impact due to n-limit aggressive orders is higher than that of exact ones, which is higher than that of partial ones. One relevant question is whether this mechanical impact is permanent or not. We Ænd that the price impact of exact aggressive orders is permanent: it is above that of partial ones, over all time horizons, higher than two-thirds of the bid-ask spread. On the contrary, n-limit aggressive orders have a temporary component in their price impact: market participants tend to reÆll the LOB by submitting new orders in place of the consumed ones. Indeed, starting one second after the aggressive order, the price impact begins to attenuate. On a 17 minutes time horizon, the remaining mechanical impact of n-limit aggressive orders is quite equal to that of exact aggressive orders.
We then shed light on the interest of studying the price impact according to the traded share (relative to the volume available at the best limit) instead of the traded volume.
Importance of analysing the price impact according to the traded share The average traded amount of partial aggressive order (13 k e) is close to the one of exact aggressive orders (11 k e), but their price impact is signiÆcantly di erent. This is a Ærst indicator that when analysing the price impact, one should not only look at the traded volume but also at the traded proportion relative to the quantity present at the best limits. We deepen our analysis by studying the price impact of partial orders according to the consumed propor-tion (we separate partial orders into 10 groups according to the consumed share). We Ænd that the magnitude of the price impact over all time horizons after the aggressive order is increasing with respect to the consumed share. We then investigate whether the consumed share rather depends on the quantity present at the best limit or on the traded amount. We obtain that the consumed part varies with the traded amount, but also depends signiÆcantly on the quantity present at the best limit. This means that the price impact does not depend only on the traded volume, but also implicitly on the volume present at the best limit. Hence the relevance of investigating the price impact according to the traded share.
1. Part 1: Empirical analysis of high-frequency traders behaviour
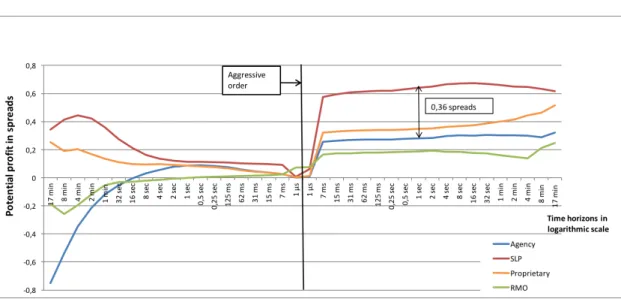
Now that we know that partial aggressive orders should be studied separately from exact aggressive orders, we focus on analysing the informational advantage according to each order Øow category, distinguishing between partial and exact aggressive orders. We Ærst quantify our notion of informational advantage and then give our main results, also illustrated in Figure .3.
1.2.3 Informational advantage
QuantiÆcation of the informational advantage To estimate the informational advantage of an agent, we compute the potential proÆt of a buy (resp. sell) aggressive order that a market participant can realise if he unwinds his position passively at time t + h, denoted byPPt+h:
PPt+h=BPt+h° Pt
S § si g nt
where BPt+h is the best ask (resp. bid) at time t + h,Pt the price per share obtained by the
aggressive order, S the average spread of the asset and si g nt takes the value 1 (resp. -1) if it
is a buy (resp. sell) aggressive order. For a given Øow of aggressive orders, and for a given
timet + h, we compute the average of this measure weighted by the executed quantity across
all aggressive orders. This is done from 17 minutes before till 17 minutes after the aggressive order.
Result 5. The HFT Øow stands out with the (signiÆcantly) highest potential proÆt in the case of
partial aggressive orders, over all time horizons. One second after partial aggressive orders, HFTs have a potential proÆt 0.36 spreads higher than that of agency participants, and 0.29 spreads higher than that of proprietary participants, see Figure .3. In addition to this, we show that the aggressive orders of HFTs are less autocorrelated than those of other categories. This allows us to deduce that the high potential proÆt of HFTs is due to an informational advantage and not to an endogenous price impact. Although HFTs still obtain a better potential proÆt than other market participants with exact aggressive orders, the di erence between the categories is not much signiÆcant in this case.
Introduction
Figure .3 – The potential proÆt evolution following partial aggressive orders according to the di erent order Øow categories over di erent time horizons.
Does the potential proÆt vary among members within the same order Øow category? We investigate the potential proÆt disparities between di erent members belonging to the same order Øow category for partial aggressive orders. We Ænd that over a short time horizon (until 2 minutes after the aggressive order), all HFTs belong to the 25% market participants realising the highest short-term potential proÆts. Over a longer time horizon, from two min-utes after the aggressive order, the proportion of HFTs with potential proÆt higher than the third quartile starts to decrease to the beneÆt of proprietary traders. This could be due to the fact that HFTs do not target long-term strategies, high-frequency trading being an activity where participants typically hold positions for very short times.
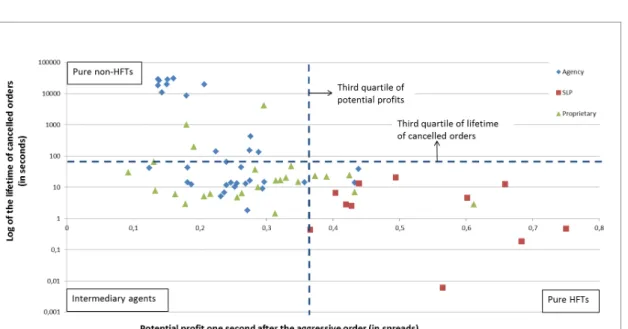
It turns out that the analysis of aggressive orders is useful to understand other features than price impact and potential proÆt. For instance, we propose a new classiÆcation of market participants based on our investigation of aggressive orders. We also show that we can access to a more granular classiÆcation by segmenting member code Øows according to the di erent connectivity channels they use, called SLEs (French acronym for Serveur Local d’Emission ). Finally, by observing the evolution of the price before the aggressive orders, we deduce the di erent strategies of member codes, such as mean reverting or trend following.
1.2.4 From single aggressive orders to strategies
A classiÆcation tool It is usual to consider cancelled orders to classify members as HFTs or non-HFTs. However, it seems also possible to classify participants by relying on aggressive order potential proÆts. We propose a new classiÆcation: those realising the highest short-term potential proÆts (one second after the aggressive order) can be considered as HFTs, and those realising the lowest as non-HFTs. It turns out that merging both approaches allows us to
1. Part 1: Empirical analysis of high-frequency traders behaviour
obtain a more complete classiÆcation of market participants, see Figure .4. Three di erent classes can be distinguished:
• Pure HFTs: they are characterised by a high short-term potential proÆt and a low lifetime of cancelled orders.
• Pure non-HFTs: they are characterised by a high lifetime of cancelled orders and a small short-term potential proÆt.
• Intermediary agents: they are characterised by a small short-term potential proÆt and a low lifetime of cancelled orders.
Figure .4 – Merging both classiÆcation methods: one relying on cancellations and one relying on potential proÆt (the Øows are grouped by member code and order Øow category).
We point out that, as expected, no member code has high short-term potential proÆts and high lifetime of cancelled orders. Moreover, note that all SLPs belong to the pure HFT category.
A more granular classiÆcation using the di erent connectivity channels Market mem-bers connect to Euronext via SLEs to convey their orders. Splitting the Øows issued by a same member code, and belonging to the same order Øow category according to these connectivity channels can in some cases bring up new information concerning the di erent activities fol-lowed by this member code. For example, we dissociate the Øow of a given member code who is an agency broker serving as intermediary for an HFT (among other clients) according to the di erent SLEs. We compute the potential proÆt of each of these Øows. We Ænd disparities in potential proÆts according to the di erent SLEs: one SLE is probably dedicated to the HFT client, while another is dedicated to other type of clients.
Introduction
Di erent strategies By observing what happens before the aggressive orders, we Ænd that on average, HFTs and proprietary agents are mean reverting (they buy when the price de-creases and sell when the price inde-creases). In contrast, agency members seem on average trend following: they buy when the price increases and sell when the price decreases. Analysing the potential proÆt by member code, we get that purely mean reverting strategies are not followed by all SLPs. Some of them carry out distinct strategies simultaneously: mean reverting, trend following and another strategy consisting in consuming new orders within the spread.
2 Part 2: From empirical observations to agent-based modelling
In Part 2, we focus on agent-based models with the objective of providing new relevant tools for regulators and exchanges. Also, we wish to take into account the empirical observations obtained in Part 1. We answer in this part to Questions 3, 4 and 5.2.1 Chapter III - From Glosten-Milgrom to the whole limit order book and applications to Ænancial regulation
In Chapter III, we answer Question 3: How could we extend the Glosten-Milgrom model to the whole LOB? This means that instead of computing only best bid and ask quotes as in the seminal paper by Glosten and Milgrom, we want to be able to build from the interactions between agents the whole LOB: best bid, best ask and volume available at each limit of the LOB.
2.1.1 E cient price and behaviour of the di erent market participants
In our model, we assume the existence of an e cient priceP(t). It is exogenous, independent of the order book dynamics and satisÆesP(t) = P(0)+Y (t), whereY (t)is a compound Poisson process of the form:Y (t) =N (t)P
i =1Bi,with jump rate∏
iand where theB
i are centred price jumps.
We consider three di erent types of market participants as in the Glosten-Milgrom model: • An informed trader: he receives the value of the price jump size B right before it
happens. He then sends his trades based on this information. The informed trader trade size is denoted by Qi. This market participant can be assimilated to an HFT using aggressive orders when he is more informed than the rest of the market. This feature stems from what we saw in Chapter II when answering Question 2.
• A noise trader: he sends random market orders that follow a compound Poisson process with arrival rate∏u. The noise trader order size is denoted byQu and its cumulative distribution function is denoted byF∑u.
• Several market makers: they receive the value of the price jump size B right after it happens. We assume that they are risk neutral. They know the proportion of price jumps compared to the total number of events happening in the market which is denoted byr = ∏i
∏i+∏u.
2. Part 2: From empirical observations to agent-based modelling
2.1.2 LOB modelling with a zero tick size
We start with the case where the tick size is assumed to be equal to zero. The obtained results help us to understand those when the tick size is positive. We writeLfor the cumulative LOB shape function on which we make no a priori assumption (for example it can have a singular part and discontinuities).
The informed trader computes his gain according to the future e cient price. If he knows that the price will increase (resp. decrease), which corresponds to a positive (resp. negative) jump B, he consumes all the sell (resp. buy) orders leading to positive ex-post proÆt. This is formalised in the assumption below.
Assumption 1. The informed trader sends his trade in a greedy way such that he wipes out all the
available liquidity in the LOB till the levelP(t) + B. Thus his trade size satisÆes: Qi= L(B°).
Regarding the market makers, they compute the conditional average proÆt of a new inÆnites-imal order if submitted at price level x knowing thatQ > L(x) and without any information about the trade initiator. This quantity is denoted byG(x)and its value is given in the next proposition.
Proposition 1. The average proÆt of a new inÆnitesimal order if submitted at price level x satisÆes:
G(x) = ( x ° r E[B1B>x] r P[B>x]+(1°r )P[Qu>L(x)] ifx ∏ 0 °x + r E[B1B<x] r P[B<x]+(1°r )P[Qu<L(x)] ifx ∑ 0.
For a givenx, market makers compute the theoretical ˆL(x)for whichG(x) = 0. Then they act according to the following zero-proÆt assumption.
Assumption 2. For everyx > 0(resp. x < 0), if ˆL(x) ∑ 0(resp. ˆL(x) ∏ 0), market makers add no liquidity to the LOB:L(x) = 0. If ˆL(x) > 0 (resp. ˆL(x) < 0), because of competition, the cumulative order book adjusts so thatG(x) = 0. We then obtainL(x) = ˆL(x).
Note that under our zero-proÆt assumption, market makers who place Ærst their orders in the queue, can still make proÆts. In this setting, we can show the emergence of the bid-ask spread and the LOB shape. We have the following result.
Result 6. The cumulative LOB satisÆesL(x) = °L(°x).Moreover,L(x) = 0, forx 2 (°µ,µ), and
L(x)is continuous and strictly increasing forx ∏ µ, whereµis the unique solution of the following
equation: 1 + r 2r = E[max( B µ,1)]. (1) Forx > µ,L(x) > 0: L(x) = F∑°1u( 1 1 ° r ° r 1 ° rE[max( B x,1)]). Forx < °µ,L(x) > 0: L(x) = °F°1( 1 ° r E[max( B ,1)]).