RESEARCH OUTPUTS / RÉSULTATS DE RECHERCHE
Author(s) - Auteur(s) :
Publication date - Date de publication :
Permanent link - Permalien :
Rights / License - Licence de droit d’auteur :
Bibliothèque Universitaire Moretus Plantin
Institutional Repository - Research Portal
Dépôt Institutionnel - Portail de la Recherche
researchportal.unamur.be
University of Namur
Cross-section measurements of the 14N(,p)17O and 14N(,)14N reactions between 3.5
and 6 MeV
Terwagne, Guy; Genard, Gilles; Yedji, Mourad; Ross, Guy G.
Published in:Journal of Applied Physics
Publication date: 2008
Document Version
Early version, also known as pre-print
Link to publication
Citation for pulished version (HARVARD):
Terwagne, G, Genard, G, Yedji, M & Ross, GG 2008, 'Cross-section measurements of the 14N(,p)17O and 14N(,)14N reactions between 3.5 and 6 MeV', Journal of Applied Physics, vol. 104, pp. 084909-1-8.
General rights
Copyright and moral rights for the publications made accessible in the public portal are retained by the authors and/or other copyright owners and it is a condition of accessing publications that users recognise and abide by the legal requirements associated with these rights. • Users may download and print one copy of any publication from the public portal for the purpose of private study or research. • You may not further distribute the material or use it for any profit-making activity or commercial gain
• You may freely distribute the URL identifying the publication in the public portal ?
Take down policy
If you believe that this document breaches copyright please contact us providing details, and we will remove access to the work immediately and investigate your claim.
Cross-section measurements of the
14N
„
␣
, p
…
17O and
14N
„
␣
,
␣
…
14N reactions
between 3.5 and 6 MeV
G. Terwagne,1,a兲 G. Genard,1M. Yedji,2and G. G. Ross2
1Centre de Recherche en Physique de la Matière et du Rayonnement, Laboratoire d’Analyses par Réactions
Nucléaires, University of Namur (FUNDP), 61 Rue de Bruxelles, B-5000 Namur, Belgium
2INRS-Énergie, Matériaux et Télécommunications, 1650 Boulevard Lionel-Boulet, Varennes, Québec J3X
1S2, Canada
共Received 11 April 2008; accepted 1 September 2008; published online 28 October 2008兲 The cross-section of the14N共␣, p0兲17O reaction at angles of 90°, 135°, and 165° was measured for
incident energies between 3.5 and 6.0 MeV simultaneously with the cross-section of the
14N共␣
,␣兲14N reaction at 165°. Interference between these two reactions at the angle of 165° and around 3.9 MeV was taken into account. The technique used is very powerful, thanks to the Ta450 nm/C target being implanted with a high dose of nitrogen. The14N共␣, p0兲17O reaction exhibits
some resonances allowing traces of nitrogen to be quantified. This reaction also offers an alternative to the 14N共d,␣兲12C and 14N共3He , p兲16O nuclear reactions for profiling nitrogen in the first few microns below the surface. Moreover, by using␣-particles, Rutherford backscattering spectroscopy can be performed simultaneously with a good mass resolution to depth profile high Z elements in the sample. The sensitivity of these reactions共0.1%兲 has been tested by measuring the nitrogen traces in a titanium oxide film deposited on silicon. Depth profiling of nitrogen in a TiN layer on a silicon substrate was also performed. In addition, we publish for the first time some cross-sections values for the 14N共␣, p1兲17O reaction at 90° and 165°; this measurement is a challenging task. © 2008
American Institute of Physics.关DOI:10.1063/1.3000661兴
I. INTRODUCTION
Light elements such as hydrogen, carbon, nitrogen, and oxygen play an important role in the surface treatment of steels, glasses, and polymers. Protective, decorative, or ad-hesive coatings can be made by various techniques such as ion implantation, ion beam assisted deposition, chemical va-por deposition, and physical vava-por deposition共PVD兲. Depth profiling of these light elements is often performed by means of resonant nuclear reaction analysis 共RNRA兲 induced by protons or alpha particles. RNRA gives good depth reso-lution but only for one element at a time. Quantitative analy-sis and depth profiling of nitrogen are usually performed by non-resonant nuclear reaction analysis 共NRA兲 induced by deuterons or 3He particles. Although the cross-sections for 共d,p兲 and 共d,␣兲 reactions on light elements are usually higher than those for the共3He ,␣兲 or 共3He , p兲 reactions, deu-terons produce an important flux of neutrons and many labo-ratories are not allowed to accelerate deuterons. An alterna-tive solution to analyze nitrogen can be the nuclear reactions induced by 3He particles. The cross-sections of the
14N共3He , p兲16O and 14N共3He ,␣兲13N reactions were
mea-sured precisely for the first time 15 years ago1 at different angles and for energies between 1.6 and 2.8 MeV. It is worth mentioning that reactions induced by 3He particles at the same energy produce 100 times fewer neutrons than共d,p兲 or 共d,␣兲 reactions. They are also more sensitive to the near surface since the stopping power is higher for 3He than for deuterons of the same energy. However, 3He gas is very expensive and most laboratories do not use such particles.
Another alternative solution to quantify nitrogen is to use reactions induced by ␣-particles such as 14N共␣,␣兲14N and 14N共␣, p兲17O. These reactions are sensitive to the near
surface and Rutherford backscattering spectroscopy 共RBS兲 can be performed simultaneously with a good depth reso-lution to quantify heavy elements. For light elements, when the energy increases, the nuclear interaction between the in-cident ␣-particle and the target nucleus must by taken into account and the cross-section shows large variations in inten-sity due to resonances. The analysis technique is called back-scattering spectroscopy 共BS兲.
A picture of the 14N共␣, p0兲17O reaction in an ionization
chamber was photographed in 1925 by Blackett and Lees,2 so it was one of the first nuclear reaction to be studied even before accelerator technology. Although this reaction has a negative Q-value 共−1.19 MeV兲, it is a good candidate for analyzing nitrogen quantitatively. Since 1958, the
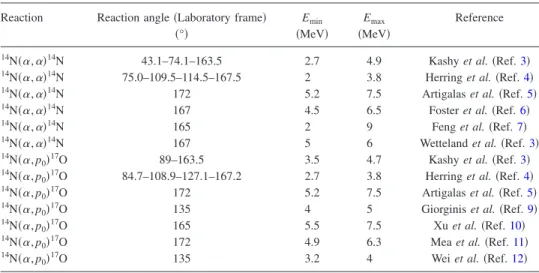
14N共␣,␣兲14N 共Refs. 3–8兲 and 14N共␣, p兲17O 共Refs. 3–5 and
9–12兲 reactions have also been studied at various angles by
different authors in the MeV energy range. The data are sum-marized in TableIand will be compared with our data in the result section. Discrepancies in the energy scale as well as in intensity are observed. Although the 14N共␣, p0兲17O reaction cross-section at lab= 135° has been measured recently,9,12
only one measurement aroundlab= 90° has been done some
50 years ago by Kashy et al.3Moreover, an interference oc-curs between the ␣-particles emitted at 165° from the
14N共␣,␣兲14N reaction and the protons emitted from the 14N共␣, p
0兲17O for energies around 3.9 MeV, which is close to
the 3.7 MeV resonance. To avoid this interference, we placed another particle detector at 165° relative to the incident beam
a兲Electronic mail: guy.terwagne@fundp.ac.be.
共2008兲
with a 3 m absorber foil. The energy loss by␣-particles in the foil is greater than the energy loss for protons and the interference disappears. It is important to note that what we call here the 3.7 MeV resonance is actually a peak due to the presence of different resonances that are not resolved 共3.67 and 3.72 MeV兲. It is almost the case for the other so-called resonances in the following parts.
In this paper, we will measure the14N共␣,␣兲14N and the
14N共␣, pi兲17O 共i=0,1兲 cross-sections over a wide range of
energies 共3.5–6.0 MeV兲 at different angles 共90°, 135°, and 165°兲 by using a standard thin coating of Ta implanted with nitrogen. We will also present two applications to determine the sensitivity and the depth profiling capabilities of those reactions.
II. EXPERIMENTAL PROCEDURE A. Standard preparation
Cross-section measurements require the use of standards containing a well-known and large amount of nitrogen. In this case, we used a TaN specimen produced by nitrogen implantation into Ta. Such a sample has all the qualities of a good standard: it is easily reproducible, it contains a large amount of nitrogen 共⬃50 at. %兲, and it has long-term sta-bility under ion beam irradiation. We did not use the standard that we suggested in a previous paper,13 which consists of nitrogen implantation at high temperature in silicon. Al-though this kind of standard exhibits excellent qualities as reported in our paper,13it is not suitable because an interfer-ence occurs around 4 MeV from the28Si共␣, p0兲31P reaction.
A pure tantalum layer共450 nm兲 was first deposited by PVD on a polished glassy carbon disk 共20 mm diameter兲. Carbon was chosen as substrate in order to reduce the back-ground under the nitrogen peak to almost zero. This in-creases the sensitivity of the measurements especially for the energy regions where the cross-section is very low. A thin tantalum nitride layer was produced by 120 keV 14N2+ im-plantation at room temperature and a dose of 1018 atoms/cm2 in the Ta layer. Such a dose produces the
-TaN rich nitrogen phase15,16
and a nitrogen depth profile as a plateau, which contains around 60 at. % of nitrogen. The
total amount of tantalum and the retained dose of nitrogen 共6.0⫾0.2⫻1017 14N/cm2兲 can be measured during all the
excitation measurements because the lack of tantalum signal is due to the implanted nitrogen; moreover, it is well known that the elastic cross-section for Ta is still Rutherford in the considered energies. The thickness of the Ta layer was cho-sen to ensure optimal cho-sensitivity of the reaction. Figure 1
shows a spectrum recorded on the TaN standard at a back-ward angle of 165° for 4.6 MeV ␣-particles, an energy re-gion just above the resonance located at ER= 4.5 MeV. At that energy, the cross-section of the14N共␣,␣兲14N reaction is very low. It is clearly seen that the nitrogen region is almost free of background contributions so that the sensitivity is increased. We have also plotted a simulation for a thick Ta substrate 共solid gray line兲. The low-intensity nitrogen peak would not be distinguished from the experimental back-ground.
TABLE I. Data from the literature concerning the14N共␣,␣兲14N and14N共␣, p
0兲17O reactions.
Reaction Reaction angle共Laboratory frame兲 Emin Emax Reference
共°兲 共MeV兲 共MeV兲
14N共␣,␣兲14N 43.1–74.1–163.5 2.7 4.9 Kashy et al.共Ref.3兲 14N共␣,␣兲14N 75.0–109.5–114.5–167.5 2 3.8 Herring et al.共Ref.4兲 14N共␣,␣兲14N 172 5.2 7.5 Artigalas et al.共Ref.5兲 14N共␣,␣兲14N 167 4.5 6.5 Foster et al.共Ref.6兲 14N共␣,␣兲14N 165 2 9 Feng et al.共Ref.7兲 14N共␣,␣兲14N 167 5 6 Wetteland et al.共Ref.3兲 14N共␣, p
0兲17O 89–163.5 3.5 4.7 Kashy et al.共Ref.3兲 14N共␣, p
0兲17O 84.7–108.9–127.1–167.2 2.7 3.8 Herring et al.共Ref.4兲 14N共␣, p
0兲17O 172 5.2 7.5 Artigalas et al.共Ref.5兲 14N共␣, p
0兲17O 135 4 5 Giorginis et al.共Ref.9兲 14N共␣, p
0兲17O 165 5.5 7.5 Xu et al.共Ref.10兲 14N共␣, p
0兲17O 172 4.9 6.3 Mea et al.共Ref.11兲 14N共␣, p
0兲17O 135 3.2 4 Wei et al.共Ref.12兲
FIG. 1. Backscattering spectra for 4.6 MeV␣-particles observed at 165° on TaN/Ta standards without absorber in front of the detector: experimental points on the thin Ta共14N兲/C standard 共dots兲 and simulation for TaN on a
thick Ta backing共solid gray line兲. In insert, the mean of the background on the left and right of the reaction peak is subtracted from the nitrogen peak to calculate the cross-section. 14N␣ and 14Np0 notations are for the
14N共␣,␣兲14N and14N共␣, p
0兲17O reactions, respectively.
B. Accelerator energy calibration
All the measurements were done with Accélérateur
Linéaire pour l’Analyse et l’Implantation des Solides
共AL-TAÏS兲, the 2 MV Tandetron™ accelerator installed at LARN 共Namur, Belgium兲. In order to calibrate the voltage of the terminal, a large variety of 共p,n兲 neutron threshold and nuclear resonant reactions induced by protons were used. These reactions, which cover the full range of accessible voltages of the tandem accelerator, are reported in Table II. The outgoing energy of the accelerated beam is given by the following formula:
E =共Vc+ Ve+ Vt兲 M
Mtot
+ qVt, 共1兲
where Vcand Veare the cathode共30 kV兲 and the extraction voltages 共3 kV兲 of the source of negative ions by cesium sputtering, respectively, Vtis the theoretical terminal voltage,
M and Mtot are the masses of the outgoing cation and the incoming anion, respectively, and q is the charge state of the outgoing cation. Generally, the incoming anion and the out-going cation have the same masses except for producing heavy ion beams with a very short lifetime, such as N− for
example. In Table II, the theoretical terminal voltages, Vt, calculated from formula 共1兲 using energies calculated from the 2003 mass evaluation from Wapstra et al.14are compared with the terminal voltages actually applied, Vexp, for
AL-TAÏS. A linear regression through origin between Vtand Vexp
gives a correlation coefficient of R = 1. The relationship be-tween theoretical and applied terminal voltage is given by
Vt= Vexp⫻ 1.0053共⫾0.0002兲. 共2兲
The excellent correlation means that the beam energy is not affected by the geometry of all elements included in the ac-celerator 共source, LE acceleration and/or HE acceleration, magnet and slits兲. For ten years, the coefficient between Vt and Vexphas changed in a few 10−4, which shows that solid
state power supply of dynamitron is very reproducible. Nev-ertheless, only the voltmeter generator could affect the slope of formula 共2兲. Resonant reactions shown in Table II are regularly used for depth profiling elements in materials, and good reproducibility is observed for the experimental voltage
Vexp. The beam energy spread is given principally by the
ripple of the high voltage terminal共⬃120 V兲, which means
that the precision of the␣beam energy is better than 1 keV.
C. Detection geometry
We have measured the 14N共␣,␣兲14N cross-section at 165° and the 14N共␣, pi兲17O cross-sections 共for i=0,1兲 at three different angles 共90°, 135°, and 165°兲. Each particle detector 共Planar Implanted Passivated Silicon 共PIPS兲兲 was positioned with a precision better than 0.5° for the angle. The first detector, named NRA 1, was placed 51 mm from the beam impact at 90° relative to the incident beam. A rectan-gular collimator共4⫻13 mm2兲 defined a solid angle of 20.0 msr. The second detector, named NRA 2, was positioned 50 mm from the beam impact at 135° relative to the incident beam. A rectangular slit共4⫻13 mm2兲 defined a solid angle of 20.8 msr. For both NRA detectors, Mylar™ absorber foils were placed in the path of the detected particles to stop the
␣-scattered particles. The thickness of the absorber foils de-pended on the incident energy for the excitation measure-ments. For energies between 3.5 and 4.5 MeV, an 18.2 m absorber foil was sufficient to stop the scattered particles, while for energies above 4.5 MeV a thickness of 36.6 m was necessary. A third 25 mm2detector共PIPS兲, named RBS
L detector and placed 80 mm from the beam impact at back-ward angle共165°兲 and having a solid angle of 3.91 msr, was also used to measure the total amount of␣-particles imping-ing the specimen. Finally, in order to avoid the interference between␣ particles emitted from the 14N共␣,␣兲14N reaction and the protons emitted from the 14N共␣, p0兲17O reaction for energies around 3.9 MeV, we placed another particle detector at 165° relative to the incident beam with a 3 m Mylar™ absorber foil. The energy loss by ␣-particles in the foil was greater than the energy loss by protons and the interference disappears. Note that another interference between
14N共␣, p
0兲17O and 16O共␣,␣兲16O around 5 MeV can also be
avoided by using experimental data from this last detector.
D. Cross-section determination
The backscattering cross-section at 165° was calculated using the following expression:
冉
d共E兲 d⍀冊N
=ANcosin
⍀3Ni共Nt兲N
, 共3兲
where ANis the area under nitrogen peak,inis the incident
angle between the incident beam and the normal of the sample 共in= 15° in this case兲, Ni is the number of incident
ions, ⍀3 is the solid angle subtended by the third detector
共RBS L兲, 共Nt兲N is the number of nitrogen atoms present in the TaN layer, and E is the mean energy of the particles in the nitride layer. This mean energy is calculated assuming a homogeneous nitride layer rather than the real implanted depth profile, which is very close to a rectangular shape. Both distributions give the same results. The background un-der the nitrogen peak was removed by selecting the average background on the left and on the right of the peak共Fig.1兲.
The same relation can be written for the Rutherford cross-section for Ta
TABLE II. Nuclear reaction thresholds calculated using Wapstra 2003 mass evaluation共Ref.14兲 and resonances used for calibrating the terminal voltage of the Tandetron accelerator. Vtand Vexpare the theoretical and the
experi-mental voltages of the terminal, respectively.
Reaction Ethor ER Vt Vexp Reaction type
共keV兲 共kV兲 共kV兲 7Li共p,n兲7Be 1880.36 923.68 919.3 Threshold 9Be共p,n兲9B 2057.24 1012.12 1006.9 Threshold 11B共p,n兲11C 3017.80 1492.40 1483.3 Threshold 13C共p,n兲13N 3235.48 1601.24 1593.0 Threshold 15N共p,n兲15O 3774.05 1870.53 1861.4 Threshold 19F共p,␣y兲16O 340.46 153.73 153.53 Resonance 19F共p,␣y兲16O 872.11 419.56 416.87 Resonance 15F共p,␣y兲12C 429.00 198.00 197.71 Resonance
冉
d共E¯兲 d⍀冊
Ta= ATacosin ⍀3Ni共Nt兲Ta
, 共4兲
with the same parameters as in Eq. 共3兲 relative to tantalum except for the energy, which is the mean energy of
␣-particles in the Ta coating. This approximation, which as-sumes that the particles have a mean energy over the entire Ta layer, leads to a negligible error estimated between 1% and 2%. The ⍀3Niproduct is determined by means of
SIM-NRA 共Ref. 17兲 simulations for each different spectrum.
Fi-nally, the backscattering cross-section of ␣-particles from
14N can be calculated by the following formula:
冉
d共E兲 d⍀冊N
= AN ATa 共Nt兲Ta 共Nt兲N冉
d共E¯兲 d⍀冊
Ta , 共5兲where共d共E¯兲/d⍀兲Tais the theoretical cross-section that is in very good agreement with the experimental cross-section 共less than or equal to 1% of discrepancies兲. For the NRA detectors, we used the same formula corrected for the solid angle ratio⍀3/⍀i. As we eliminate some of the main sources
of uncertainties共integrated charge, solid angle兲, the precision on the measured cross-section is enhanced.
Carbon contamination due to buildup is regularly ob-served when long irradiation times are necessary, especially when cross-sections are measured over a large energy range. This phenomenon is mainly due to the residual gas in the beam line, where the vacuum is typically 10−4 Pa. In order to improve the statistics and obtain a good precision, the integrated charge at each energy was typically limited to 20 C where resonances were observed and 100 C for the plateau where the cross-section was low. We took into ac-count the buildup of carbon by regularly measuring its con-tent using the 12C共␣,␣兲12C resonant reaction at E␣ = 4.265 MeV.18The evolution of carbon contamination ver-sus integrated charge was fitted by a straight line
NC=共0.150 ⫾ 0.006兲Q, 共6兲 where NC is given in 1015 atoms/cm2 and Q is the total
integrated charge given inC. The energy loss⌬E关eV兴in the contamination layer was then calculated by
⌬E = Nc, 共7兲
where is the stopping cross-section 关eV/共1015 atoms/cm2兲兴. Typical energy corrections were
less than 1 keV. We have also regularly changed the position of the beam spot on the TaN standard to reduce the buildup of carbon contamination, especially where large variations in the cross-section共resonances兲 were encountered.
The statistical uncertainty on the nitrogen peak is esti-mated to be in the range of 6%–9% and the error on the nitride layer thickness does not exceed 3%. So, the total imprecision on the cross-section is typically 7%–10%. The error on the nitride layer comes from the difference between the experimental spectra and the simulation done with
SIMNRA.17 The precision of the energy provided by the Tan-detron accelerator ALTAÏS and the correction made on the energy loss in the carbon contamination layer allow us to
reduce the uncertainty associated with the energy to below 1 keV.
III. RESULTS
Figure2 shows the 14N共␣,␣兲14N reaction cross-section at 165° for energies between 3.5 and 6.0 MeV, including the error bars. In this figure, the 3.7 MeV resonant cross-section is only for the14N共␣,␣兲14N reaction共the contribution of the
14N共␣, p
0兲17O reaction has been subtracted兲. This treatment
has been applied for all data for which interference between the alpha and proton peaks is observed. Those data corre-spond to the energies between 3.5 and 4.15 MeV. It is esting to notice that this range is not centered on the inter-ference energy共⬃3.9 MeV兲. This is due to the thickness of the target, which is enhanced by the straggling effect, pro-viding a loss in resolution in the low energy part of the alpha and proton peaks.
This cross-section has to be compared with the data in the literature,3,4,6–8which are also reproduced in Fig.2. The most interesting data to be compared are coming from the work of Feng et al.7that is, to the best of our knowledge, the only study that has data in the same range of energies. The values of this work are in relatively good agreement with Feng’s measurements, except for energies ranging from 4.6– 4.85 MeV and 5.2–5.65 MeV, where the cross-section is lower. The measurements made by Foster et al.6and Wette-land et al.8 confirmed this disagreement 共Fig. 2兲. Between
FIG. 2.共Color online兲 Comparison between the results obtained in this work and the data of the literature 共Refs.3,4, and6–8兲 for the 14N共␣,␣兲14N
reaction at 165° for energies between共a兲 3.5–4.25 MeV and 共b兲 4.25–6.0 MeV.
4.6 and 4.85 MeV, the values of this work are between Feng and Foster ones. In the range of 5.2–5.65 MeV, our values present the same shape than Foster’s but nearly the same intensity than Wetteland’s. Moreover, we can see that our measurements are shifted by about 15 keV toward the higher energies. This could be important if one wants to use the 4.45 MeV resonance to probe a sample. Also, the 3.7 MeV reso-nance is significantly decreased by nearly 30%. This is partly due to the subtraction of the 14N共␣, p0兲17O contribution.
Also, the energy resolution is not comparable to the ones of Feng et al.,7 Herring et al.,4 and Kashy et al.3 due to the different targets used in the different works. Our nitrogen target is thicker共⬃52 keV compared with, for purpose, the ⬃16 keV of Feng et al.7
for the energy loss of alpha par-ticles around 3.7 MeV兲, which results in a mean and there-fore lower value for the cross-section because the energy loss in the target can be larger than the width of some resonances. Moreover, the共␣, p0兲 cross-section at the interference energy 共3.9 MeV兲 is around 3 mb/sr, which is lower than 20 mb/sr at the resonance energy. The correction is then very relevant especially if one uses an absorber in front of the detector. Nevertheless, the intensity of the cross-section above the 3.7 MeV resonance up to 3.9 MeV is in relatively good agree-ment with the previous measureagree-ments.
Regarding the data from the literature, a sharp resonance is seen around 3.575 MeV. This one is not really exhibited in this work, nor another one around 5.68 MeV. This is still due to the thickness of the target used, as well as for the lower intensity of the 4.45 MeV resonance. Finally, below the 3.575 MeV resonance where there are important discrepan-cies, the values reported here draw nearer to the ones of Herring et al.4 and Kashy et al.,3 contrary to the work of Feng et al.7 where the 3.575 MeV resonance is also unex-pectedly lower.
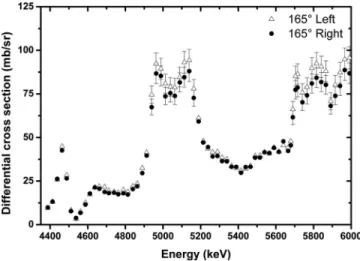
For energies ranging from 4.4 to 6.0 MeV, the
14N共␣,␣兲14N cross-section at 165° was simultaneously
mea-sured with the two detectors placed symmetrically on the left and on the right relative to the alpha beam 共Fig. 3兲. The
results show a very good similarity, given the merging of the errors bars.
Concerning the 14N共␣, p0兲17O reaction, three different angles were investigated: 90°, 135°, and 165°. The results are shown in Fig. 4 and compared with the scanned data available in the literature.3,9,10,12 The error bars were calcu-lated in the same way as for the previous reaction.
At 90°, our data points are compared with the ones of Kashy et al.3The intensities are very similar but an energy shift can be observed, which is around 40 keV at the 4.5 MeV resonance. Oddly, this energy shift seems to increase with energy, which is very unusual. Nevertheless, this strange characteristic is also present for the 14N共␣,␣兲14N reaction at 165°共Fig.1兲, meaning that the problem does not
come from our measurements. There are two references for this reaction at 135°,9,12 allowing a comparison from 3.5 to 5.0 MeV. Again, the intensities are in very good agreement, although an energy shift is present, and our values are about 20 keV higher than the ones of Wei et al.12and Giorginis et
al.9 Finally, at 165°, we can compare our results with the ones of Kashy et al.3from 3.5 to 4.65 MeV. An energy shift is also observed similar to the one noted at 90°, but the intensities are very close. The data of Xu et al.10 are also available from 5.5 to 6.0 MeV; these are systematically higher than our results and present also an energy shift.
Comparatively, the 3.7 MeV resonance increases sub-stantially with the recoil angle of detected protons, as already observed by Kashy et al.3 Thus, this angle of 165° is very interesting but this energy corresponds to the interference window with the14N共␣,␣兲14N reaction. So, it is necessary to
FIG. 3. Comparison between the differential cross-sections measured with the two detectors placed at 165°. The error bars are given in the regions presenting the biggest discrepancies.
FIG. 4. 共Color online兲 Differential cross-section of the14N共␣, p0兲17O
reac-tion at 90°, 135°, and 165° for energies between 3.5 and 6.0 MeV. The error bars are shown. Some data coming from the literature have been added for comparison共Refs.3,9,10, and12兲.
work with an absorber and it is important to get a precise knowledge of the two cross-sections. This could be an alter-native way to measure small quantities of nitrogen compared with the 4.5 MeV resonance for which a higher energy is required. To do this, it is necessary to place two detectors symmetrically to the incident beam: the first one as a共R兲BS monitor and the second one as the NRA detector with the appropriate absorber to stop the scattered ␣-particles. In-versely, the resonance around 4.0 MeV decreases with the angle, while the 4.2 and 4.5 MeV resonances seem not to be angle dependant. Thanks to its large cross-section, the 4.5 MeV resonance is clearly suitable for quantifying nitrogen traces in any sample共see first application below兲. Finally, the 5.2 MeV resonance increases with detection angle, just as the 3.7 MeV resonance does.
At higher energies, the trend is toward a general increase in the cross-section due to the increase in the level density, although there is a high angular dependence at 90° with a slight valley around 5.5 MeV. This angle is also very inter-esting between 4.6 and 4.8 MeV and 5.1 and 5.35 MeV because the cross-section exhibits two plateaus with rela-tively high values 共around 6–8 mb/sr, respectively兲. Those values can be used to depth profile nitrogen over several hundreds of nanometers, as illustrated in the second applica-tion below. Still at 90°, the cross-secapplica-tion increases to 6.0 MeV. It would be interesting to obtain measurements at higher energies to investigate whether they underline a reso-nance.
Finally, Fig. 5 gives some results concerning the
14N共␣
, p1兲17O reaction cross-section, which are, to the best
of our knowledge, the first published in the literature cer-tainly because of the negative Q-value共−2.06 MeV兲 and the low intensity of the cross-section, as commented by Herring
et al.4The error bars are shown and are a little larger than for the other cross-sections共9%–11%兲. Our measurements con-firm that the resonance around 5.2 MeV shows the same angular evolution as the14N共␣, p0兲17O reaction. This trend is
observable for all energies for which the data are available.
In addition to a resonance at 5.72 MeV that can be put in relation to an observable increase for the 14N共␣, p0兲17O
re-action, the cross-section is also rising up to 6.0 MeV for this reaction. This observation gives a good reason to perform other measurements to confirm these values with the aim of simulating关withSIMNRA共Ref.17兲 for instance兴 perfectly all
contributions to an experimental spectrum.
IV. APPLICATIONS
When the energy of an ␣ particle is increasing 共⬎2 MeV兲, the minimal distance between the projectile and the target nucleus is decreasing and nuclear interaction has to be taken into account. As a consequence, diffusion cross-section decreases on heavy elements共as 1/E2兲 and the
cross-section for light elements increases. Both examples given below show that trace analysis or depth profiling of light elements is possible combining共R兲BS and NRA.
A. Trace analysis
A first application for this work, which illustrates its use-fulness, is the characterization of a coating of TiO2deposited
by PVD on a Si substrate in a reactive O2atmosphere. In this
case, nitrogen traces are only due to residual vacuum before introducing a reactive gas. It is impossible to get information from the nitrogen traces in the layer with共R兲BS at 165°, as the nitrogen signal cannot be distinguished from the silicon background, which shows large variations due to nuclear in-teractions between the projectile and the28Si nuclei. This can be overcome with a NRA detector at 90° or 135°. In this case, a detector was placed at 90° with a 24.4 m Mylar absorber to stop the backscattered alpha particles. Figure 6
presents the 共a兲 共R兲BS and 共b兲 NRA spectra obtained with 4.5 MeV alpha particles on the sample described above. This energy was chosen because of the 4.5 MeV resonance under-lined in Fig. 4. These spectra were fitted with the SIMNRA
共Ref. 17兲 software by using the cross-sections for nitrogen
measured in this work and the cross-sections from IBANDL
database for other elements关12C,1816O,19and28Si共Ref.20兲兴.
The resonance for the14N共␣, p0兲17O reaction is visible on the
NRA spectrum, while the nitrogen signals 共14N共␣, p0兲17O
and14N共␣,␣兲14N兲 on the 共R兲BS spectrum are not visible. It is interesting to note that the NRA cross-sections for silicon are unknown and should be measured. The results give a layer of Ti0.34O0.65N0.010, which is the TiO2 stoechiometry
with 1.0⫾0.1% nitrogen. We can evaluate the sensitivity to about 0.1% nitrogen.
B. Depth profiling of nitrogen
The second application consists of carrying out a depth profile of nitrogen in the bulk of a sample. This sample is a coating of TiN deposited by PVD on a silicon substrate and was analyzed with 5.3 MeV alpha particles. Two detectors were used: one at 165° for共R兲BS and another one at 90° for NRA to take advantage of the plateau in this angle-energy configuration. The two experimental spectra are given in Fig.
7 together with the theoretical fits. The amount of nitrogen was evaluated with the 14N共␣,␣兲14N and 14N共␣, p0兲17O
re-FIG. 5. 共Color online兲 Differential cross-section of the14N共␣, p1兲17O
reac-tion at 90° and 165° for energies between 5.0–6.0 MeV and 4.65–5.6 MeV, respectively. The error bars are shown. The lines corresponding to spline connections are to guide the eyes.
action contributions at 165° and the 14N共␣, pi兲17O 共i=0,1兲 peaks at 90°. Using the cross-sections obtained in this work for nitrogen and the cross-sections fromIBANDLdatabase for
other elements关12C,2116O,19and28Si共Ref.22兲兴, we obtained
a uniform layer of Ti0.445N0.46C0.065H0.03 of 2.35 ⫻1018 atoms cm−2 共hydrogen concentration was
deter-mined by Elastic Recoil Detection Analysis兲 below a hydro-carbon surface contamination. This single layer is physically correct to represent a deposition layer. Note that the energy resolution for the 共␣, p0兲 reaction decreases to 20% due to
the absorber. Here again, the silicon contribution was not well simulated in the 共R兲BS spectra and some nuclear
reac-tions occurring on this element need to be taken into account at 90°.
V. CONCLUSIONS
We measured the differential cross-section of the
14N共␣,␣兲14N reaction at 165° of the 14N共␣, p
0兲17O reaction
at 90°, 135°, and 165° and, for the first time, of the
14N共␣, p
1兲17O reaction at 90° and 135°. The results have
been compared with the data in the literature when available and show a good agreement. The method used is very simple and accurate, thanks to the light substrate 共carbon兲 and the
FIG. 6. Application of the cross-section measurements on TiO2
depos-ited in a N2atmosphere on a Si
sub-strate with 4.5 MeV ␣-particles. The spectra共a兲 共R兲BS at 165° and 共b兲 NRA at 90° obtained with an integrated charge of 40 C during 12 min are given with the fit done by mean of SIM-NRA 共Ref. 17兲 and the cross-sections
from IBANDL database共Refs. 18–20兲. The arrows indicate the energies of the backscattered ␣-particles on the ele-ments present on the surface 共except for Si兲. The 14N contribution at the surface should appear at the corre-sponding arrow: it is not visible on the 共R兲BS spectrum but well on the NRA one.
FIG. 7. Application of the cross-section measurements on a TiN layer deposited on a silicon substrate with 5.3 MeV␣-particles. The spectra共a兲 共R兲BS at 165° and 共b兲 NRA at 90° are given with the fit done by mean of SIM-NRA 共Ref. 17兲 and the cross-sections from IBANDLdatabase 共Refs. 19,21, and22兲. The arrows indicate the ener-gies of the backscattered ␣-particles on the elements present at the surface 共except for Si兲.
heavy matrix共tantalum兲 that allow us to evaluate the number of the incident alpha particles and the amount of nitrogen.
The 3.7 MeV resonance for the14N共␣,␣兲14N reaction is decreased compared with the work of Feng et al.7because of the subtraction of the 14N共␣, p0兲17O contribution. We
deter-mined some angular evolutions for the 14N共␣, pi兲17O reac-tions共i=0,1兲. Our results suggest that it is ideal to work at 90°. Indeed, this angle presents a plateau below 5.3 MeV that can be used to depth profile nitrogen and a high resonance at 4.5 MeV, allowing the analysis of nitrogen traces or its pres-ence at an interface. This was applied for two different samples, demonstrating the good quality of the cross-section measurements.
ACKNOWLEDGMENTS
G.G. was supported as research fellow by the Belgian National Fund for Scientific Research 共F.R.S.-FNRS兲 and M.Y. by the Natural Science and Engineering Research Council of Canada共NSERC兲. This work was realized within the SC-TEC-02 collaboration between the Wallonie-Bruxelles Community and the Québec government.
1G. Terwagne, D. D. Cohen, and G. A. Collins,Nucl. Instrum. Methods
Phys. Res. B84, 415共1994兲.
2P. M. S. Blackett and D. S. Lees,Proc. R. Soc. London, Ser. A136, 325
共1932兲.
3E. Kashy, P. D. Miller, and J. R. Risser,Phys. Rev.112, 547共1958兲. 4D. F. Herring, R. Chiba, B. R. Gasten, and H. T. Richards,Phys. Rev.112,
1210共1958兲.
5H. Artigalas, A. Chevarier, N. Chevarier, M. El Bouanani, E. Gerlic, N.
Moncoffre, B. Roux, M. Stern, and J. Tousset, Nucl. Instrum. Methods Phys. Res. B 66, 237共1992兲.
6L. A. Foster, J. R. Tesmer, T. R. Jervis, and M. Nastasi, Nucl. Instrum.
Methods Phys. Res. B 79, 454共1993兲.
7Y. Feng, Z. Zhou, C. Zhang, and F. Yang,Nucl. Instrum. Methods Phys.
Res. B94, 11共1994兲.
8C. J. Wetteland, C. J. Maggiore, J. R. Tesmer, X.-M. He, and D.-H. Lee,
AIP Conf. Proc. 475, 545共1999兲.
9G. Giorginis, P. Misaelides, A. Crametz, and M. Conti, Nucl. Instrum.
Methods Phys. Res. B 113, 396共1996兲.
10H. Xu, Z. Zhou, C. Zhang, G. Zhao, and L. Shi,Nucl. Instrum. Methods
Phys. Res. B149, 390共1999兲.
11G. D. Mea, A. Patelli, S. Restello, V. Rigato, and A. Vomiero, Nucl.
Instrum. Methods Phys. Res. B240, 803共2005兲.
12P. Wei, S. C. Gujrathi, M. Guihard, and F. Schiettekatte,Nucl. Instrum.
Methods Phys. Res. B249, 85共2006兲.
13M. Yedji, M. Bolduc, G. Genard, G. Terwagne, and G. G. Ross,Nucl.
Instrum. Methods Phys. Res. B266, 2060共2008兲.
14A. H. Wapstra, G. Audi, and C. Thibault,Nucl. Phys. A729, 129共2003兲. 15X. Zhou, H. K. Dong, and H. D. Li,Vacuum39, 307共1989兲.
16W. J. Wang, T. M. Wang, and X. J. Wang,Nucl. Instrum. Methods Phys.
Res. B108, 300共1996兲.
17M. Mayer,AIP Conf. Proc.475, 541共1999兲.
18J. A. Leavitt, L. C. McIntyre, P. Stoss, J. G. Oder, M. D. Ashbaugh, B.
Dezfouly-Arjomandy, Z. M. Yang, and Z. Lin, Nucl. Instrum. Methods Phys. Res. B 40–41, 776共1989兲.
19J. Demarche and G. Terwagne,J. Appl. Phys.100, 124909共2006兲. 20M. K. Leung, Ph.D. thesis, University of Kentucky, 1972.
21Y. Feng, Z. Zhou, Y. Zhou, and G. Zhou,Nucl. Instrum. Methods Phys.
Res. B86, 225共1994兲.
22H.-S. Cheng, H. Shen, F. Yang, and J.-Y. Tang,Nucl. Instrum. Methods
Phys. Res. B85, 47共1994兲.