Conviction Statistics as an Indicator of Crime Trends
in Europe from 1990 to 2006
Marcelo F. Aebi&Antonia Linde
Published online: 24 December 2011
# Springer Science+Business Media B.V. 2011
Abstract Convictions statistics were the first criminal statistics available in Europe during the nineteenth century. Their main weaknesses as crime measures and for comparative purposes were identified by Alphonse de Candolle in the 1830s. Currently, they are seldom used by comparative criminologists, although they provide a less valid but more reliable measure of crime and formal social control than police statistics. This article uses conviction statistics, compiled from the four editions of the European Sourcebook of Crime and Criminal Justice Statistics, to study the evolution of persons convicted in European countries from 1990 to 2006. Trends in persons convicted for six offences–intentional homicide, assault, rape, robbery, theft, and drug offences– and up to 26 European countries are analysed. These trends are established for the whole of Europe as well as for a cluster of Western European countries and a cluster of Central and Eastern European countries. The analyses show similarities between both regions of Europe at the beginning and at the end of the period under study. After a general increase of the rate of persons convicted in the early 1990s in the whole of Europe, trends followed different directions in Western and in Central and Eastern Europe. However, during the 2000s, it can be observed, throughout Europe, a certain stability of the rates of persons convicted for intentional homicides, accompanied by a general decrease of the rate of persons convicted for property offences, and an increase of the rate of those convicted for drug offences. The latter goes together with an increase of the rate of persons convicted for non lethal violent offences, which only reached some stability at the end of the time series. These trends show that there is no DOI 10.1007/s10610-011-9166-7
M. F. Aebi (*)
:
A. LindeSchool of Criminal Sciences, Institute of Criminology and Criminal Law, University of Lausanne, ESC-ICDP-Sorge-BCH, CH-1015 Lausanne, Switzerland
e-mail: [email protected] A. Linde
e-mail: [email protected] A. Linde
Department of Law and Political Science, Universitat Oberta de Catalunya (Open University of Catalonia), Avinguda Tibidabo, 39-43, 08035 Barcelona, Spain e-mail: [email protected]
general crime drop in Europe. After a discussion of possible theoretical explanations, a multifactor model, inspired by opportunity-based theories, is proposed to explain the trends observed.
Keywords Alphonse de Candolle . Central and Eastern Europe . Convicted persons . Conviction statistics . Crime drop . Crime trends . European Sourcebook . Internet . Routine activities approach . Western Europe
Introduction
This article analyses the evolution of convicted offenders for six different offences in up to 26 European countries, from 1990 to 2006. The first part of the article discusses the value of conviction statistics as a measure of crime and formal social control, paying special attention to the historical development of such statistics and the debate about their validity and reliability over two centuries. This is followed by a methodological section that presents the data from the European Sourcebook of Crime and Criminal Justice Statistics used for the analyses, together with the validity checks and statistical procedures applied to improve their quality. The results of the analyses are shown in the third section, which presents and describes trends for each offence in the whole continent as well as in Western Europe and in Central and Eastern Europe. Finally, the discussion section reviews the different theoretical explanations that could be proposed to explain such trends and the current debate about the so-called crime drop in industrialized countries. It also proposes an explanation of crime trends based on a multifactor model that draws on opportunity-based theories and takes into account the political, economical and social changes observed in Europe during the last two decades.
Conviction Statistics as a Measure of Crime and Formal Social Reaction Historical Development of Conviction Statistics
Conviction statistics, also known as court statistics and judiciary statistics, were the first official statistics –i.e. statistics produced by the State– on crime available in Europe. Sweden had vital statistics–i.e. statistics on the causes of death– on the number of victims of homicide since the 1750s, and the same is true for Finland, which was a part of Sweden until 1809 (von Hofer1990). Figures of committals for indictable crime–which correspond to persons charged for felonies and for misdemeanours tried by a jury (Hastings 2001)– started to be published annually in England and Wales in 1810, with data going back to 1805 (Emsley 2005: 22).1 But the first comprehensive national criminal statistics were introduced in France in 1825. They were followed by the ones published in Denmark in 1828 and in Sweden in 1836, and all these statistics were based on court data.
The French statistics–published in 1827 with data from 1825– were called the Compte général de l’administration de la justice criminelle en France. They were “divided into four parts: the first included all prosecutions in the assize courts; the second, the verdicts of correctional tribunals; the third, the verdicts of the tribunals of the police courts; and the fourth, 1
In contemporary terms, they can be seen as a sort of prosecution statistics that cover the cases brought before a court for some types of offences only.
statistical information about the criminal process from other jurisdictions such as the royal courts. For each département, the Compte measured the annual number of known and prosecuted crimes against persons and property, whether the accused (if prosecuted) were acquitted or convicted, as well as the punishment accorded [to] the latter” (Beirne1993: 74). According to Christiansen and Gram Jensen (1972), official criminal statistics in Denmark date back to 1828, and the first four annual surveys were published in a governmental periodical. They were called sanction statistics and were based on the number of convictions and other sanctions, and not on the number of persons convicted. However, the first 12 years of these statistics were not reliable; as a consequence, trends can only be established since 1841 (Christiansen and Gram Jensen1972).
In Sweden, since 1836, the national statistics included statistics on crimes (Lindström 2008). These statistics were based on court sentences and other findings of guilt, such as summary fines and waivers of prosecution (von Hofer2000b,2003).
The statistical series published in England and Wales since 1810 were partial–they did not cover non-indictable offences, which can be tried without a jury (Hastings2001)– and considered by the local researchers as inaccurate and clearly less sophisticated than the French ones, which were seen as model in the field (Emsley2005: 22-23). It is only in 1857 that England and Wales started publishing comprehensive national criminal statistics, which combined court and police data (Maguire2007: 244). They“consisted of, first, indictable offences reported to the police that had not necessarily resulted in an arrest or been ‘solved’; second, committals for trial, both on indictment and before summary jurisdiction; and third, the number of persons convicted and imprisoned” (Emsley2005: 23).
These observations on the birth of criminal statistics allow us to place the first debates about their validity in their historical context, and to read such debates keeping in mind that they referred systematically to conviction statistics. It is only during the second half of the twentieth century that police statistics–and World Health Organization data on deaths due to homicide and intentional injury (WHO health statistics)– became the main measure used by criminologists interested in comparative research. The key reason for that choice could seem merely empirical: Interpol started publishing data on offences recorded by police forces across the world in 1954 (Stamatel 2006) –a collection that was unfortunately discontinued by a resolution of Interpol’s General Assembly in 20062–, creating thus a
major database for comparative criminologists. However, the development of the Interpol data collection was, at least partially, one of the practical results of a former theoretical discussion on the validity of criminal statistics.
In fact, immediately after the publication of the French national judiciary statistics, their validity was questioned by de Candolle (1830/1987a). According to Beirne (1993: 105), de Candolle was probably the first author that mentioned the problem of the dark figure of crime. Indeed, de Candolle (1830/1987a) unveiled most of the problems related to the use of conviction statistics as measures of crime.3 In particular, he enumerated the different 2See http://www.interpol.int/public/ICPO/GeneralAssembly/AGN75/resolutions/AGN75RES19.asp. In the context of this article, it is interesting to point out that the section Frequently Asked Questions of Interpol’s website specifies that“The decision to remove the statistics was taken as some users and some members of the media were making comparisons between countries based on these statistics, when different collection methods make such comparisons problematic” (http://www.interpol.int/FAQs, last accessed on 23-09-2011). 3The contribution of Alphonse de Candole (1806-1893) to the debate on the validity of official statistics was seldom taken into account by criminologists until he was rediscovered by Bomio and Robert (1987) in the 1980s. For example, in his seminal article on the basis of a crime index, Sellin (1931) summarizes the positions of Georg von Mayr, Gabriel Tarde, and V. Verkko, but does not mention de Candolle. Nor is he mentioned in the influential works of Robinson (1910,1911) about the history and organization of criminal statistics in the United States of America.
causes of the dark figure of crime–including the offenses not discovered by their victims, the offences for which the author is unknown, the decision by the victim of not reporting the offence, and the cases in which the legal procedure does not lead to a sentence of a court– as well as the influence of the prosecution activity on sudden changes in crime trends. He also warned about cross-national comparisons because the number of unknown crimes varied from one country to another (de Candolle, 1830/1987a). One year later, the publication of Recherches sur le penchant au crime, aux différents âges par Quételet (1831) led de Candolle (1832/1987b) to publish a second text in which he tackled the idea of a constant proportion between the total number of offences committed and the number of offences known and tried by a judicial authority, which had been proposed by Quételet. In the same article, de Candolle (1832/1987b) insisted once more on the almost impossibility of performing cross-national comparisons. In particular, he explained that, if such comparisons were to be made, they should be based on the number of accused persons instead of on the number of sentenced persons. The reason was that many offences known to the prosecution authorities do not lead to a conviction. This is, indeed, the same reasoning behind the so-called Sellin’s dictum (Coleman and Moynihan 1996: 10), which stated, one hundred years after de Candolle, that “the value of a crime rate for index purposes decreases as the distance from the crime itself in terms of procedure increases” (Sellin 1931: 346, emphasis in the original). More than 35 years later, this idea was presented in a graphic way by the President’s Commission on Law Enforcement and Administration of Justice (1967: 8-9), which represented the criminal justice system as a funnel in which the number of cases decreases–because some cases are removed as they are, for example, unknown to the police or because the police, the prosecutors or the courts cannot solve them– as the process advances.4
In order to understand the position of Sellin (1931), one must place it in its historical and geographical context, which corresponds to the period in which the Uniform Crime Reporting system (UCR) was created in the United States. One of the main decisions that had to be taken at that moment was whether to use court or police data as a basis for the UCR, which was meant to be the first comprehensive collection of criminal data at the national level. Police statistics had developed during the second half of the nineteenth century and criminologists like von Mayr–who, according to Sellin and Wolfgang (1964: 14), was the first one to use crimes known to the police to study criminality in Bavaria, Germany, in a study published in 1867– considered that they should be the main source for research on moral statistics (Robinson 1910). Simultaneously, Robinson (1910,1911) had traced the history of criminal statistics in the United States–in which many states were producing their own statistical collections, but only prison statistics were collected at the national level– and presented a plan for their reorganization. This plan was inspired by the criminal statistics available in European countries and was based on the development of judicial statistics with two correlated counting units: “the criminal” and “the crime”, i.e. persons convicted and offences for which these persons were convicted. Indeed, Robinson (1910,1911) seldom paid attention to police data and concentrated on the advantages of judicial statistics over prison statistics. At the beginning of the twentieth century, his position was shared by the American Institute of Criminal Law and Criminology (Koren1910). Nevertheless, time went by and, even if
4While a funnel or an iceberg provide a useful graphic representation of the shape of the criminal justice system, the image of a sieve with different sized meshes allows an illustration of the way in which the system works (Killias et al.2012: 342). The meshes filter out some of the cases, while a funnel would let them all pass through.
Robinson (1920) went as far as suggesting the practical way in which judicial statistics could be collected,5 the efforts to create a nationwide collection of criminal statistics continued to be unsuccessful. Moreover, the debate about the type of statistics that should be collected was heading into a different direction as the one proposed by Robinson and other statisticians.
According to Maltz (1977: 35),“By the late 1920s it was generally agreed that the crime collected by the police would be the most accurate for statistical purposes”. In that context, Robinson (1928) published an article in which he expressed his hope that“something good for criminal statistics” could come out of the public discontent with the criminal justice system (Robinson1928: 125). He did not take position about the type of criminal statistics to collect, but he expressed his worries about the fact that some states were collecting data through their bureau of criminal identification:“A bureau of criminal identification belongs within the police organization and the collection and interpretation of criminal statistics should be entirely free from the influences of any branch of the administration of criminal justice” (Robinson 1928: 127). At the same time, Vollmer (quoted by Maltz 1977: 34) considered, that“the only dependable data upon which safe conclusions may be based are the actual number and kind of complaints received by law enforcement officials”. August Vollmer was at that time chief of police of Berkeley, California, and president of the International Association of Chiefs of Police (IACP), and he was concerned about the view offered by the press of crime trends, which suggested that the United States were undergoing a crime wave (Maltz 1977; Rosen 1995). The IACP committee on Uniform Crime Records published in 1929 a very influential report (IACP,1929) that–combined with the efforts of the Laura Spelman Rockefeller Memorial (LSRM) and the Social Science Research Council (SSRC) to promote a police-based crime data system (Rosen 1995)– led the Congress of the United States, one year later, to charge the Federal Bureau of Investigation (FBI) to start collecting data for the UCR. Thus, in 1930, the national police statistics of the United States were born.
Sellin (1931) published his article immediately after that, taking position in the debate about the validity of police and conviction statistics, and suggesting indirectly the way in which the future crime index elaborated on the basis of the data collected for the URC–that he mentions in page 346, note 22– could be elaborated. This can be clearly seen in the sentence that Sellin (1931) wrote immediately after the one that was going to become his dictum:“In other words, police statistics, particularly those of ‘crimes known to the police’ are most likely to furnish a good basis for a crime index”. That sentence is accompanied by a footnote stating that he was “in complete disagreement” with the Report of the Commission for the comparative study of criminal statistics of various countries, presented in the 18th session of the International Institute of Statistics–held in Warsaw, in 1930–, which concluded that “for the purpose of determining the status and the movement of criminality in each country, it is the statistics of crimes objectively determined by irrevocable and definitive sentences which should be submitted to study” (Sellin1931: 346).
Taking into account the enormous international influence of research in criminology conducted in the United States since the 1930s, it is not exaggerated to say that the decision of the Congress to use police data for the UCR closed the scientific debate on the
5“I maintain that before the records of our criminal courts are filed away in the burying grounds of the Clerks of Quarter Sessions or similar officials, there should be something in the nature of a face-sheet attached either to the bill of indictment or to the record of the procedure before the court as a basis for criminal statistics” (Robinson1920: 161).
comparative validity of conviction and police statistics.6The UCR became for at least two decades –until the development of self-reported delinquency studies– the major source of empirical data for research, and criminologists across the world turned also to their national police statistics to conduct similar studies. Conviction statistics were reduced to a secondary role that became still less important, at the international scale, when Interpol started its collection of criminal statistics in 1954. Even the development of the United Nations Surveys on Crime Trends and the Operations of Criminal Justice Systems, UNCTS (UNODC 2010) in the second half of the 1970s–which included data on police and on conviction statistics since 1970–, did not change that situation. Nowadays, cross-national comparisons of crime levels and crime trends continue to be based mainly on police statistics and WHO health statistics. In that context, one of the goals of this article is to test–through a comparison of the trends in conviction statistics with the ones observed in police and victimization statistics (Aebi and Linde 2010)– whether conviction statistics provide an appropriate measure of crime trends at the European level.
Validity and Reliability of Conviction Statistics
In the previous chapter, we presented some of the criticisms that de Candolle (1830/1987a, 1832/1987b) addressed to the first judiciary statistics. Almost two hundred years later, his criticisms are still relevant and they continue to affect the validity of conviction statistics. Apart from the problems already mentioned, in his analysis of the problems involved in cross-national comparisons of those statistics, de Candolle (1832/1987b) highlighted the influence of the particularities of each national criminal justice system. In that context, he paid particular attention to the presence or the absence of a jury, which he considered the main cause of mistakes in the comparisons. He also identified legal definitions of offences and the procedural system of each country as major sources of distortions of the comparisons. At the beginning of the twentieth century these issues continued to be a matter of discussion. Thus, Robinson (1912), pointed out that“some states [of the United States of America] count double infractions of a particular species as separate crimes while other consider them as one”, and that “where codes do not consider the continuity of a crime it depends on the judge whether such acts shall be considered as one infraction or two” (Robinson 1912: 246). Current research also continues to pay attention to these factors, stressing the fact that the statistical counting rules applied by each country to establish its national conviction statistics render cross-national comparisons almost impossible. Thus, the metadata included in the 4th edition of the European Sourcebook of Crime and Criminal Justice Statistics (Aebi et al.2010: 165-6) shows that the majority of the European countries apply a principal offence rule, which implies that an offender
6
August Vollmer (1876-1955) later became a university professor, and the American Society of Criminology paid tribute to his memory by naming one of its Awards after him. Thorsten Sellin (1896-1994) deserved the same honour, and his dictum of 1931 is almost systematically quoted when discussing the validity of crime measures. Louis N. Robinson updated in 1933 his history of criminal statistics in the United States, dedicating a chapter to the Association of Chiefs of Police and the decision of the Congress on the UCR. In a major example of fair play in scientific research, Robinson declared:“The author has only the highest praise to bestow upon the research performed by the Committee of the International Association of Chiefs of Police” (Robinson1933: 134). He also acknowledged that“Several very practical reasons led to the decision to place the work in the Bureau of Investigation and it is very doubtful if the system could have been started in any other way” (Robinson1933: 134). It is extremely difficult to find biographical information about Robinson. The Library of Congress Online Catalogue mentions that he was born in 1880, but provides no information on the year of this death (http://catalog.loc.gov/, last accessed on 23-09-2011).
convicted for several offences will be shown only once –for the most serious offence– in conviction statistics. However, it is not completely clear whether countries determined the seriousness of the offence on the basis of its nature, the punishment imposed or the maximum applicable sentence. There are also differences regarding the point at which data is collected for the statistics because some countries record court decisions before any appeal and others record them after the appeals have been exhausted (Aebi et al. 2010: 165-6).
Those and similar related problems affect the validity of conviction statistics not only when they are used at the macro-level –e.g. for comparisons across countries–, but also when they are used as a measure of crime at the individual level. Thus, in the framework of the Swiss Heroin Prescription Programs (Ribeaud et al. 2004), a comparison of self-reported delinquency surveys, victimization surveys, police files and court files for a sample of drug-addicts, showed that conviction data can be problematic when trying to establish the frequency of continuous offences –such as drug consumption and drug dealing–, because the whole series of acts is included under only one conviction (Aebi 2006: 260). They are also problematic when trying to establish the criminal career of an offender because a criminal conviction is the last resource for a juvenile court and also because only the most serious offences lead to a criminal conviction. As a consequence, the first conviction of an offender will not necessarily reflect his or her first offence. In the same perspective, when several offences are included in the same sentence, it is almost impossible –without consulting the original files– to establish their temporary order. Moreover, in countries with a civil law legal system, conviction data are based on the articles included in the Criminal Code, which sometimes do not allow a detailed criminological classification of the acts committed. For example, theft can include pick-pocketing, shoplifting and other forms of theft that are committed with completely different modus operandi. (Aebi 2006: 260). These problems exist when the counting unit of conviction statistics is the conviction itself and also when the counting unit is the person convicted, but they are more pronounced in the second case. Indeed, conviction statistics based on the number of persons convicted represent a measure of the prevalence of delinquency–the number of persons convicted could also be expressed as the percentage of the population that has been convicted– that does not seem appropriate to measure the frequency or incidence of delinquency–i.e. the number of offences that led to a conviction. For example, an increase in the number of persons convicted may be the consequence of an increase in the number of offences committed in group, even if the total number of offences remains stable.7
In sum, if the validity of a crime measure is defined as its capacity to measure efficiently the phenomenon under study –i.e. criminality–, one can say that conviction statistics are less valid than police statistics. As we have seen, this was the main message of Sellin (1931), although the language of research has evolved and the concept of value, used by him, has been replaced by the concept of validity, and it has been complemented with the concept of reliability. Police statistics are more valid than conviction statistics because they are closer to the offence itself. They are influenced mainly by the propensity of the population to report offences, the way in which those offences are recorded, and the criminal policy priorities as well as the efficiency of police forces. Conviction statistics
7The problems related to the counting unit used in criminal statistics were already discussed in the nineteenth century by Georg von Mayr (Robinson1910). Robinson (1910) also provided a discussion on the advantages and disadvantages of the three main units used in criminal statistics (the affair or case, the infraction of the law, and the delinquent).
intervene at a later stage of the procedure and therefore are influenced not only by all those factors but also by the intervention of the Public Prosecution Services, which filters the suspects that arrive at the trial stage. Thus, they include fewer offences than police statistics, and many of these offences have disappeared because of lack of evidence. For example, analysing rape offences in Sweden, von Hofer (2000a) has shown that, in 1997, the police had recorded 1,708 offences but had completed the investigation of only 1,434. Thus, there was a drop of 16% between the offences known to the police (input) and the offences forwarded to the prosecution authorities (output). Among the 274 cases that disappeared during the police investigation, there were 42 in which the reported offence did not constitute a rape and 179 cases in which it was not possible to establish the presence of a criminal conduct (von Hofer 2000a).8 The subsequent intervention of the prosecution services reduces even more the number of cases brought before a court because of lack of evidence or lack of public interest in prosecution. Thus, a comparative study of the role of the Public Prosecution Services in Europe has shown that, roughly, between 40% and 50% of the cases treated by five of those Services–France, Germany, Netherlands, Poland and Sweden– in 2004 ended in a simple drop or in a drop based on the grounds that there was no public interest in prosecution (Jehle et al.2008).
In contrast, if the reliability of a crime measure is defined as its capacity to provide measures that are inter-subjective and reproducible –i.e. to provide the same measure independently of the person that manipulates the instrument–, one can say that conviction statistics are more reliable than police statistics. The reason is that conviction statistics are based on a decision taken by a judge that disposes of more detailed information than the police officers who registered the offence. For example, for the police officers that discover a person killed with a firearm, it is almost impossible to establish the intention of the author of the lethal shot (did he/she want to kill the person or to wound her? Was it an accident?).9On the contrary, the judge has collected all the relevant information and can pronounce an informed decision. At the same time, judges are obliged to take their decisions according to the Criminal Code (in countries with a civil law system) or according to previous jurisprudence (in countries with a common law system). Thus, disposing of the same information, different judges should arrive at the same decision. Moreover, if their decisions are dissimilar, a superior court will unify the jurisprudence (Killias et al.2012: 41-42).
As a consequence, we can conclude that conviction statistics are less valid but more reliable than police statistics as measures of crime. Conversely, as crime measures, police statistics are more valid but less reliable than conviction statistics.
Nevertheless, those considerations about reliability and validity concern mainly the use of conviction statistics as measures of the level of crime and the formal social control. In this article, on the contrary, conviction statistics will be used to measure crime trends. In that context, it can be accepted that official statistics offer a reasonably valid basis to study time series provided that the reporting and recording practices, as well as the legal definitions of offences, have not experienced substantial changes during the period 8
In the same perspective, a study of the role of police forces in the criminal justice proceedings has shown that, as far as minor offences are concerned, the police forces of several European countries can decide to drop cases because of insufficient evidence or because the offender is unknown (Elsner, Smit & Zila,2008). Such interventions by the police reduce the number of cases that are treated by the Public Prosecution Services and, later, by the courts.
9
See, for example, Ferracuti et al. (1962), who conducted an empirical study that highlighted many of the mistakes in the identification and classification of crimes by police officers.
considered, or whenever the influence of such changes can be measured by the researcher (CoE1999: 13; von Hofer2000a).
Summarizing the criminological controversies on the pertinence of conviction statistics as measures of crime, von Hofer (2000b,2003) concludes that there are two opposite views among researchers. The first one considers conviction statistics as an indicator of formal social control –reflecting the exercise of State control through criminal law–, which are useless as indicators of the true volume of offences and offenders. The second one considers that they can describe basic trends in offending even if the slopes of increases and decreases are not perfectly depicted.“This view of court statistics is primarily founded on the idea that, in a constitutional state, court sentences do in fact reflect the guilt of the accused. The State deploys a highly bureaucratic process to establish the guilt of the accused person, and the parties finally recorded in court statistics do not find their way there on an arbitrary basis. In most cases, there is a valid connection between the offence and the sentence. Thus, to some extent, court statistics do mirror offending behaviour, even if its true volume generally is greatly under-estimated” (von Hofer2003: 163). The same author concludes that this is an empirical problem which cannot be solved through theoretical analysis and statements. As a consequence, he combines both approaches while using conviction statistics to study crime trends in Sweden (von Hofer2000b,2003). The same logic is applied in this article.
Data and Methods
The analyses included in this article are based on the data on conviction statistics included in the four editions of the European Sourcebook of Crime and Criminal Justice Statistics (hereafter European Sourcebook) that cover the years 1990 to 2007 (CoE1999; Killias et al.2003; Aebi et al.2006,2010).10However, almost half of the 26 countries studied in this article were unable to provide data on persons convicted for 2007. For that reason the series studied cover the period 1990 to 2006. Bearing in mind the problems mentioned in the previous section, a series of validity checks were performed on that data in order to control the influence of changes in legal definitions and data recording practices, as well as the consistency of the time series obtained. In the following chapters we will present such checks and describe the logic used to include or exclude offences and countries from our analyses, as well as the interpolation, extrapolation and weighting procedures applied to the data.
Offences Included
This article covers trends in persons convicted for six offences. We have excluded the offences that were not included in all the editions of the European Sourcebook (e.g. fraud, computer offences, money laundering) as well as those for which data were available for less than ten countries (theft of motor vehicle, burglary, domestic burglary, and drug trafficking). Thus, the offences included in our analyses are the following: intentional homicide –total and completed (i.e. including and excluding attempts)–, assault, rape, robbery, theft, and drug offences.
10
The raw data tables available on the European Sourcebook website (www.europeansourcebook.org) were also consulted.
Countries Included
Countries that did not participate–or that did not provide data on persons convicted– in the first or the fourth editions of the European Sourcebook were excluded from the analyses because it was impossible to establish trends for the beginning or the end of the time series studied. The countries in that situation are the following: Armenia, Georgia, Iceland, Ireland,11Slovakia, Spain, and Ukraine.
Countries that did not participate–or that did not provide data on persons convicted– in two or more consecutive editions of the European Sourcebook were excluded from the analyses because it was also impossible to establish reliable time series. The countries in that situation are the following: Lithuania, Luxembourg, Malta, The Former Yugoslav Republic of Macedonia, and Turkey.
Countries with a population of less than one million were excluded because they may experience substantial changes in crime rates from one year to another that are only due to the addition or the subtraction of a few persons convicted. As Iceland, Luxembourg and Malta had already been excluded for the reasons mentioned above, the only country in that situation is Cyprus.
Albania was excluded because its time series were heavily affected by the collapse of a pyramid lottery scheme in 1997 that led to a civil rebellion during which some 2,000 people were killed (Jarvis 2000). As a consequence, the Albanian figures for that period show sudden ups and downs that do not necessarily reflect the real number of offences committed. As an example, the rate of persons convicted for intentional homicide –including attempts– went from 1.9 per 100,000 population in 1995 to 8.8 in 1996, before going down to 3.7 in 1997 and raising again to 11.5 in 1998.
Denmark was excluded because the figures for persons convicted provided for the second edition included acquittals (Killias et al. 2003: 185) and therefore were not comparable to the ones provided in the previous and following editions of the European Sourcebook and to the ones provided by the rest of the countries, which include only persons convicted. The addition of convictions and acquittals corresponds to the input of cases received by the courts, which is also the output of the cases treated by the Public Prosecution Services that transmitted those cases to the courts. That measure could be useful for the study of the functioning of the criminal justice system–and, in particular, of its funnel structure–, but does not correspond to the type of measure used in this article to study crime trends (i.e. persons convicted by the courts).
As a consequence, the database used for our analyses includes information on 26 countries, of which 15 belong to Western Europe and 11 to Central and Eastern Europe. The Western European cluster includes the following countries: Austria, Belgium, England and Wales, Finland, France, Germany, Greece, Italy, Netherlands, Northern Ireland, Norway, Portugal, Scotland, Sweden, Switzerland. The Central and Eastern European cluster includes the following countries: Bulgaria, Croatia, Czech Republic, Estonia, Hungary, Latvia, Moldova, Poland, Romania, Russia, and Slovenia.
11Ireland presents also the particularity of showing zero persons convicted for intentional homicide in 1997 and, according to the second edition of the European Sourcebook, zero persons convicted for completed intentional homicide from 1995 to 1999 (although the first edition mentioned 0.3 and 0.1 persons convicted per 100,000 population in 1995 and 1996 respectively). The absence of convictions seems related to a particular way of recording the convictions pronounced because, during the 1990s, Ireland registered roughly 50 victims of homicide per year (Dooley2001).
Measuring the Influence of Changes in Data Recording Methods
Conviction statistics compiled in the European Sourcebook refer to the number of persons convicted and not to the number of sentences imposed. None of the countries included in our analyses reported a change in that counting unit during the period under study.
When counting convictions, most countries apply the principal offence rule, which means that, if a person is convicted for several offences, only the most serious one is counted. The exceptions are Belgium, Hungary, and Switzerland, which count each offence.12At the same time, eight countries13 record court decisions before any appeal, 1514 record them after appeals have been exhausted, and three15 did not provide information on that issue. The principal offence rule and the moment in which data are collected for the statistics would have a major influence if we were comparing crime rates across countries, but, as we are interested in crime trends, we only need to control whether those rules suffered any changes–that could provoke spurious modifications of the trends– during the period under study. In practice, none of the countries included in our analyses reported such changes.
Finally, Wittebrood and Junger (2002) have suggested that increases in police recorded violent offences may be partially due to increased computerization, which facilitates registration.16This hypothesis could be extrapolated to conviction statistics as most countries have changed from paper statistics to computer statistics since the end of the 1980s. In that context, the influence of computerization should be homogeneous across offences, in the sense that the number of persons convicted for each type of offence should increase. However, that hypothesis cannot be fully tested with the data available for this research, which do not include details on the moment in which the different national statistical systems were computerized. Measuring the Influence of Changes in Legal Definitions
It has been mentioned before that changes in legal definitions can affect the trends shown by conviction statistics. As each edition of the European Sourcebook includes a question about the eventual changes in the legal definitions of offences introduced in each country, it was possible to check whether, between 1990 and 2006, such changes took place in the countries and offences studied here and whether they had an influence on the number of persons convicted. Those changes are presented in the two following chapters. Nevertheless, we must warn the reader that these lists of changes may not be exhaustive, as some changes may have not been reported by the national correspondents in charge of answering the European Sourcebook questionnaire.
Changes in Legal Definitions in Western Europe
The concept of rape was enlarged in Switzerland in 1992, in France in 1994, in Germany in 1997 and in Greece in 2006. One of the main modifications introduced in Switzerland, 12The following five countries did not provide information regarding whether they apply or not the principal offence rule: Croatia, Estonia, Latvia, Moldova and Norway.
13
England and Wales, Finland, the Netherlands, Northern Ireland, Portugal, Russia, Scotland and Sweden. 14
Austria, Belgium, Bulgaria, Croatia, Czech Republic, Estonia, France, Germany, Greece, Hungary, Italy, Poland, Romania, Slovenia and Switzerland.
15Latvia, Moldova and Norway.
16A similar, but broader, hypothesis has been suggested by van Dijk (2008), who considers that“The number of crimes officially recorded by the police goes up with modernization because of the strengthening of the official systems of social control, including their capacity to record crime and invite victim reporting. Countries record more crimes to the extent that they are‘modern’” (van Dijk2008: 33).
Germany and Greece was the inclusion of violent intra-marital sexual intercourse in that concept. Such changes did not have major effects on the number of persons convicted for rape. In Germany, their number remained stable between 1997 and 1999, and the same is true for France between 1993 and 1995. In Greece, the modification intervened during the last year of the series studied here, for which no figures were provided. Finally, in Switzerland, contrary to what was expected, the number of persons convicted for rape decreased by 16% between 1992 and 1994.
As far as assault is concerned, France introduced a new Criminal Code in 1994, which changed the sanctions according to the physical injuries produced and, in 2003, the French definition of assault was enlarged in order to include new aggravating circumstances. Comparing 1995 to 1993, the number of persons convicted for assault in France decreased by 50%, but two years later, in 1997, their number had increased again and was already higher than in 1993. The modifications introduced in 2003 were followed by an increase of 26% of the persons convicted in 2004, and their number continued to increase after that.
Regarding property offences, in Switzerland, since the beginning of 1995, theft of small value is considered a misdemeanour pursued only if the victim press charges. In that perspective, comparing 1994 to 1995, the number of persons convicted for theft in Switzerland decreased by 21%, but their number increased again from 1996 until 1999.
Finally, as far as drug offences are concerned, in Italy, a law of 1990 introduced the criminalization of personal consumption, but that law was abolished in 1994, following a referendum. In that context, between 1990 and 1991, there was an increase of 84% of the number of persons convicted for drug offences. Then, in 1994 and 1995 there was a decrease of roughly 10% –compared to 1993– but, in 1996, the number of persons convicted for drug offences in Italy was already higher than in 1993. In France, the Criminal Code of 1994 introduced a specific offence of organized traffic. A comparison of 1993 and 1995 shows that the new Criminal Code was followed by a decrease of 15% in the number of persons convicted for drug offences, but in 1996 their number increased again and was already higher than in 1993. In Austria, in 1998, the definition of drug offences was enlarged in order to criminalize possession and handling of psychotropic substances and raw material. However, the number of persons convicted for drug offences in Austria decreased by 13% between 1997 and 1998, and it remained at that level until 2001, when it went up again to rejoin the level of 1997 and, after that, it continued to increase until the end of the series.
In sum, in Western Europe, changes in legal definitions had only punctual effects that, in general, did not alter the overall trend observed on convictions for each type of offence.
Changes in Legal Definitions in Central and Eastern Europe
Most Central and Eastern European countries introduced major modifications in their criminal law, or brand new Criminal Codes, after the breakup of the Soviet Union. For example Croatia introduced a new Criminal Code in 1998, Estonia in 2002, Latvia in 1999, Moldova in 2003, Poland in 1998, and Romania in 2005. Although such changes should have a minor impact in very serious offences such as homicide, they surely had some effect on the trends in convictions for other offences. Leaving aside the abolition of the death penalty or the introduction of a moratorium on executions, as well as crimes not covered by this article–such as computer related crimes and corruption–, changes in the criminal law in Central and Eastern European countries affected mainly drug offences, sexual offences, and property offences.
In particular, the definition of sexual offences was enlarged in Croatia in 1998, in the Czech Republic in 2000, and in Romania in 2000. The modifications regarded the inclusion of sexual marital intercourse (for example, in Croatia) and the inclusion of men as possible victims of crime (for example, in Romania and the Czech Republic). The enlargement of the definition of rape did not lead to increases in convictions for rape.
Special laws or sections of the Criminal Code on drug offences were introduced in most Central and Eastern European countries since the beginning of the 1990s, and the definition of drug trafficking was enlarged in 1998 in Croatia, in 2000 in the Czech Republic, in 2003 in Moldova, in 1997 and in 2000 in Poland, in 1996 and in 2000 in Romania, and between 1996 and 2000 in Russia. Possession of drugs for personal use was decriminalized in Estonia in 2002, in Moldova in 2003, in Hungary in 1996, in Poland in 1997 and in Russia by the end of the 1990s. However, both Hungary and Poland criminalized it again in 1996 and 2000 respectively. Croatia criminalized possession of drugs for personal use in 2001. All these modifications did not alter the general upwards trend observed in all countries in drug offences.
Theft of small value is considered in some countries as a misdemeanour and not as a criminal offence. As a consequence, it is not included in criminal statistics. In that context, the threshold to qualify theft as a criminal offence was raised in 1995 in Poland (where it was multiplied by ten), in 2000 in the Czech Republic in 2002 (where it was fixed at 5000 CZK or approximately 170 Euro), and in Russia in 2002 (where it was fixed at 60 Euro, which represented five times the minimum wage at that period). These modifications may have played a role in the decrease in theft observed in Central and Eastern European countries since 2000 (see Fig.7).
For some countries and some offences, the changes in legal definitions introduced major modifications in the trends shown by conviction statistics. In such cases, the country was excluded from the analysis of the offences affected by such changes. Thus, in Estonia, the introduction of the new Criminal Code in 2002 made it impossible to compare most of the offences registered since 2003 with the ones registered in previous years. For that reason, Estonia has only been included in the analysis of trends on intentional homicide. The same is true for Moldova –which presented also a lot of gaps in its time series for some offences–, where the changes introduced by the 2003 Criminal Code had also a major impact on the country’s crime rates. Latvia was in a similar situation due to the substantial changes introduced since the early 1990s and, as a consequence, was excluded from the analyses of assault, robbery and theft.
Measuring the Role of the Public Prosecution Services
We have seen that de Candolle (1832/1987b) had already identified differences in criminal proceedings as one of the sources of distortion of international comparisons of conviction statistics. Nowadays, the Public Prosecution Services are considered a key player in such proceedings (Jehle et al.2008), especially because some cases may not be transferred to a court if they are solved through a sanction imposed by those services. The same is true–as it was suggested by an anonymous reviewer of this paper– for informal measures or sanctions imposed by the police.
According to the metadata included in the European Sourcebook, all countries included in this analysis do not count sanctions and measures imposed by the police nor do they count sanctions imposed by the prosecutors that do not lead to a formal verdict. On the contrary, most countries count sanctions imposed by the prosecutor, or by the court but on demand of the prosecutor–a procedure known sometimes as penal order and that implies a
simplified procedure, similar to a plea bargain, in which the offender accepts the sanction proposed by the prosecutor– that lead to a formal verdict which will be counted as a conviction. The exceptions are Greece, Italy and England and Wales, which did not include them, and the Netherlands, where this type of sanctions does not exist.
Interpolation and Extrapolation
Among the countries included in our analyses, some were unable to provide data for each and every year of the time series. In that context, for those countries that had up to three contiguous missing years, we used linear interpolation to calculate the missing values between years.17When the last year of the series was not available, we extrapolated it by repeating the previous available year.18 Linear interpolation and extrapolation are the standard procedures for the replacement of missing data. They are used, for example, by the World Health Organization for the calculation of regional averages of homicides according to health statistics (WHO2010).
When there were only minor differences between the figures provided in two consecutive editions of the European Sourcebook, we used the figures of the latest edition, which is always considered as an update of the previous one (see, for example, Killias et al.2003: 5).
Weighting Procedure
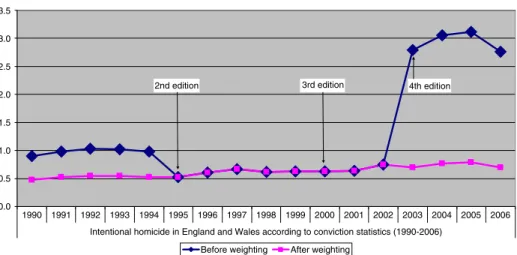
Data have been counterchecked in order to identify sudden variations from one year to another and, especially, from one edition of the European Sourcebook to another. Such variations could be due to changes in legal definitions or statistical counting rules that were not reported by the national correspondents that filled in the European Sourcebook questionnaire, or to the fact that the country included (or excluded) in one edition of the European Sourcebook some sub-categories of an offence that were excluded (or included) in the previous one. Three countries (England and Wales, Moldova, and Romania) presented time series with major variations in the rate of persons convicted for intentional homicide (including attempts) in different editions of the European Sourcebook.
However, as each edition of the European Sourcebook includes also data for the last year included in the previous edition (for example, 2003 is included in the 3rd and the 4th edition), it is possible to correct some of these sudden variations by weighting the data accordingly. The case of England and Wales is presented as an example in Fig.1. In the first edition of the European Sourcebook (CoE 1999: 116), covering the years 1990 to 1996, its rate for total intentional homicide varied from 0.9 in 1990 to 1.1 in 1996 (the annual rates, including a second decimal not shown in the printed edition of the European Sourcebook, were the following: 0.90, 0.99, 1.03, 1.03, 0.98, 0.99, and 1.10). In the second edition (Killias et al. 2003: 102), covering the years 1995 to 2000, the rate oscillated between 0.5 in 1995 to 0.6 in 2000 (the annual rates were: 0.53, 0.61, 0.67, 0.61, and 0.63). As it can be seen, there was a huge difference between the figure for 1995 in the first edition (0.99) and the one included in the second edition for the same year (0.53). The same
17Taking as an example the case of total intentional homicide, we interpolated the figures for France in 1994, Estonia in 2005 and 2006, Greece in 1998, 1999, 2003 and 2004, Latvia from 2000 to 2002, Norway in 1995, 1996, and from 2000 to 2002, and Russia in 1995, 2001 and 2002.
18
Taking once more the case of total intentional homicide as an example, we extrapolated the figures for Belgium in 2005 and 2006, and Greece, Italy and Scotland in 2006.
is true for 1996, which presented a rate of 1.10 in the first edition and a rate of 0.61 in the second one. This problem did not arise between the second and the third edition of the European Sourcebook as the figure provided for 2000 (0.61) is the same in both editions. However, between the third and the fourth edition, there is again a huge difference as the figure for 2003 was 0.70 in the third edition but 2.79 in the fourth one. How can these big differences be explained?
According to the authors of the European Sourcebook, the second edition is an updated version of the first one (Killias et al.2003: 5), the third one a partial update of the second one (Aebi et al.2006: 5), and the fourth one an extended update of the third one (Aebi et al. 2010: 5). This implies that, when different figures were provided for the same year in different editions of the Sourcebook, the figures included in the latest edition are supposed to be more reliable than the ones included in the previous one. Nevertheless, when there are big changes in the figures provided for the same year in different editions, the countries usually provide an explanation. That was not the case of England and Wales, which did not explain the sudden changes in the level of its rates. Studying the time series, and taking into account that such changes could be due to the inclusion or the exclusion of a sub-category of an offence in the different editions of the European Sourcebook, we came to the conclusion that the most plausible explanation is that the category of assault leading to death was included in the first and the fourth editions, but excluded in the second and the third ones. That explanation is corroborated by the fact that the time series for assault in England and Wales present similar variations, but in the opposite way.
If the figures were kept as published in the European Sourcebook, it would be impossible to use them for a comparison of crime trends. As can be seen in Fig.1(series before weighting), they would show a decrease of 47% between 1994 and 1995 and an increase of almost 400% between 2002 and 2003. As a consequence, the country should be excluded from the analysis. Nevertheless, it is clear that the figures for the first and the fourth edition are higher because the definition applied is larger than the one used for the second and the third edition. Moreover, as we are interested in crime trends and not in crime levels, there is no reason for rejecting the application of a weighting procedure that eliminates the distortions introduced by the inclusion or the exclusion of a subcategory. Such procedure would allow us to produce a comparable trend for the whole period. In that
0.0 0.5 1.0 1.5 2.0 2.5 3.0 3.5 1990 1991 1992 1993 1994 1995 1996 1997 1998 1999 2000 2001 2002 2003 2004 2005 2006 Intentional homicide in England and Wales according to conviction statistics (1990-2006)
Before weighting After weighting
2nd edition 3rd edition 4th edition
Fig. 1 Persons convicted for intentional homicide (including attempts) in England and Wales according to conviction statistics (1990-2006), before and after weighting
perspective, the assumption that we would be making while weighting the data is that the general category of the offence did not change in a different way than its subcategory.
For these reasons, we decided to weight the data for the first and the four editions according to the figures for the second and the third edition. Thus, in our time series, the figure used for 1995 is the one provided by the second edition (0.53), which represented 53.19% of the figure provided by the first edition (0.99). Accordingly, the rest of the figures provided by the first edition were reduced in the same proportion. This produced a new series (0.48, 0.52, 0.55, 0.55, 0.52 and 0.53) which shows the same trend as the one provided by the original figures but a similar level to the one showed in the second one (see Fig.1, series after weighting). The same procedure was applied to weight the data for the fourth edition according to the level of the third one. In that case, a coefficient of 0.25 was applied (the figure for 2003 was 0.70 according to the third edition and 2.79 according to the fourth edition). Once more, after the weighting procedure, the levels are homogeneous between the two editions of the Sourcebook and the trend remains the same as before the weighting. According to the fourth edition, between 2003 and 2007, the rates were 2.79, 3.06, 3.12, 2.76 and 2.74, while, according to the weighted figures, they are 0.70, 0.77, 0.78, 0.695 and 0.689.
The same weighting procedure–but in the opposite way, because it was necessary to give more weight to the figures from the first and the fourth edition– was applied to the rate of persons convicted for assault in England and Wales. As it has been said, this inconsistency in the trends corroborates the hypothesis that the category of assault leading to death was twice included in the total figure for intentional homicide and twice included in the total figure for assault. In addition, this weighting procedure was applied to persons convicted for intentional homicide (including attempts) in Moldova from 1996 to 1999 and in Romania from 1997 to 1999.
Apart from that, the time series for persons convicted for assault in Croatia and Romania were discarded because they were inconsistent and could not be weighted. The same is true for persons convicted for drug offences in Switzerland.
Statistical Measures
Finally, in order to reduce even more the negative impact–in terms of the reliability of the time series– of changes in data recording methods or legal definitions in a particular country, our analyses are based on trends in groups of countries. Thus, we consider (a) Europe as a single cluster, which is then divided in a (b) Western European cluster and a (c) Central and Eastern European cluster.
In that context, we use the rates of persons convicted per 100,000 population in each country to compute geometric means for each cluster of countries, each offence, and each year. The geometric mean represents the average of the nthroot of n non-negative numbers (Dodge 1993: 248-9). According to Dodge (1993: 248-9), the geometric mean is used in particular to calculate the average of ratios and reduces the influence of extreme values (outliers). As our data includes some outliers, the geometric mean was preferred to the arithmetic mean, which is extremely sensitive to the presence of such outliers. Moreover, as the analyses are based on rates per 100,000 population, the geometric mean was also preferred to the median.
Apart from that, we include two measures of the evolution of the rates of persons convicted during the time frame of our analyses. The first one is the percentage change between 1990 and 2006, which is based on a direct comparison of the rates for both years. The second one is the average annual percent change (AAPC), also known as average
annual variation and annual growth rate. This measure is appropriated for time series data that do not show a linear trend; it estimates the logarithmic growth of the model (Sarma 2001: 221). By taking into account the rates of each of the years included in the series, the AAPC provides an estimation of the overall trend during the period under study in terms of the constant percentage of increase –or decrease– experienced during each year of the series.
All our calculations are based upon unrounded numbers. This means that they include all the decimals that could not be shown in the printed versions of the European Sourcebook and in Figs.2,3,4,5,6,7and8.
Available Data
Table1presents the time series available for each country and each offence. Unavailable data have been indicated as such (N.A.) in the table. When data were available, the table indicates the percentage change and the average annual percent change between 1990 and 2006 for each offence and each country. For example, Belgium provided completed series for total intentional homicide, assault, rape, and theft. In the case of total intentional homicide, the rate of persons convicted in Belgium in 2006 was 128% higher than in 1990, and the average annual increase between 1990 and 2006 was 6.4%. In the case of assault, the 2006 rate was 52% higher than the rate of 1990, and the average annual increase during that period was 1.4%. Table 1 also indicates the number of countries included in each analysis and, for each cluster of countries studied, the geometric mean of their percentage change and average annual percent change. For example, in the case of total intentional homicide, 26 countries provided data and the rate of persons convicted for that offence in Europe in 2006 was 23% higher than in 1990, while the average annual increase between 1990 and 2006 was 0.6%. At the same time, in Western Europe, the 2006 rate was 14% higher than the rate of 1990, and the average annual increase was 0.2%; while in Central and Eastern Europe the 2006 rate was 36% higher than the rate of 1990, and the average annual increase was 1.2%.
1990 1991 1992 1993 1994 1995 1996 1997 1998 1999 2000 2001 2002 2003 2004 2005 2006 1.7 1.9 2.1 2.3 2.2 2.4 2.2 2.1 2.1 2.1 2.1 2.1 2.2 2.3 2.3 2.2 2.1 1.3 1.3 1.5 1.6 1.5 1.6 1.4 1.3 1.4 1.3 1.4 1.3 1.4 1.5 1.5 1.5 1.4 2.7 3.2 3.2 3.6 3.8 4.1 4.1 4.0 3.8 3.9 3.9 3.9 4.0 4.0 4.0 3.6 3.6 0.5 1.0 1.5 2.0 2.5 3.0 3.5 4.0 4.5
Intentional Homicide - Total - 1990-2006
Europe Western Europe Central and Eastern Europe
Fig. 2 Persons convicted for intentional homicide (including attempts) per 100,000 population between 1990 and 2006 in 26 European countries (Geometric means)
Findings
Intentional Homicide (Including Attempts)
The European Sourcebook is based on a questionnaire sent to national correspondents in each country. The questionnaire includes a standard definition of each offence and a series of sub-categories of that offence that should be included or excluded by the correspondents when providing the figures for the publication. According to the standard definition, intentional homicide means “intentional killing of a person” (Aebi et al. 2010: 349). In principle, figures include assault leading to death, euthanasia, infanticide, and attempts; but
1990 1991 1992 1993 1994 1995 1996 1997 1998 1999 2000 2001 2002 2003 2004 2005 2006 34.3 36.0 35.7 36.9 37.4 36.0 39.0 41.4 41.9 42.7 43.3 44.4 45.2 50.0 53.7 52.9 53.4 48.9 48.7 48.5 52.6 49.6 48.4 51.8 53.1 54.8 55.2 54.8 56.8 57.1 64.8 67.8 66.5 68.3 12.8 15.4 15.1 13.7 16.9 15.7 17.7 20.6 19.8 20.9 22.4 22.4 23.4 24.2 28.0 27.9 26.7 0.0 10.0 20.0 30.0 40.0 50.0 60.0 70.0 80.0 Assault 1990-2006
Europe Western Europe Central and Eastern Europe
Fig. 4 Persons convicted for assault per 100,000 population between 1990 and 2006 in 19 European countries (Geometric means)
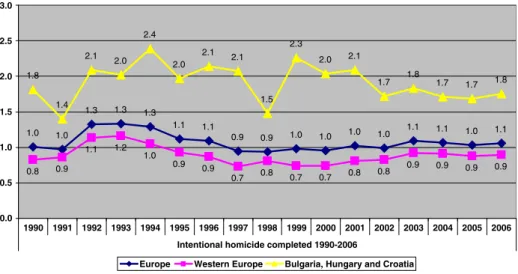
1990 1991 1992 1993 1994 1995 1996 1997 1998 1999 2000 2001 2002 2003 2004 2005 2006 0.5 1.0 1.5 2.0 2.5 3.0 1.0 1.0 1.3 1.3 1.3 1.1 1.1 0.9 0.9 1.0 1.0 1.0 1.0 1.1 1.1 1.0 1.1 0.8 0.9 1.1 1.2 1.0 0.9 0.9 0.7 0.8 0.7 0.7 0.8 0.8 0.9 0.9 0.9 0.9 1.8 1.4 2.1 2.0 2.4 2.0 2.1 2.1 1.5 2.3 2.0 2.1 1.7 1.8 1.7 1.7 1.8 0.0
Intentional homicide completed 1990-2006
Europe Western Europe Bulgaria, Hungary and Croatia
Fig. 3 Persons convicted for completed intentional homicide per 100,000 population between 1990 and 2006 in 12 European countries (Geometric means)
they exclude assistance with suicide. The total rate of intentional homicides is completely inappropriate for cross-national comparisons of crime because the percentage of attempts varies widely from one country to another (Aebi2010); however, it can be used for the comparisons of trends. Figure 2 shows trends in persons convicted for intentional homicide (including attempts), for which data are available for the 26 countries included in our analyses.
In Western European countries, the rate of persons convicted per 100,000 population for intentional homicide registered an increase of 29% from 1990 to 1993, remained relatively stable at the 1993 level until 1995, and decrease by 12% in 1996. Since then, the rate has been relatively stable, oscillating between 1.3 and 1.5 convicted persons per 100,000 population. By 2006, the rate of persons convicted for intentional homicide was 14% higher
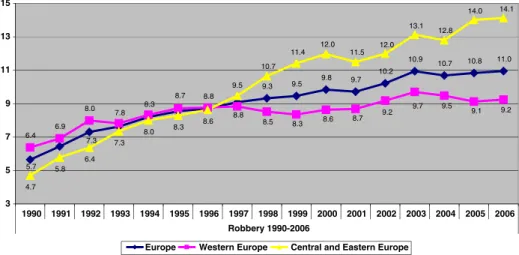
9.3 9.5 9.8 9.7 10.2 10.9 10.7 10.8 11.0 6.4 6.9 8.0 4.7 5.8 6.4 7.3 8.0 8.3 8.6 5.7 7.3 7.8 8.3 8.7 8.8 8.8 8.5 8.3 8.6 8.7 9.2 9.7 9.5 9.1 9.2 9.5 10.7 11.4 12.0 11.5 12.0 13.1 12.8 14.0 14.1 3 5 7 9 11 13 15 1990 1991 1992 1993 1994 1995 1996 1997 1998 1999 2000 2001 2002 2003 2004 2005 2006 Robbery 1990-2006
Europe Western Europe Central and Eastern Europe
Fig. 6 Persons convicted for robbery per 100,000 population between 1990 and 2006 in 20 European countries (Geometric means)
1990 1991 1992 1993 1994 1995 1996 1997 1998 1999 2000 2001 2002 2003 2004 2005 2006 0.5 1.0 1.5 2.0 2.5 3.0 3.5 1.8 1.7 1.7 1.6 1.7 1.7 1.6 1.7 1.8 1.6 1.6 1.7 1.6 1.7 1.8 1.8 1.8 1.3 1.2 1.1 1.3 1.3 1.4 1.3 1.3 1.4 1.3 1.3 1.3 1.2 1.3 1.4 1.5 1.5 3.1 3.0 3.0 2.3 2.5 2.4 2.2 2.6 2.5 2.5 2.4 2.4 2.4 2.6 2.6 2.3 2.4 Rape 1990-2006
Europe Western Europe Central and Eastern Europe
Fig. 5 Persons convicted for rape per 100,000 population between 1990 and 2006 in 23 European countries (Geometric means)
than in 1990, and the average annual increase between 1990 and 2006 was 0.2%. An individual analysis shows that eight countries experienced higher rates in 2006 than in 1990, with increases ranging from 21% to 165% (Austria, Belgium, Italy, Netherlands, Sweden, Switzerland, England and Wales, and Scotland), two remained stable (Finland and Germany), and five experienced decreases ranging from -22% to -48% (France, Greece, Norway, Portugal, and Northern Ireland).
In Central and Eastern Europe, the rate of persons convicted per 100,000 population for intentional homicide increased by 56% (from 2.7 to 4.1) between 1990 and 1996 and, despite a punctual decrease in 1998 (3.8 persons convicted per 100,000 population), remained relatively stable between 1997 and 2004, oscillating between 3.9 and 4.0, before
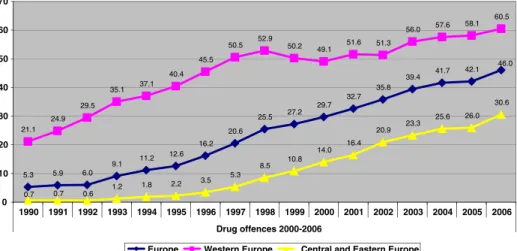
5.3 5.9 6.0 9.1 11.2 12.6 16.2 20.6 25.5 27.2 29.7 32.7 35.8 39.4 41.7 42.1 21.1 24.9 29.5 35.1 37.1 40.4 45.5 50.5 52.9 50.2 49.1 51.6 51.3 56.0 57.6 58.1 60.5 1.2 1.8 2.2 3.5 5.3 8.5 10.8 14.0 16.4 20.9 23.3 25.6 26.0 30.6 46.0 0.7 0.7 0.6 0 10 20 30 40 50 60 70 1990 1991 1992 1993 1994 1995 1996 1997 1998 1999 2000 2001 2002 2003 2004 2005 2006 Drug offences 2000-2006
Europe Western Europe Central and Eastern Europe
Fig. 8 Persons convicted for drug offences per 100,000 population between 1990 and 2006 in 20 European countries (Geometric means)
90.0 126.3 150.5 152.6 155.2 154.4 152.3 156.2 157.3 160.8 156.0 148.1 145.6 138.8 137.1 135.3 133.7 129.5 153.4 172.3 170.2 171.6 163.8 158.1 160.1 158.4 157.6 148.9 139.0 135.8 127.8 129.3 123.3123.4 120.7 118.7 126.2 130.3 139.2 142.6 149.6 155.3 166.8 169.3 165.6 164.7 160.3 151.9 159.2 153.7 146.4 80 100 120 140 160 180 200 1990 1991 1992 1993 1994 1995 1996 1997 1998 1999 2000 2001 2002 2003 2004 2005 2006 Theft 1990-2006
Europe Western Europe Central and Eastern Europe
Fig. 7 Persons convicted for theft per 100,000 population between 1990 and 2006 in 22 European countries (Geometric means)
Table 1 Percentage change (1990-2006) and average annual percent change between 1990 and 2006 in the rates of persons convicted per 100,000 population, by offence and by country
Intentional homicide Assault Rape Robbery Theft Drug offences
Total Completed
PC AAPC PC AAPC PC AAPC PC AAPC PC AAPC PC AAPC PC AAPC
Western Europe
Austria 21 −1.0 9 −2.3 −45 −5.6 0 −1.1 44 1.3 −43 −4.0 377 8.4
Belgium 128 6.4 N.A. 52 1.4 59 2.7 N.A. 45 0.9 N.A.
Finland 0 0.0 −36 −1.8 14 1.7 87 2.7 0 −0.4 1 −0.3 867 14.3
France −28 −1.7 N.A. 48 2.9 123 4.8 N.A. −26 −2.1 76 2.6
Germany 0 −0.4 N.A. 114 5.1 4 0.2 62 2.2 −23 −2.2 92 3.9
Greece −31 −3.2 −44 −4.1 −78 −7.7 −12 −3.6 211 5.2 −27 −2.9 87 4.2
Italy 165 6.4 149 6.7 658 11.9 190 4.4 82 3.0 40 1.3 160 3.5
Netherlands 97 3.6 N.A. 138 7.0 26 5.3 44 2.7 1 −0.5 196 8.0
Norway −48 −3.1 N.A. N.A. N.A. N.A. N.A. N.A.
Portugal −22 −3.9 −21 −3.4 61 5.0 −77 −7.7 308 7.3 17 −3.3 101 2.7 Sweden 22 1.5 N.A. 18 0.0 131 2.5 50 2.6 −32 −3.2 181 6.6 Switzerland 70 1.9 79 0.2 253 8.7 50 3.6 10 −0.4 −34 −3.1 N.A. UK: England & Wales 45 2.8 −9 −1.7 −19 −0.4 51 2.8 60 3.1 −40 −2.1 53 4.5 UK: Northern Ireland −40 −7.8 29 −1.9 57 2.8 −72 −6.3 −39 −2.5 −58 −6.2 552 6.7 UK: Scotland 42 1.8 31 1.2 6 0.6 32 3.9 −32 −2.2 −46 −3.9 138 4.4
Central and Eastern Europe
Bulgaria 26 1.1 11 0.8 179 8.6 18 1.8 479 12.1 287 11.0 61505 69.3
Croatia −19 −3.1 −16 −1.6 N.A. −39 1.1 291 8.7 10 2.3 4655 35.8
Czech Republic 66 4.6 N.A. 91 4.3 −26 −0.3 199 5.8 305 3.9 5072 31.3
Estonia 50 1.9 N.A. N.A. N.A. N.A. N.A. N.A.
Hungary 9 0.1 −2 −0.5 89 2.9 −57 −4.4 52 1.9 30 0.2 7509 35.0
Latvia 3 0.8 N.A. N.A. −40 −2.9 N.A. N.A. 1478 25.6
Moldova 120 4.0 N.A. N.A. N.A. N.A. N.A. N.A.
Poland 147 4.4 N.A. 251 5.8 49 1.9 246 9.1 98 4.1 8718 26.6
Romania −21 −1.9 N.A. N.A. −38 −4.5 195 3.2 10 −1.8 N.A.
Russia 83 3.5 N.A. N.A. −49 −4.9 156 4.8 96 2.4 1071 16.2
Slovenia 35 −1.8 N.A. 14 2.9 88 4.4 143 6.4 −48 −3.3 955 21.8 Geometric mean Europe 23 0.6 6 −0.7 56 2.9 1 0.2 94 3.6 2 −0.6 769 15.5 Geometric mean West 14 0.2 9 −0.8 40 2.3 18 0.9 45 1.8 −21 −2.3 186 5.8 Geometric mean East/Cent. 36 1.2 −3 −0.4 110 4.9 −21 −0.9 200 6.4 63 2.3 4493 31.9 Number of countries included 26 12 19 23 20 22 20
Note: Calculations are based upon unrounded numbers (i.e. including the decimals not shown in Figs.2,3,4,
5,6,7and8)
Abbreviations: PC: Percent change 1990-2006; AAPC: Average annual percent change between 1990 and 2006; N.A.: Not Available