HEAD AND NECK
Combined PET/CT-perfusion in patients with head
and neck cancers
Patrick Veit-Haibach&Daniel Schmid&Klaus Strobel&
Jan D. Soyka&Niklaus G. Schaefer&Stephan K. Haerle&
Gerhard Huber&Gabriele Studer&Burkhardt Seifert&
Thomas F. Hany
Received: 14 December 2011 / Revised: 18 May 2012 / Accepted: 24 May 2012 / Published online: 8 July 2012 # European Society of Radiology 2012
Abstract
Objectives Computed tomography perfusion (CTP) can pro-vide information about angiogenesis and blood-flow char-acteristics in tumours. [18F]Fluoro-2-deoxy-D-glucose–
positron emission tomography/computed tomography (FDG-PET/CT) is one of the major oncological imaging techniques which provides information about viability of the tumour cell and partly also about its aggressiveness. The aim of the study was to investigate the relationship between FDG and CTP data in patients with head and neck cancers.
Materials and methods Forty-one patients with a clinically suspected head and neck cancer were prospectively includ-ed. All patients underwent a combined PET/CT with an integrated CTP examination in the area of the head and neck tumour. CTP data (BF, BV and MTT) and PET data (SUVmax, SUVmean, TLG, PETvol) were compared between tumours and (1) healthy contralateral tissue, (2) inflammatory lesions, (3) metastatic lymph nodes, and CTP data and PET data were correlated in tumours.
Results Thirty-five patients had a head and neck cancer. All CTP data were statistically different between tumours, in-flammatory lesions, healthy tissue and metastatic lymph nodes; PET/CT data were in part significantly different. CTP and PET parameters were not significantly correlated. Conclusion CTP and PET parameters were not significantly correlated; thus, the additional CTP values provide addition-al insights into tumour behaviour and their glycolytic status. Key Points
• Computed tomography perfusion (CTP) can be performed in combined positron emission tomography (PET)/CT. • CTP in addition to PET provides additional insights into
tumour behaviour.
• CTP can possibly differentiate between head and neck tumours and inflammatory lesions.
• PET/CT with integrated CTP is possible without additional contrast media.
Keywords CT-perfusion . PET/CT . PET/CTwith integrated CT-perfusion . Head and neck cancer . Correlation of PET/CT and CPT data
Introduction
Computed tomography perfusion (CTP) is now a robust, non-invasive imaging tool which provides “functional”
P. Veit-Haibach
:
D. Schmid:
K. Strobel:
J. D. Soyka:
N. G. Schaefer
:
T. F. HanyDepartment of Radiology, Division of Nuclear Medicine, University Hospital Zurich,
Zurich, Switzerland N. G. Schaefer
Department of Medical Oncology, University Hospital Zurich, Zurich, Switzerland
S. K. Haerle
:
G. HuberDepartment of Oto-Rhino-Laryngology-Head and Neck Surgery, University Hospital Zurich,
Zurich, Switzerland G. Studer
Department of Radiation Oncology, University Hospital Zurich, Zurich, Switzerland
B. Seifert
Division of Biostatistics, Institute for Social and Preventive Medicine, University Hospital Zurich,
Zurich, Switzerland
P. Veit-Haibach (*)
Department of Medical Imaging, University Hospital Zurich, Raemistrasse 100,
8091 Zurich, Switzerland
information within a primarily morphological imaging tech-nique [1–6]. CTP has been evaluated in several tumour entities and initial experiences are also available addressing head and neck cancers. CTP has a positive correlation with microvessel density and thus the blood flow in particular was described as a useful parameter to reflect neoangio-genesis in tumours [7].
Additionally, a possible prognostic impact was demonstrated because CTP may predict response after chemotherapy and progression-free survival after chemotherapy and may be able to determine which patients will successfully respond to chemotherapy [8–10].
[18F]Fluoro-2-deoxy-D-glucose–positron emission
to-mography/computed tomography imaging (FDG-PET/CT) is a morphological and metabolic imaging tool for oncological staging and therapy follow-up in a wide variety of cancers [11–13]. FDG-PET/CT provides information about the viability of the tumour, about the tumour aggressiveness and proliferation in head and neck cancers.
Currently there is only very limited information about the potential relation between FDG parameters (SUVmax and SUVmean) and CTP parameters in head and neck cancers [14, 15]. Additionally, there is no information about the potential correlation between CTP values and additional PET parameters (e.g. tumour lesion glycolysis (TLG) and PETvol (tumour volume measured with PET) [16–19]. Al-so, there is only very limited information about the relation-ship among CTP values in ENT tumours and metastatic lymph nodes, healthy contralateral tissue and no information in comparison to inflammatory lesions [20,21]. It is very clear in theory that CTP and PET are measuring different parts of tumour characteristics e.g. flow/perfusion and glucose consumption, which only partly depends on the corresponding flow. Thus, the aim of this study was (1) to compare and correlate CTP parameters (blood flow (BF), blood volume (BV) and mean transit time (MTT) and semi-quantitative PET parameters (SUVmax, SUVmean, TLG and PET-based lesion volume (PETvol)) in patients with head and neck cancer and (2) to compare PET parameters and CTP parame-ters between tumours, contralateral healthy tissue, metastatic lymph nodes and inflammatory lesions.
Materials and methods Patients
Forty-one patients were prospectively included between 09/ 2008 and 01/2010 (mean age 61 years; range 43–78 years; 6 female, 35 male). All patients had a clinically suspected head and neck cancer and all were referred for routine primary staging by FDG-PET/CT to exclude distant metas-tases in advanced disease. The CTP examination was fully
integrated into the standard contrast-enhanced PET/CT procedure. No further selection was applied to the pa-tient population.
All patients underwent endoscopic biopsy of the suspi-cious head and neck lesions. Overall, 16 patients had a carcinoma of the oropharynx (including cancer of the tonsils and cancers of the base of the tongue), eight had a carcinoma of the hypopharynx, four had a carcinoma of the larynx, five had a carcinoma of the oral cavity (floor of the mouth and tongue), one patient had a sinonasal cancer and one patient had a squamous cell cancer of the mandible. All cancers were head and neck squamous cell cancers (HNSCC). The other six patients had inflammatory head and neck lesions. Twenty-four patients had suspected lymph node metastases at the time of study enrolment. Fifteen patients underwent additional neck dissection during the clinical follow-up. Mean follow-up was 12 months (range 4–20 months). Two patients died during the follow-up period. The study was performed in accordance with the regulations of the local institutional review board and ethics committee. Written, informed consent was obtained from all patients before the examination and enrolment into the study.
Integrated FDG-PET/CT imaging
All data were acquired on a combined PET/CT in-line system (Discovery VCT, GE Healthcare, Milwaukee, WI, USA). These dedicated systems integrate a last-generation, full-ring PET with a multislice helical 64-slice CT and permits the acquisition of co-registered CT and PET images in one imaging procedure. The patients were instructed to fast for 4 h prior to the examination. PET/CT imaging with integrated CTP was started 60 min after the injection of a standard dose of 300–340 MBq FDG. Blood sugar levels were checked prior to the injection of the FDG. In addition, an oral CT contrast agent (30 mL Gastrografin; Bayer Schering Pharma, Berlin, Germany diluted with 970 mL water) was administered during the uptake period. Patients were examined in supine position. All patients received a non-enhanced CT examination which was acquired with the following parameters: 80 mA, 140 kV, 0.5-s tube rotation, 4.25-mm section thickness. The CT examinations were ac-quired during shallow breathing in the head and neck area, the thorax and the lower abdomen and during non-forced expiration in the upper abdomen. The CT examinations included the area from the head to the upper thighs.
The PET emission examination was acquired with an acquisition time of 2 min per bed position after the low-dose CT examination. Images (15 cm axial field-of-view (FOV)/ bed position) were reconstructed by using a standard fully 3D iterative algorithm (ordered subset expectation maximisation, OSEM: subsets, 28; iterations, 2; recon matrix, 128×128; overlap, 9 slices).
The images were reviewed directly on the PET/CT console and the target lesions for the CTP examination (including lymph nodes) were defined on the basis of the focal glucose metabolism.
After target lesion definition, intravenous contrast injec-tion was started by injecting a total dose of 70 mL contrast media (Ultravist 370, Bayer Schering Pharma, Germany); the first part for the CTP, the second part for completion of routine contrast-enhanced CT (ceCT) of the neck and thorax for fusion with the PET data. Seventy mL of contrast media is the standard dose for imaging of the neck and thorax in standard ceCT and ce-PET/CT in our department. First, 40 mL of contrast media (Ultravist 370, Bayer Schering Healthcare, Germany) was applied at a flow of 5 mL/s via a cubital vein. This represents the default protocol as sug-gested by the vendor. After a 5-s delay, the perfusion data were acquired for 50 s in the area of interest (1 s rotations time with 1 image/s, cine duration 50 s, 8 slices, 5 mm slice thickness, 80 mA, 80 kV). Thus, an anatomical cranio-caudal coverage of 4 cm was achieved for the perfusion examination of the target ENT lesion. The first contrast media bolus was followed by a saline flush (20 mL, 5 mL/s). Since the system did no allow for a shuttle mode at the time of the study, a 4-cm FOV for perfusion imaging represents the maximum coverage possible with the chosen time resolution.
Directly after the perfusion, a second bolus of another 30 mL of contrast media (Ultravist 370, Bayer Schering Healthcare, Germany) was applied at 4 ml/s followed by a saline flush of 30 mL to ensure full diagnostic ceCT data of the neck and thorax because all CTP examinations were fully integrated into the routine, clinical cePET/CT staging and re-staging examination.
The non-enhanced low-dose CT data (4.25 mm slices) were used for attenuation correction, and images were reconstructed by using OSEM. For image co-registration and analysis, all reconstructed images (non-enhanced CT, ceCT, CTP images) were then transferred to a commercially available workstation (Advantage Workstation, 4.4, GE Healthcare, Milwaukee, WI, USA), where image data were evaluated in all three planes as a single procedure and in a co-registered mode. CTP data were evaluated using com-mercially available perfusion software with a deconvolution method to calculate the perfusion values (CT-Perfusion 3, Body-Protocol; see also“Image evaluation” below).
Image evaluation CTP evaluation
CTP data were evaluated by a dual-board-certified nuclear medicine physician/radiologist using the aforementioned default body protocol of the commercially available CTP
software. A threshold of−3 to −120 HU was defined for soft tissue visualization. The arterial input was defined by a circular automated region of interest (ROI) in one of the cervical arteries within the FOV on the contralateral side of the target lesion. The calculated time–enhancement curve and the parametric imaging maps for BF (mL/100 mg tissue/ min), BV (mL/100 mg tissue) and MTT (seconds) were automatically calculated by the software. The permeability surface (PS) was not calculated (short study protocol). A freehand ROI defined by the margin of the target ENT lesion was placed in every slice of the perfusion volume (4 cm coverage, 5 mm slice thickness). In cases when a FDG-positive lymph node was detected within the FOV, another ROI defined by the margins of the lymph node was placed in the perfusion volume, too (11 patients). The reason was to compare the perfusion values of metastatic lymph nodes with the perfusion values of the primary tu-mour because other, larger studies already investigated the comparison of metastatic vs. non-metastatic lymph nodes (see“Discussion”).
A third ROI was positioned within the contralateral healthy ENT tissue (the opposite side pair of the same organ if applicable or contralateral side) to compare perfusion values of malignant and non-malignant ENT tissue [22] Several other publications already evaluated tumours vs. normal muscle. Thus, because this concept already proved to be reliable for general comparison reasons, we chose another evaluation specifically for ENT tissue comparisons.
PET/CT data evaluation
PET data were evaluated by another dual-board-certified nuclear medicine physician/radiologist. A cubic VOI (volume of interest) was placed over the primary target ENT lesion on the PET/CT images and over the FDG-positive lymph node if present within the CTP-FOV. The software then creates an additional threshold delimited VOI within the aforementioned cubic VOI boundaries which in turn delineates the lesion. The threshold taken for the second VOI was 42 % of maximum voxel (default by software).
The VOI automatically calculates the standard uptake values (SUVmax, SUVmean), TLG and the volume of the lesion (PETvol) based on the FDG uptake.
Statistical analysis
The differences between the CTP values as well as PET values of ENT tumours, healthy contralateral ENT tissue, inflammatory lesions and metastatic lymph nodes were tested for statistical significance with the Mann–Whitney test. A p value less than 0.05 was considered statisti-cally significant.
The correlation between all CTP data and all evaluated PET data were calculated using Pearson correlation first. Additionally, Spearman’s rho, a non-parametric rank corre-lation coefficient, was used. A P value of less than 0.01 was considered statistically significant.
To demonstrate supplemental confidence intervals, boot-strap confidence intervals were calculated, too. Statistical analyses were performed with SPSS statistical software (version 16.0.1, SPSS Inc, Chicago, Ill).
Results Patients
In 35 of 41 patients a malignant head and neck cancer was confirmed by histopathology (clinical stage, Table1). In 20 patients, contralateral, healthy ENT tissue could be mea-sured. In the remaining 15 patients, the ENT tumour was suspected to or crossed the midline, making contralateral measurements possibly not reliable. In six patients, histopa-thology showed inflammatory lesions. In 11 out of 24 patients with suspected lymph nodes metastases, malignant lymph nodes were located within in the CTP volume. CTP values of malignant lesions, contralateral healthy ENT tissue, metastatic lymph nodes and inflammatory lesions CTP values of the confirmed malignant tumours and con-firmed inflammatory lesions were compared. Mean BF of malignant tumours was 89.6 mL/100 mg/min, mean BV was 5.7 mL/100 mg and mean MTT was 7.4 s compared to 68.6 mL/100 mg/min, 4.0 mL/100 mg and 5.5 s in inflamma-tory lesions. Interestingly, the MTTs of inflammainflamma-tory lesion were lower than for the malignant lesions.
Comparisons of BF, BV and MTT of malignant and inflammatory lesions were statistically significant different (P00.0001, P00.0012, P<0.0001, respectively) (Fig.1).
The CTP values of healthy contralateral ENT tissue showed a mean BF of 42.1 mL/100 mg/min, a mean BV of 3.4 mL/100 mg and a mean MTT of 10.8 s. Comparisons of BF, BV and MTT of malignant ENT lesions and contralateral
healthy ENT tissue were statistically significant different (P< 0.0001, P00.0001, P00.03, respectively).
The CTP values of metastatic lymph nodes showed a mean BF of 93.4 mL/100 mg/min, a mean BV of 4.4 mL/ 100 mg and a mean MTT of 4.5 s. All parameters were statistically significant different when compared to the tumour lesions (all P≤0.002) (Fig. 2). Again, MTT of metastatic lymph nodes was lower than for the malignant lesions. PET values of malignant lesions, contralateral healthy ENT tissue, metastatic lymph nodes and inflammatory lesions PET values of the confirmed malignant tumours and con-firmed inflammatory lesions were compared. As expected, SUVmax and SUVmean were statistically significant different (tumour vs. inflammation: 10.2 vs. 5.4 and 6.3 vs. 3.2, P00.02; P00.03).
When comparing the TLG, no statistically significant difference was found between tumours and inflammatory ENT tissue (TLG tumour, 94101; TLG inflammation, 49183; P00.8). No statistical difference was found when comparing the PETvol between tumours and inflammatory ENT tissue (PETvol tumour, 14.0 cm3; PETvol inflammation, 18.0 cm3; P00.1)
The PET values of healthy contralateral ENT tissue showed a mean SUVmax of 3.3, a mean SUVmean of 2.1, a mean TLG of 19328 and a PETvol of 11.8 cm3. Comparisons of PET parameters of malignant ENT lesions and contralateral healthy ENT tissue were in part statistically significant different (SUVmax/mean, P<0.0001; TLG, P00.001; PETvol, P00.8) (Fig.3). Thus, on the basis of PETvol no differentiation could be made between healthy contralateral ENT tissue and tumours.
The PET values of metastatic lymph nodes showed a mean SUVmax of 6.9, a mean SUVmean of 4.8, a mean TLG of 57563 and a PETvol of 9.3 cm3. No further statis-tical evaluation was applied (see“Discussion”).
All CTP data and PET data of malignant lesions, meta-static lymph nodes and inflammatory lesions are listed in Table2.
Correlation of CTP data and PET data
All perfusion data (BF, BV, MTT) were correlated with all acquired PET parameters (SUVmax, SUVmean, TLG and PETvol). No obvious statistically significant relations could be established between the evaluated CTP parameters and corresponding PET parameters (Table 3). However, boot-strap confidence intervals for correlation of BF and SUV-max as well as BF and SUVmean showed upper limits of confidence intervals of 0.519 and 0.528. Thus, there might possibly be a fair correlation for those parameters in this patient population.
Table 1 Clinical stage of patients with confirmed malignant tumours
Clinical stage (n035)
T 5×T1 11×T2 7×T3 12×T4
N 11×N0 3×N1 4×N2a 3×N3
9×N2b 5×N2c
Discussion
Currently there is only limited experience available concerning the differences in perfusion characteristics between ENT tumours and healthy contralateral ENT tissues, inflammatory lesions and metastatic lymph nodes and the correlation of PET parameters and CTP parameters in those patients. So far, this is one of the largest studies evaluating PET/CT with integrated CTP in head and neck cancer patients. When comparing CTP parameters between tumours and inflammatory lesions, healthy contralateral tissue and metastatic lymph nodes significant dif-ferences were found. PET parameters between tumours and inflammatory lesions, healthy contralateral tissue and meta-static lymph nodes were in part significantly different. No significant correlations were found between CTP parameters and PET parameters.
General aspects
Several issues have to be addressed when implementing a CTP protocol into a whole-body FDG-PET/CT protocol.
Such an advanced imaging concept should, ideally, provide additional useful parameters at equal or only minimally higher procedure complexity at the same time. The advantage of an integrated PET/CT approach is that the PET component already indicates the location of the pathology in question and the perfusion examination can be planned accordingly; thus, unlike other dedicated CTP research studies, no additional CT localizer is needed. Furthermore, when integrated in a PET/CT ex-amination, whole-body staging and information about distant metastases are available in one step.
Tumour vs. healthy contralateral tissue
We found significant differences in CTP values between the primary tumour lesion and the contralateral healthy tissue. This is in line with the results of Faggioni and co-workers who were the first to show that CTP values differ not only between tumours and muscle tissue, but also between tu-mour lesions and the contralateral healthy side [20]. These characteristics and perfusion values are based on the
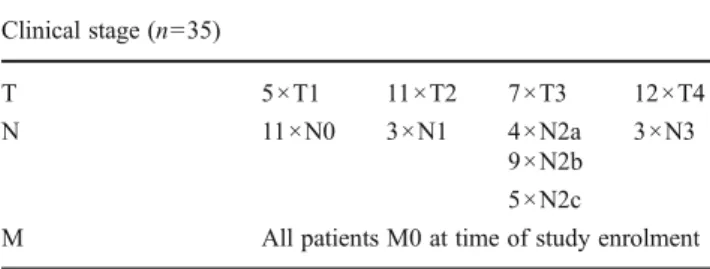
Fig. 1 Top row 3D MIP PET, axial contrast-enhanced CT, axial contrast-enhanced PET/CT. Bottom row axial images of the same area displayed as BF, BV and MTT. A 74-year-old male patient with a suspected malignant tumour of the right submandibular gland (white
arrow). The CT shows an unclear lesion of the right submandibular gland, the PET/CT shows mild FDG uptake. The perfusion images show mildly elevated BF and BV compared to mean tumour values, but lower MTT. The lesion turned out to be inflammatory
different tissue architecture of the different head and neck tissue compartments (e.g. lymphoid tissue) and underline the ability of CTP to distinguish different types of tissue. The reason for the significant different perfusion parameters compared to tumours is the increased perfusion demand based on an enlarged neovascular bed evoked by tumoral neoangiogenesis with consecutive intratumoral arteriove-nous shunts [20, 23]. This physiological concept has been also demonstrated by the correlation between BF (and ad-ditionally but not significantly so, BV) and tumour micro-vessel density [23, 24]. Concerning the PET parameter it well known that PET/CT can differentiate between non-malignant tissue and non-malignant ENT lesions. However, the PETvol was not statistically different between non-malignant tissue and non-malignant lesions. This is probably due to inability of the software to differentiate subtle differ-ences of tissue with comparable metabolic activity which is evident in the head and neck area (e.g. muscle activity, lymphoid tissue) and thus too large a volume is calculated.
Tumour vs. inflammation
We found significant differences in CTP values between the primary tumour lesion and the inflammatory ENT lesions. Diagnostically, differentiation of malignant and non-malignant lesions in the ENT area is challenging because several anatomical structures are located tightly beneath each other. It had already been demonstrated, however, that CTP might be able to distinguish between inflam-mation and tumour in other entities [25]. Those results indicate that CTP is a very sensitive method concerning this differentiation. An interesting aspect is that the MTTs of inflammatory lesions were lower than those of malignant lesions. Generally, one would expect faster flow in tumour lesions than in inflammation tissue. However, a possible interpretation of this phenomenon might be that tumour-related necrosis in malignant lesions prolongs the MTT, whereas in inflammatory lesions tissue structure and architecture are intact.
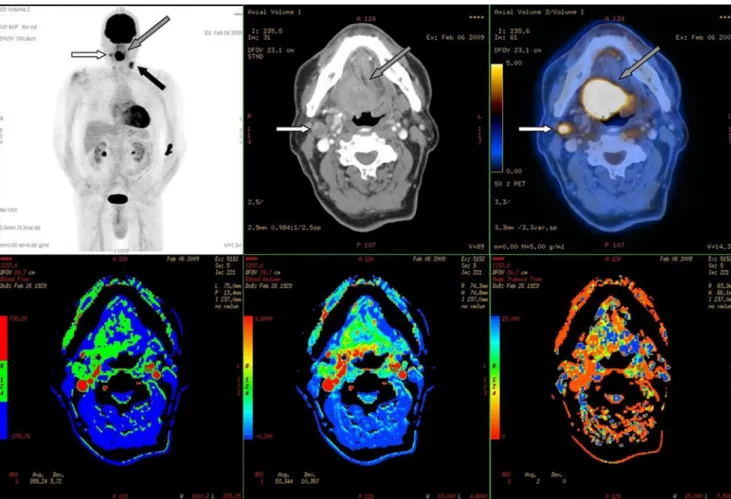
Fig. 2 Top row 3D MIP PET, axial contrast enhanced CT, axial contrast-enhanced PET/CT. Bottom row axial images of the same area displayed as BF, BV and MTT. A 70-year-old male patient with a suspected malignant tumour of the base of the tongue (grey arrows). The patient additionally had a right cervical lymph node metastases within the CTP-FOV (white arrows) and another large left cervical
lymph node metastasis (black arrow, not within CTP-FOV). CT shows a large contrast-enhancing mass at the right base of the tongue and a pathologically and partly necrotic lymph node right cervically, the PET/CT shows elevated FDG uptake in those lesions. The perfusion images show highly elevated BF and BV and a decreased MTT
PET/CT is known to be less specific concerning the differentiation of inflammatory lesions and tumours, espe-cially in the head and neck area [26]. We found statistically significant differences between tumours and inflammation in SUVmax and SUVmean, whereas the TLG and the PET-vol were not able to distinguish either entity. The PETPET-vol measures the volume of increased metabolic activity and therefore it is coherent that it cannot differentiate between the reason for increased metabolic activity—whether derived from tumour or inflammation. It has been proven that the TLG
might be a useful prognostic parameter in different tumours [16–19]. However, since the TLG is influenced by the PET-vol, it might not be useful for differentiation between tumours and inflammation.
Tumour vs. metastatic lymph nodes
Trojanowska and co-workers found in a recent study that CTP is be able to distinguish between malignant and benign lymph nodes in patients with ENT cancer [21]. BF, BV and
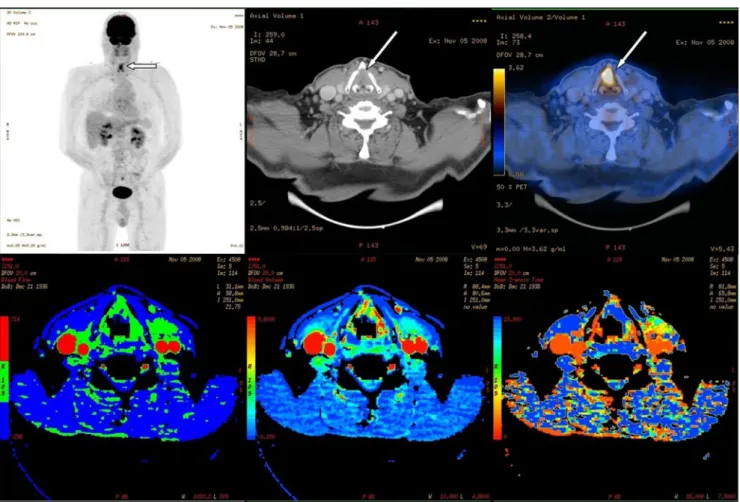
Fig. 3 Top row 3D MIP PET, axial contrast-enhanced CT, axial contrast-enhanced PET/CT. Bottom row axial images of the same area displayed as BF, BV and MTT. A 72-year-old male patient with suspected laryngeal cancer of the anterior commissure (white arrows).
The CT shows a focal thickening of the anterior vocal cords bilaterally, the PET/CT shows the corresponding elevated FDG uptake. The per-fusion images show highly elevated BF and BV and a decreased MTT
Table 2 Comparison of mean CTP values and mean PET val-ues of tumours, healthy contra-lateral side, inflammatory lesions and lymph nodes
Malignant tumour Inflammatory lesions Contralateral side Lymph nodes
BF (mL/100 mg/min) 89.6 68.6 42.1 93.4 BV (mL/100 mg) 5.7 4.0 3.4 4.4 MTT (s) 7.4 5.5 10.8 4.5 SUVmax 10.2 5.4 3.3 6.9 SUVmean 6.3 3.2 2.1 4.9 TLG 94101 49183 19328 57563 PETvol (cm3) 14 18 11.8 9.3
PS (permeability surface area) were statistically different between these two groups, whereas MTT was not signifi-cantly different. While the BF in our group was lower than that published in the aforementioned study, the MTT and BV were quite similar. We had a much smaller group of lymph nodes within the FOV and thus we did not compare metastatic lymph nodes vs. non-metastatic lymph nodes in ENT cancer patients. However, it is an interesting finding that all CTP parameters in our study were significantly different between malignant primary lesions and metastatic lymph nodes. A possible reason is the amount of malignant cells within a lymph node vs. the number of malignant cells within the primary tumour and the consequent demand for blood supply. An interesting aspect might be that metastatic lymph nodes in our study had a high BF, a low BVand a fast MTT. This might be partly attributed to HPV-positive lymph nodes. Those nodes are
generally large, but do contain a large amount of cystic/necrotic material and thus the SUV can be very low [27].
We did not evaluate PS because we used too short a protocol to measure stable PS values. Again, the MTT in our study was lower in the metastatic lymph nodes than in the primary malignant lesion.
We did not compare the PET/CT data between the primary malignant lesion and metastatic lymph nodes, because those PET parameters in part depend on lesion size. However, it has already been shown that metastatic lymph nodes might have different SUV values than the primary tumour [28].
Correlation of PET and CTP values
We did not find obvious correlations between CTP values and PET values. But, the confidence intervals for the
Table 3 Correlation of CTP da-ta and PET dada-ta. Correlations of CTP data (BF, BV, MTT) with PET data (SUVmax, SUVmean, TLG). No obvious correlation was found. On the basis of the given confidence intervals, a correlation between SUVmax as well as SUVmean and BF of up to 0.5 might be possible
BF (mL/100 mg/min) BV (mL/100 mg) MTT (s)
SUVmax Pearson correlation 0.070 0.064 0.239
Sig. (2-tailed) 0.694 0.719 0.174 Spearman’s rho 0.182 0.005 0.145 Sig. (2-tailed) 0.295 0.978 0.405 Bootstrap Std. error 0.178 0.184 0.175 95 % CI lower 0.186 0.362 0.457 Upper 0.519 0.345 0.198
SUVmean Pearson correlation 0.060 0.057 0.226
Sig. (2-tailed) 0.736 0.749 0.198 Spearman’s rho 0.176 0.016 0.140 Sig. (2-tailed) 0.313 0.929 0.422 Bootstrap Std. error 0.182 187 0.179 95 % CI lower 0.199 0.377 0.457 Upper 0.528 0.337 0.206 TLG Pearson correlation 0.006 0.128 0.151 Sig. (2-tailed) 0.974 0.470 0.393 Spearman’s rho 0.023 0.118 0.020 Sig. (2-tailed) 0.895 0.499 0.908 Bootstrap Std. error 0.191 0.200 0.178 95 % CI lower 0.404 0.519 0.367 Upper 0.367 0.300 0.326
PETvol Pearson correlation 0.112 0.237 0.020
Sig. (2-tailed) 0.529 0.177 0.910 Spearman’s rho 0.090 0.182 0.028 Sig. (2-tailed) 0.606 0.296 0.874 Bootstrap Std. error 0.186 0.199 0.164 95 % CI lower 0.467 0.571 0.288 Upper 0.301 0.236 0.337
correlation of SUVmax and BF as well as SUVmean and BF showed an upper limit of 0.5 and therefore there might be a possible correlation.
One other publication already indicated that there might be significant correlations between SUVmax and BF as well as SUVmean and BF in patients with ENT cancer [14]. Other publications indicated that coupling between SUV and BF might be evident in other lesions too [3, 4, 29]. The physiological concept of elevated cell metabolism in-duced by increased blood supply is generally accepted and has been proved in different tissues. However, in tumours an elevated SUV might be the expression of different intracel-lular pathways. Increased glycolysis can be a response to an increase in energy demand, increase of cell proliferation, increase of synthesis rates or activation of specific oncogenic pathways. Thus, the SUV itself is already a balanced signal and comprised of different components. Those changes might additionally also happen in the presence of an inadequate oxygen feed, because tumours can have continued high gly-colytic rates even with inadequate oxygen supply (Warburg effect) [30,31]. Several studies furthermore concluded that increased consumption of glucose in tumours/metastatic lesions is not only used for substantial energy production via Embden–Meyerhoff glycolysis, but rather for production of acids. In consequence, acids are believed to give cancer cells a competitive advantage for invasion. Alternatively, the glucose might be also used for generation of anabolic precursors [32]. However, coupling and significant correlation might depend on the tumour entity and glycolytic status of the tumour. Hirasawa and co-workers found in a small patient population with suspected head and neck tumours that BF and SUV measurement were inversely correlated [15]. They concluded that this might be attributed to anaerobic glycolysis which is contradictory with the results mentioned above in head and neck cancers and other tumour entities. Overall, the additional CTP values can provide additional insights into tumour be-haviour and their glycolytic status.
Significant differences between our study and the afore-mentioned trials have to be afore-mentioned and might partly explain the differences in our results. Our current study investigated the biggest patient population with ENT can-cers to date. Furthermore, the perfusion volume was as twice as large (64-slice CT, 4 cm CTP coverage) as in the other studies and this might have contributed additionally to those differences.
The TLG represents a combination of the lesion’s volume and the average SUV and is considered as a useful parameter to represent the overall tumour burden. It has been shown to be of prognostic value in several tumour entities [17,19,33]. We found no significant correlations in our study between TLG and CTP values and the confidence intervals showed only low possible correlations. Thus, no obvious advantage when comparing CTP values to the “routine” SUVmax
evaluation could be demonstrated. A possible advantage concerning its prognostic value vs. or combined with CTP values (which can also have prognostic value) has to be investigated.
Limitations
A limitation is certainly the somewhat limited number of patients overall and the limited number of patients having metastatic lymph nodes within the CTP FOV. However, the CTP values of metastatic lymph nodes and inflammatory lesions are comparable with the those in the literature. Another limitation is the diverse group of tumour entities evaluated. Most of the available CTP studies used a 50-s CTP protocol and also evaluated the permeability surface product (PS) [8, 14, 22, 34]. We chose not to further discuss that parameter because PS is typically measured after 90 s based on the intravessel time of the contrast media. Thus, the PS might be compromised by the short examination time.
We did not evaluate the prognostic impact of the CTP and PET values because only a small proportion of the patients underwent the same treatment pathway. However, the prog-nostic impact of several PET parameters has already been evaluated [28]. There are also several indicators that CTP can have prognostic impact in several tumour entities [10,
34,35].
Outlook
Since more hybrid PET/CT systems with perfusion capabil-ities are currently being installed, combined PET/CTP might find its way into clinical routine to support the diagnosis of malignant versus non-malignant lesions. However, to achieve such a routine clinical level, it is first mandatory to find a cut-off value for the differentiation of malignant vs. non-malignant lesions based on perfusion parameters. How-ever, to find such a generally accepted cut-off is complicat-ed, because there are currently no guidelines and generally accepted technical specifications on how to perform perfu-sion imaging. Thus, such a cut-off value currently can only be used in a single centre where it is evaluated. In our study, the mean BF for malignant lesions was 89.6 mL/100 mg/ min and 68.6 mL/100 mg/min for inflammatory lesions. Since the BF for malignant lesions was comparable with other studies available in the literature (as discussed above), those values around 90 mL/100 mg/min (when evaluated with the same post-processing software) might support the diagnosis of malignant rather than non-malignant ENT lesions in questionable cases when the SUVmax does not clearly indicate malignancy. However, we did not apply any further ROC analysis because we feel that the patient
number for that is somehow limited, especially concerning the inflammatory lesions.
In conclusion, PET/CTP can be integrated into a routine, contrast-enhanced PET/CT protocol for staging in ENT cancers without additional use of contrast media. CTP and PET parameters were not significantly correlated and hence the additional CTP values can provide additional insights into tumour behaviour and their glycolytic status. Metastatic lymph nodes have high CTP values and can be possibly differentiated from the primary tumour lesion. The primary tumour and inflammatory lesions can be differentiated by CTP values as well as partially by PET measurement. Fur-ther research and especially larger standardized studies are needed concerning combined ratios of CTP and PET values for a better understanding of the relation between tumour perfusion and glycolytic rate.
Acknowledgments The study was partly supported by Bayer
Health-care within an ISS grant.
References
1. Bellomi M, Petralia G, Sonzogni A, Zampino MG, Rocca A (2007) CT perfusion for the monitoring of neoadjuvant chemo-therapy and radiation chemo-therapy in rectal carcinoma: initial
experi-ence. Radiology 244:486–493
2. Bisdas S, Bohning DE, Besenski N, Nicholas JS, Rumboldt Z (2008) Reproducibility, interrater agreement, and age-related changes of fractional anisotropy measures at 3T in healthy sub-jects: effect of the applied b-value. AJNR Am J Neuroradiol
29:1128–1133
3. Groves AM, Wishart GC, Shastry M et al (2009) Metabolic-flow relationships in primary breast cancer: feasibility of combined PET/dynamic contrast-enhanced CT. Eur J Nucl Med Mol Imaging
36:416–421
4. Miles KA, Griffiths MR, Keith CJ (2006) Blood flow-metabolic relationships are dependent on tumour size in non-small cell lung cancer: a study using quantitative contrast-enhanced computer tomography and positron emission tomography. Eur J Nucl Med
Mol Imaging 33:22–28
5. Sahani DV, Holalkere NS, Mueller PR, Zhu AX (2007) Advanced
hepatocellular carcinoma: CT perfusion of liver and tumor tissue–
initial experience. Radiology 243:736–743
6. Sahani DV, Kalva SP, Hamberg LM et al (2005) Assessing tumor perfusion and treatment response in rectal cancer with multisection CT: initial observations. Radiology 234:785–792
7. Bisdas S, Medov L, Baghi M et al (2008) A comparison of tumour perfusion assessed by deconvolution-based analysis of dynamic contrast-enhanced CT and MR imaging in patients with squamous cell
carcinoma of the upper aerodigestive tract. Eur Radiol 18:843–850
8. Bisdas S, Rumboldt Z, Surlan-Popovic K, et al (2010) Perfusion CT in squamous cell carcinoma of the upper aerodigestive tract: long-term predictive value of baseline perfusion CT
measure-ments. AJNR Am J Neuroradiol 31:576–581
9. Li XS, Fan HX, Zhu HX, Song YL, Zhou CW (2011) The value of perfusion CT in predicting the short-term response to synchronous radiochemotherapy for cervical squamous cancer. Eur Radiol
22:617–24
10. Zima A, Carlos R, Gandhi D, Case I, Teknos T, Mukherji SK (2007) Can pretreatment CT perfusion predict response of ad-vanced squamous cell carcinoma of the upper aerodigestive tract treated with induction chemotherapy? AJNR Am J Neuroradiol
28:328–334
11. Schoder H, Carlson DL, Kraus DH et al (2006) 18F-FDG PET/CT for detecting nodal metastases in patients with oral cancer staged N0 by clinical examination and CT/MRI. J Nucl
Med 47:755–762
12. Schoder H, Yeung HW, Gonen M, Kraus D, Larson SM (2004) Head and neck cancer: clinical usefulness and accuracy of PET/CT image fusion. Radiology 231:65–72
13. Veit-Haibach P, Kuehle, CA, Beyer T, et al (2006) Whole-body PET/CT-colonography: diagnostic accuracy of a new staging con-cept in patients with colorectal cancer. JAMA 296:2590–600 14. Bisdas S, Spicer K, Rumboldt Z (2008) Whole-tumor perfusion
CT parameters and glucose metabolism measurements in head and neck squamous cell carcinomas: a pilot study using combined positron-emission tomography/CT imaging. AJNR Am J
Neuro-radiol 29:1376–1381
15. Hirasawa S, Tsushima Y, Takei H et al (2007) Inverse correlation between tumor perfusion and glucose uptake in human head and
neck tumors. Acad Radiol 14:312–318
16. Akhurst T, Ng VV, Larson SM et al (2000) Tumor burden assess-ment with positron emission tomography with [18-F] fluoro 2-deoxyglucose (FDG PET) modeled in metastatic renal cell cancer.
Clin Positron Imaging 3:57–65
17. Larson SM, Erdi Y, Akhurst T et al (1999) Tumor treatment response based on visual and quantitative changes in global tumor glycolysis using PET-FDG imaging. The visual re-sponse score and the change in total lesion glycolysis. Clin Positron Imaging 2:159–171
18. Melton GB, Lavely WC, Jacene HA et al (2007) Efficacy of preoperative combined 18-fluorodeoxyglucose positron emission tomography and computed tomography for assessing primary rec-tal cancer response to neoadjuvant therapy. J Gastrointest Surg
11:961–969, discussion 969
19. Steinert HC (2005) PET in lung cancer. Chang Gung Med J
28:296–305
20. Faggioni L, Neri E, Bartolozzi C (2010) CT perfusion of head and
neck tumors: how we do it. AJR Am J Roentgenol 194:62–69
21. Trojanowska A, Trojanowski P, Bisdas S, et al (2011) Squamous
cell cancer of hypopharynx and larynx– evaluation of metastatic
nodal disease based on computed tomography perfusion studies.
Eur J Radiol 81:1034–9
22. Faggioni L, Neri E, Cerri F, et al 64-row (2011) MDCT perfusion of head and neck squamous cell carcinoma: technical feasibility and quantitative analysis of perfusion parameters. Eur Radiol 21:113–121
23. Ash L, Teknos TN, Gandhi D, Patel S, Mukherji SK (2009) Head and neck squamous cell carcinoma: CT perfusion can help non-invasively predict intratumoral microvessel density. Radiology
251:422–428
24. Goh V, Halligan S, Daley F, Wellsted DM, Guenther T, Bartram CI (2008) Colorectal tumor vascularity: quantitative assessment with
multidetector CT–do tumor perfusion measurements reflect
angio-genesis? Radiology 249:510–517
25. Goh V, Halligan S, Taylor SA, Burling D, Bassett P, Bartram CI (2007) Differentiation between diverticulitis and colorectal cancer: quantitative CT perfusion measurements versus morphologic
cri-teria–initial experience. Radiology 242:456–462
26. Veit-Haibach P, Luczak C, Wanke I, et al (2007) TNM staging with FDG-PET/CT in patients with primary head and neck cancer. Eur J
Nucl Med Mol Imaging 34:1953–62
27. Haerle SK, Strobel K, Ahmad N, Soltermann A, Schmid DT, Stoeckli SJ (2011) Contrast-enhanced (1)F-FDG-PET/CT for the
assessment of necrotic lymph node metastases. Head Neck
33:324–329
28. Hustinx R, Lucignani G (2010) PET/CT in head and neck cancer:
an update. Eur J Nucl Med Mol Imaging 37:645–651
29. Veit-Haibach P, Treyer V, Strobel K, et al (2010) Feasibility of integrated CT-liver perfusion in routine FDG-PET/CT. Abdom Imaging 35:528–536
30. Rajendran JG, Mankoff DA, O’Sullivan F et al (2004) Hypoxia and glucose metabolism in malignant tumors: evaluation by [18F] fluoromisonidazole and [18F]fluorodeoxyglucose positron
emis-sion tomography imaging. Clin Cancer Res 10:2245–2252
31. Warburg O (1956) On the origin of cancer cells. Science
123:309–314
32. Gillies RJ, Robey I, Gatenby RA (2008) Causes and consequences of
increased glucose metabolism of cancers. J Nucl Med 49:24S–42S
33. Cazaentre T, Morschhauser F, Vermandel M, et al (2010) Pre-therapy 18F-FDG PET quantitative parameters help in predicting the response to radioimmunotherapy in non-Hodgkin lymphoma. Eur J Nucl Med Mol Imaging 37:494–504
34. Surlan-Popovic K, Bisdas S, Rumboldt Z, Koh TS, Strojan P (2010) Changes in perfusion CT of advanced squamous cell car-cinoma of the head and neck treated during the course of
concom-itant chemoradiotherapy. AJNR Am J Neuroradiol 31:570–575
35. Sabir A, Schor-Bardach R, Wilcox CJ et al (2008) Perfusion MDCT enables early detection of therapeutic response to