DOI 10.1007/s10704-008-9268-5
O R I G I NA L PA P E R
Size and boundary effects on desiccation cracking
in hardened cement paste
Jan Bisschop
Received: 30 May 2008 / Accepted: 7 October 2008 © Springer Science+Business Media B.V. 2008
Abstract The density of cracks or size of fragments formed in hardened cement paste upon first drying is affected by specimen size as measured with a crack-impregnation technique in free shrinking specimens with a thickness of 4 cm. Fragment size on the drying surface increased with distance away from the speci-men corner, resulting in smaller average surface crack densities in larger specimens. Size effect on three-dimensional crack density, that was measured from sec-tions through the impregnated specimens, was weaker. The size effect is explained by higher residual thermal stresses in larger specimens due to the cement hydration process. For comparison a desiccation crack pattern in a 5-mm-thick cement paste layer on a marble substrate was studied. Residual thermal stresses in this specimen were probably low and a uniform crack-pattern with a Gaussian-like fragment size distribution formed.
Keywords Size effect· Microcracking · Drying ·
Concrete· Image analysis
1 Introduction
Desiccation or drying shrinkage (micro)cracking is a common feature of concrete pavements, floors and
J. Bisschop (
B
)Civil, Environmental and Geomatic Engineering, ETH-Zürich, Institute for Building Materials, 8093 Zurich, Switzerland
e-mail: [email protected]
repair layers. The shrinkage is a result of water removal from capillary and gel pores in the cement paste matrix in concrete. Mechanisms of drying shrinkage upon first drying of hardened cement paste are a change in surface free energy (Gibbs-Bangham shrinkage) and capillary tension or disjoining pressure (Hansen 1987). The ini-tial small width (and penetration depth) of desiccation cracks in concrete make them invisible to the unaided eye. However, they can grow during service life by traf-fic loading (fatigue) or due to ongoing drying and ulti-mately affect concrete durability. Surface cracking in
concrete may accelerate the ingress of Cl−-ions that
may lead to corrosion of the steel reinforcement bars in concrete structures (Northcott 1992;Ismail et al. 2008). A fundamental understanding of desiccation cracking in cementitious materials will help to diminish its occur-rence in concrete by choosing the right material compo-sition, pavement dimensions, joint spacing or restraint boundary conditions.
Desiccation cracking has been experimentally stud-ied in a wide range of materials such as clay mixtures (Corte and Higashi 1964; Colina and Acker 2000);
laponite (Mal et al. 2007); coffee–water mixtures
(Groisman and Kaplan 1994;Toga and Erdem Alaca 2006); gels (Bohn et al. 2005a); starch–water mixtures (Bohn et al. 2005b); and alumina suspensions (e.g.,
Shorlin et al. 2000). Desiccation crack-patterns in these experimental systems look very similar to those obs-erved in hardened cement paste, but the reason for crack formation differs. Suspension mixtures mainly crack due to the restraint provided by the substrate and
cracks extend from the drying surface to the substrate
(e.g.,Groisman and Kaplan 1994). When the friction
of the mixture with the substrate is reduced, the crack
density decreases (Groisman and Kaplan 1994;Shorlin
et al. 2000). In contrast, hardened cement paste also cracks upon drying in the absence of an external sub-strate restraint. We call this behaviour ‘self-restraint’, desiccation cracking solely due to the development of a (steep) moisture and shrinkage gradient at the onset of drying.
Several size effects have been reported for clay or other suspension mixtures. Larger specimen thickness has repeatedly been found to reduce crack densities on
the drying surface (Corte and Higashi 1964;Groisman
and Kaplan 1994;Colina and Acker 2000;Shorlin et al. 2000;Bohn et al. 2005b). The layer thickness effect can be easily explained from linear elastic theory and a crit-ical stress condition (Kitsunezaki 1999). Layer thick-ness also has an effect on the crack-junction angles (Groisman and Kaplan 1994;Leung and Néda 2000;
Toga and Erdem Alaca 2006). An effect of lateral speci-men dispeci-mensions (width or length) at constant thickness
is perhaps not expected. However,Colina and Acker
(2000) report a lower crack density for clay specimens that were reduced in lateral dimensions but had con-stant layer thicknesses.
A large number of theoretical papers have been pub-lished about desiccation crack-patterns. Different approaches have been used to predict universal char-acteristics of desiccation crack-patterns (Li et al. 1995;
Kitsunezaki 1999;Leung and Néda 2000;Jagla 2002;
Jenkins 2005) or to simulate desiccation cracking in specific materials (Chertkov 2002;Bolander and Berton 2004). In modeling of desiccation cracking in concrete pavements or repair layers, the choice of boundary con-ditions are important. The concrete may be attached to a substrate or experience no external restraint at all (Hong et al. 1997;Yang et al. 2002;Bolander and Berton 2004). Predictions of initial spacing and depth of desiccation cracks can be made using a half-plane model (Li et al. 1995;Jagla 2002). However, the way desiccation cracks propagate during ongoing drying will be very much determined by the boundary con-ditions and slab thickness.
Few experimental data exists on the formation of desiccation crack-patterns in cementitious materials. The prime reason is probably that desiccation crack widths remain small (<50µm) and therefore are invis-ible to the unaided eye. Desiccation cracks in
cementi-tious materials are clearly visible at high magnification in, for example, the (Environmental) Scanning Electron
Microscope (Kjellsen and Jennings 1996). However,
the patterns that desiccation cracks form in cementi-tious materials on a macroscopic scale have only rarely
been studied.Colina and Acker (2000) recorded the
development of a desiccation crack-pattern and its frac-tal dimension in concrete by the ‘re-sweating’ method. In this paper, we study the effect of specimen size on the most basic type of desiccation cracking in cementitious materials, cracking due to ‘self-restraint’ in plain hard-ened cement paste. Furthermore, desiccation cracking in hardened cement paste undergoing substrate-restraint is investigated.
2 Method
2.1 Material, curing and drying conditions
All studied specimens consisted of ordinary Portland cement (CEM I 52.5R) with an added water–cement ratio of 0.5. The cement pastes were thoroughly mixed in a Hobart mixer and for 10 min with a mixing spoon on a drilling machine. The cement paste was cast in
2-cm-thick plywood moulds of 8× 8× 4; 16× 16× 4;
32× 32× 4 and 64× 64× 4cm and vibrated for 1min.
The 4× 4× 4cm specimens were cut from 4× 4×16cm
specimens. The moulds were sealed with plastic sheets and a wooden cover, and stored for 24 h in a
con-ditioning room at 20◦C and 95% RH. Most of the
specimens were taken out of their moulds and sealed in plastic bags at an age of 24 h. Two of the three
64× 64× 4cm specimens (with a weight of ∼30kg)
were left in their moulds for 4 and 7 days, respectively. The weight and thickness of the specimens were mea-sured to calculate the effective w/c-ratio of the speci-men (after vibration and sedispeci-mentation) using a cespeci-ment
density of 3.12 g/cm3. In a 64× 64× 4cm specimen
the temperature evolution and gradients due to cement hydration were measured.
At an age of 7 days, all sides except the top-surface of the specimens were sealed with three layers of adhesive tape. The top-surface (drying surface) was the former bottom surface of the specimen in the mould. Thus, only one side of the specimens was exposed to cre-ate one-dimensional drying conditions. After sealing, the initial weight of specimens was recorded. Then, the specimens were placed in a large environmental
cabin to start the drying experiments that lasted for 7 days. Although the specimens were far from the ulti-mate state of drying, they likely reached their final state of desiccation cracking after 7 days (see Sect. 4.1). The environmental cabin (a Vötsch VC4060) was ventilated with air with a temperature of 20.0± 0.5◦C and
rela-tive humidity of 30± 3%. The weight of the smaller
specimens was frequently measured for over the
dry-ing period of 7 days. Two of the three 64× 64× 4cm
specimens were dried at 25.0± 0.5◦C and 30± 3% rel-ative humidity, and one of them for a period of 4 weeks. One ‘thin-layer’ cement paste specimen (TL-5 mm)
with dimensions 31× 31× 0.5cm was prepared in a
marble mould with a wall thickness of 1 cm. The inside surfaces of the marble mould were ground with coarse grinding paper (grit-120) to increase the bond with the hardened cement paste. This specimen remained in the mould during the drying experiment and there-fore experienced a ‘substrate-restraint’ as opposed to the other specimens. This specimen was sealed cured for 7 days at 20◦C and dried in the environmental cabin
at 25.0± 0.5◦C and 30±3% relative humidity for a
period of 4 weeks.
2.2 Crack-pattern analysis
After 7 days drying, the specimens were impregnated with epoxy containing a fluorescent dye. The epoxy was pored over the drying surface and penetrated the cracks by capillary suction. Epoxy impregnation of cracked concrete is usually carried out in vacuum in order to create an under-pressure in the material and achieve a better permeation of the epoxy into the mater-ial. In this study, we did not apply a vacuum-impregnation, because the drying in vacuum could have caused additional cracking. It has been shown before that the penetration depth of epoxy in drying cracks in hardened cement paste is not much affected by the impregnation method—“passive” or under vacuum (Bisschop 2002). It is therefore likely that cracks in this study were impregnated to their very tips.
After hardening, the excess epoxy layer on de drying surface was carefully pealed off. Not only cracks, but also capillary pores close to the surface or cracks were impregnated with epoxy. In order to make the cracks stand out clearly, the porosity-impregnated top layer (<100µm) of the hardened cement paste was removed by coarse grinding using grit-120 grinding paper. The
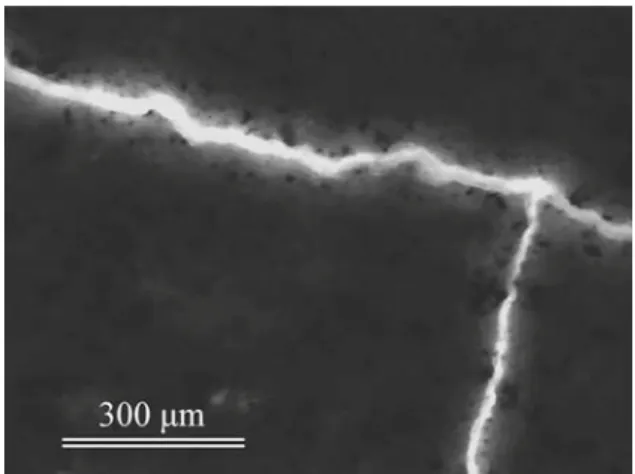
surface was finished by fine grinding with grit-1000 grinding paper. The crack widths varied from a few to 40 µm at the drying surface in all specimens, but
was most commonly between 10 and 30 µm (Fig.1). A
SEM study showed that microcracks as small as 1 µm are impregnated. However, such thin cracks may have depths smaller than 100 µm and therefore are removed by the surface grinding process. The measured crack depth distributions in all samples showed a clear peak
between 2 and 5 mm (Table2) and only very few cracks
approached the detection limit (depth of∼100µm) of
the method.
The crack-patterns were photographed in fluores-cent light with long exposure times using a 8 Mpix digital camera. Although the impregnated cracks show a good contrast (Figs.1,2) it was in general difficult to accurately identify the cracks using an automated image processing method. In this study, we therefore traced the cracks manually to obtain a binary image of the crack-patterns with one-pixel wide cracks. An exception is the crack-pattern in specimen TL-5 mm, that was be obtained by setting a simple grey-value threshold followed by skeletonization. The image res-olution decreased with increasing specimen size in this
study (Table1), and the crack roughness in smaller
specimens was therefore more accurately traced. All crack-patterns showed to a more or lesser degree cracks with a dead-end (e.g., Fig.2). These cracks were connected with a straight line to the nearest crack, when the gap size was smaller than 25% of the crack length from its base junction. Dead-end cracks that did not
Fig. 1 Epoxy-impregnated desiccation cracks in fluorescent
light under the optical microscope (8×8× 4cm specimen). The wider crack is 20–30 µm and the thinner is 10–15 µm
Fig. 2 Steps in crack-pattern acquisition. (a) Crack-pattern
impregnated with fluorescent epoxy imaged in fluorescent light (image width = 4.7 cm); (b) binary image of manually traced and
skeletonized crack-pattern (unconnected pattern); (c) connected crack-pattern
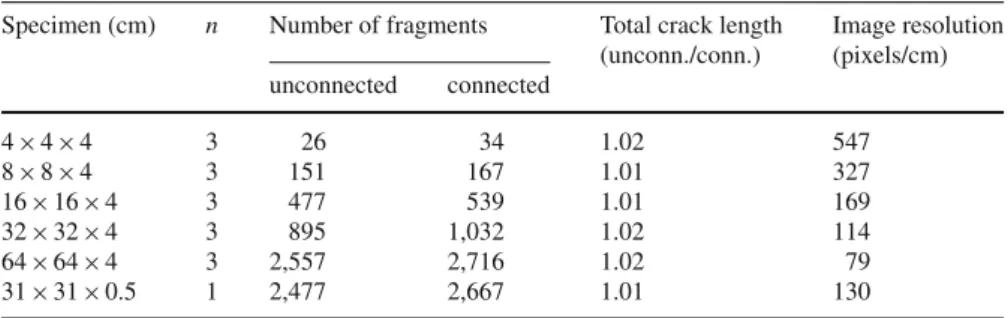
Table 1 Crack-pattern
processing data: connected versus unconnected crack-patterns (averages)
Specimen (cm) n Number of fragments Total crack length Image resolution (unconn./conn.) (pixels/cm) unconnected connected 4×4×4 3 26 34 1.02 547 8×8×4 3 151 167 1.01 327 16× 16×4 3 477 539 1.01 169 32× 32×4 3 895 1,032 1.02 114 64× 64×4 3 2,557 2,716 1.02 79 31× 31×0.5 1 2,477 2,667 1.01 130
obey this rule were deleted from the image. This image processing increased the average number of fragments by around 10% in the connected patterns, and lead to a small reduction of the total crack length (Table1). In this paper we analyze the fragment characteristics of the connected crack-patterns using the Matlab func-tion regionprops. Fragment area, fragment perimeter, fragment aspect ratio, the coordinates of the fragment mass center points, as well as the total fracture length were measured. In this paper fragment size is given as the equivalent fragment diameter for a circle with the same area of the fragment. The crack pattern non-uniformity was characterized by measuring the average fragment size in circular, 5.6 cm wide regions from the corner to the center of the specimen (see Fig.9).
After the analyses of the crack-patterns on the dry-ing surface, all specimens were cut into two parts along one of the specimen diagonals. The sections perpendic-ular to the drying surface were again photographed in fluorescent light. The cracks were manually traced to obtain a binary image of the crack-pattern. The sec-tion images were all re-sized to the same resolusec-tion
in order to keep the accuracy of crack roughness trac-ing equal in all specimens (200 pixels/cm). The crack length was calculated in Matlab as the length of a line going through the center points of crack pixels.
3 Results
3.1 Temperature evolution
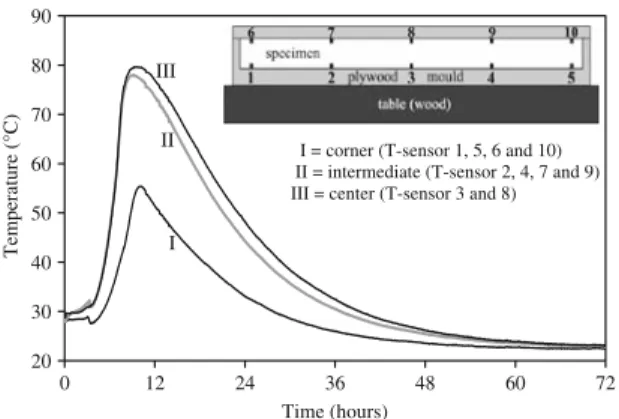
The temperature evolution of a 64× 64× 4cm cement
paste specimen is given in Fig.3. The measurements
started 20 min after adding water to the cement. Temperature differences measured between opposing thermocouples in the specimen bottom and top were generally small (up to a few degrees) and were pos-itive as well as negative. For simplicity the tempera-ture measurements by top and bottom sensors at equal
positions were averaged as shown in Fig.3. Mixing of
water and cement raised the initial temperature of the
cement paste from room temperature (22◦C) to about
20 30 40 50 60 70 80 0 12 24 36 48 60 7 Time (hours) Temperat u re (°C) I II III
I = corner (T-sensor 1, 5, 6 and 10) II = intermediate (T-sensor 2, 4, 7 and 9) III = center (T-sensor 3 and 8)
2 90
Fig. 3 Temperature evolution of a 64× 64 × 4 cm cement paste
specimen measured with 10 thermo-couples along the speci-men’s diagonal. The inset shows the thermal situation of the specimen in a plywood mould with plywood cover placed on a wooden table in a room of 22◦C. The inset image is compressed by 50% in the horizontal direction
the temperature to peak values of 80, 78 and 55◦C in
the specimen center, intermediate or corner regions, respectively. Setting (solidification) of cement paste typically occurs at an age of 5–10 h (Weiss 2003). After 3 days the specimen had cooled down to room temper-ature.
3.2 Drying rates
Drying of cementitious materials is a transient water evaporation and water vapour diffusion process. Spec-imen size is not expected to affect the drying rate when every spot on the drying surface is exposed to the same drying condition, and the specimens have equal thick-ness as in the present study. An indirect size effect may however be caused by the vibration applied to the fresh mixtures to remove air-bubbles. Specimen with different weights could respond differently on a vibra-tion table. Different degrees of compacvibra-tion will lead to differences in the effective water–cement ratios of the mixtures. No systematic effects of specimen size on the effective w/c-ratio or drying rate were observed
(Fig.4). The 4× 4× 4cm specimens were wet-cut and
ground from 4× 4× 16cm specimens and probably
absorbed some extra water that later resulted in a
rel-atively high drying rate. One of the 32× 32× 4
speci-mens (the first test-experiment) was also wet-ground to adjust thickness and for this reason probably showed a relatively high drying rate. This specimen was impreg-nated after 6 days drying. We recently showed that the
0.00 0.03 0.06 0.09 0.12 0 24 48 72 96 120 144 168
Drying time (hours)
cu m u lative moist u re loss ( g /cm 2 ) = 4x4cm (w/c-ratio = 0.44) = 8x8 cm (w/c-ratio = 0.44) = 16x16 cm (w/c-ratio = 0.44) = 32x32 cm (w/c-ratio = 0.45) = 64x64 cm (w/c-ratio = 0.43)
Fig. 4 Drying curves for hardened cement paste specimens
dry-ing at 20.0◦C and 30% RH. The two lines for the 4× 4×4cm specimens are averages of two series consisting of six and eight specimens. The calculated average effective w/c-ratio’s of the specimens are given in the legend
development of desiccation cracks does not have a sig-nificant (feedback) affect on the drying rate (Bisschop and Van Mier 2008).
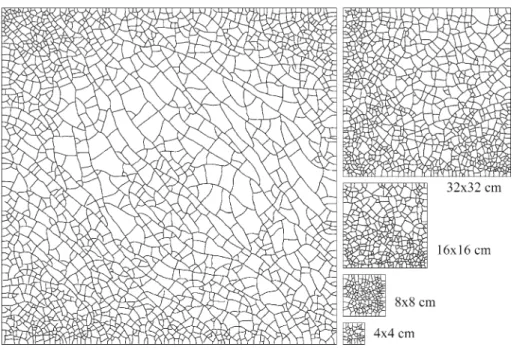
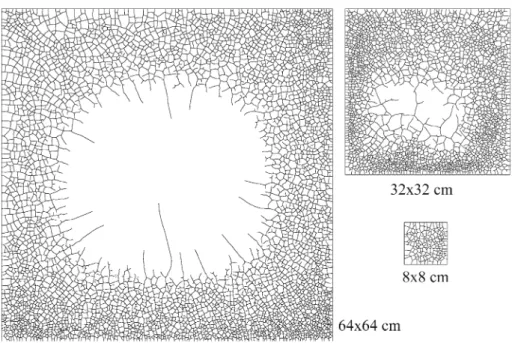
3.3 Size effect on 2D desiccation crack patterns An overview of the desiccation crack-patterns observed in specimen with different sizes is given in Fig.5. Des-iccation crack-patterns in equally sized specimens showed significant variation, especially the two largest
sizes of 32× 32× 4 and 64× 64× 4cm. There was
sig-nificant spatial variation in the crack-patterns of single specimens, and variation in the average crack density among equally sized specimens. On average, however, a clear effect of specimen size on the crack density
or average fragment size existed. Figure5 shows that
the smaller fragments are always found near the speci-men edges or in the corner regions. The larger frag-ments tend to concentrate, usually in centers of the
larger specimens (32× 32× 4 and 64× 64× 4cm), but
in the 16× 16× 4cm specimen the larger fragments occupied usually one half of the pattern. All speci-mens showed the same small edge effect of cracks per-pendicular to the specimen perimeter. In the smallest
specimens (4× 4× 4 and 8× 8× 4cm) the edge effect
was relatively large and caused the largest fragments to occur along the complete specimen perimeter. Two
of 64× 64× 4cm specimens showed a strong
orienta-tion of the long (first-generaorienta-tion) cracks parallel to the specimen diagonal (e.g., Fig.5); in the third 64× 64× 4
Fig. 5 Desiccation crack patterns in specimens from 4× 4× 4 to 64×64× 4cm (unconnected patterns)
Equivalent fragment diameter (cm) 0 10 20 30 40 50 0 1 2 3 4 = 16x16 cm (n=3) = 32x32 cm (n=3) = 64x64 cm (n=3) 0 10 20 30 40 50 0.0 0.5 1.0 1.5 2.0 Amo u nt ( % ) = TS5mm (n=1) = 4x4 cm (n=3) = 8x8 cm (n=3)
Fig. 6 Fragment size distributions (average of three specimens). The 32×32× 4 and 64× 64× 4cm specimens have, respectively, 0.8
and 0.4% fragments larger than 4 cm (bin size is 0.25 cm)
specimen first generation cracks formed a radial pattern (Fig.8).
The result of the Matlab analyses of the crack patterns are given in Figs.6,7and9. The fragment size
distributions of the 8× 8× 4cm is equal to the one of
specimen TL-5 mm (that will be described in Sect. 3.5) and both are approximately symmetrical around the mean. The mean crack spacing in these specimens is about 6 mm, which is not far from a lower bound
estimate of 3 mm made byBažant and Raftshol(1982).
The fragment size distribution of the 4× 4× 4cm
spec-imens is slightly skewed towards larger fragments, prob-ably because of the relatively large edge effect in this
specimen. In the larger specimens (16× 16× 4 to 64×
64× 4cm) the size distribution widens, and the mean
fragment size gradually shifts towards larger values. The effect of specimen size on the average fragment size and the crack density is shown in Fig.7: lower crack
0.0 0.5 1.0 1.5 2.0 0 10 20 30 40 50 60 70 specimen size (cm) 1/Eq. fra g ment diameter (cm -1) 0 1 2 3 4 crack densit y (cm/cm 2)
= 1/Eq. fragment diameter (connected) = crack density (unconnected)
Fig. 7 Size effect on two-dimensional desiccation cracking in
hardened cement paste. The average equivalent fragment diam-eter is calculated from the connected patterns. Crack density is the total cumulative length of the unconnected patterns divided by the specimen area. These data have been slightly shifted in the diagram to avoid overlap of the error bars. Error bars show the full range of variation, i.e., the maximum and minimum values of three specimens
densities for larger specimens. The smallest specimen is an exception to this trend, probably due to the rel-atively large edge effect in this specimen. The reason why the two different measures for crack density do not entirely overlap is probably caused by differences
in image resolution. As shown in Table1, the average
image resolution decreased with increasing specimen size, meaning that crack roughness in smaller speci-mens was more accurately traced. Although on a low magnification the cracks look rather straight (Fig.2), they are not at high magnification due to the hetero-geneous microstructure of the material (Fig.1). Thus, cracks traced on higher resolution images have a longer length. The crack density measured as the total crack pattern length divided by the specimen area is therefore sensitive to image resolution. The average equivalent fragment diameter calculated from the fragment area is unaffected by image resolution.
The crack patterns in some of the larger specimens were highly non-uniform. Two extreme examples in which the specimen centers had a very low or zero
crack density are shown in Fig.8. The non-uniformity
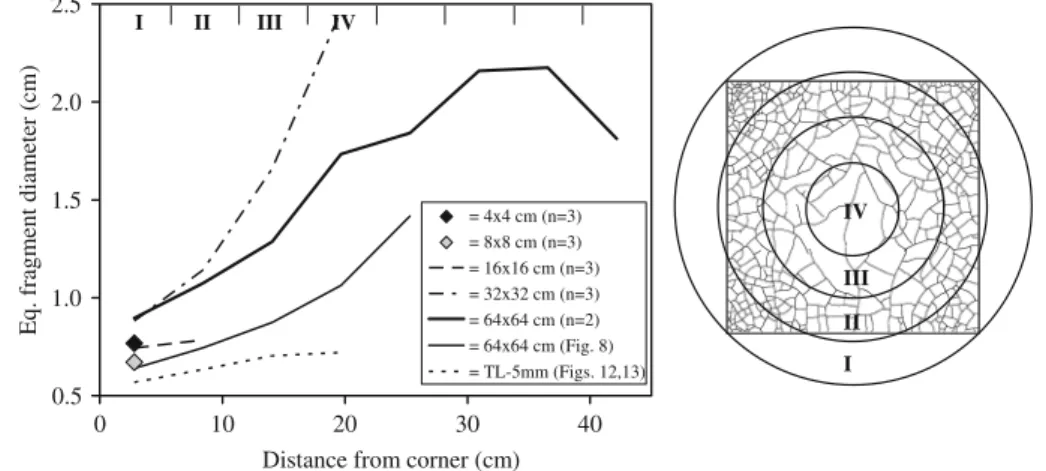
of the crack-patterns in all specimens is quantitatively
given in Fig.9. The average equivalent fragment size
was measured in 5.6 cm wide circular regions from the corner to the center of the specimen. A clear decreasing gradient in crack density exist in all larger specimens from the corner towards the center of the specimens. The smallest (4× 4× 4 and 8× 8× 4cm) specimens fall completely within a single circular region of 5.6 cm width, and therefore only have one data point each. The largest gradient exists in the 32× 32cm specimens: fragments in the specimen center are on average almost
Fig. 8 Highly non-uniform crack-patterns in a 32× 32×4 and a 64×64× 4cm specimen. A 8×8×4cm specimen is shown for
0.5 1.0 1.5 2.0 2.5 0 10 20 30 40
Distance from corner (cm)
Eq. fra g ment diameter (cm) = 4x4 cm (n=3) = 8x8 cm (n=3) = 16x16 cm (n=3) = 32x32 cm (n=3) = 64x64 cm (n=2) = 64x64 cm (Fig. 8) = TL-5mm (Figs. 12,13) I II III IV IV III II I
Fig. 9 Non-uniformity of 2D desiccation crack-patterns. The average equivalent fragment size was measured in 5.6 cm wide circular
regions from the corner to the center of the specimen as shown in the right image for a 32× 32cm specimen
a b c 10 cm
1 cm
Fig. 10 Desiccation cracks on stretched cross-section views of
specimens shown in Fig.5. (a) Section of 4× 4× 4cm specimen; (b) section of 16× 16×4cm specimen from lower left to upper
right corner in Fig.5; and (c) section of 64× 64×4cm specimen from upper right to lower left corner in Fig.5
three times larger than fragments in the specimen
cor-ner. The 64× 64× 4cm specimen shown in Fig.8 is
plotted separately and the large central fragment, with an equivalent diameter of 42 cm, was not included in the gradient analysis. In conclusion, larger specimen size meant more larger fragments in the specimen cen-ter, and as a result the average crack density decreased with increasing specimen size. The underlying reasons for this size effect will be discussed in Sect. 4.1. 3.4 Size effect on 3D desiccation cracking
The total area of fracture surface that forms by drying depends on the penetration depth of desiccation cracks. In order to determine the three-dimensional (3D) crack surface area, the impregnated specimens were cut into two parts along the diagonal axis and the crack lengths on one of the section surfaces were measured. The three
example sections shown in Fig.10are binary
(thresh-olded) images of colour-inverted photographs, and are vertically stretched for clarity. Many cracks are per-pendicular to the drying surface as generally can be
expected for desiccation cracks. However, a significant number of cracks curve away from a plane perpendic-ular to the drying surface. The average crack length
increased with specimen size (Fig.10 and Table2).
However, the crack density on specimen cross-sections decreased with increasing specimen size. The few cracks that had a depth smaller than 500 µm are the tips of dead-end cracks as seen on the drying surface.
The 3D crack density, i.e., the total crack surface
per cm3in the specimen top layer with a thickness of
1 cm, was calculated in two different ways. Quanti-tative stereology predicts that for desiccation cracks perpendicular to the drying surface, the proportional-ity constant between crack surface area per volume unit (in cm2/cm3) and crack length per section area
unit (in cm/cm2) is 1/2π (Underwood 1970;Bisschop
2002). One way to calculate the 3D-crack density was
therefore to multiply the section crack density by 1/2π (method A). The second way (method B) was to mul-tiply the crack density on the drying surface with the average crack length. The results of both types of calculations are plotted in Fig.11. The ratio between
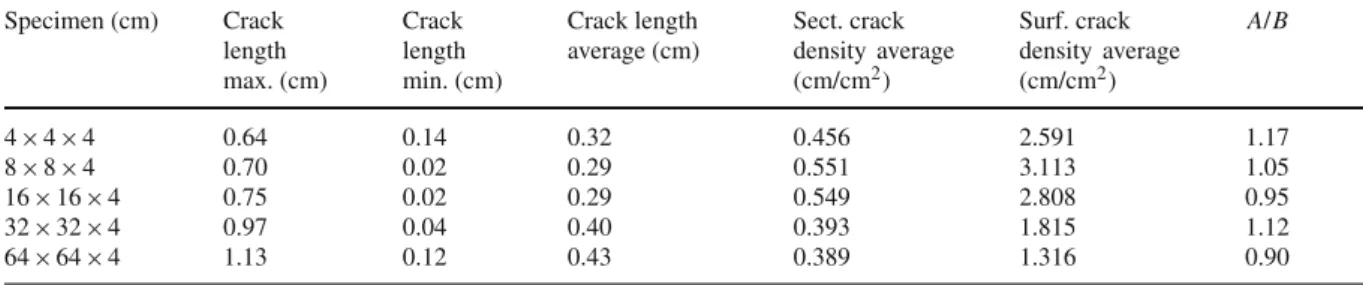
Table 2 Crack lengths and densities measured from specimen cross-sections. Crack densities on the drying surface (plotted in Fig. 7)
are given for comparison Specimen (cm) Crack length max. (cm) Crack length min. (cm) Crack length average (cm) Sect. crack density average (cm/cm2) Surf. crack density average (cm/cm2) A/B 4× 4×4 0.64 0.14 0.32 0.456 2.591 1.17 8× 8×4 0.70 0.02 0.29 0.551 3.113 1.05 16×16× 4 0.75 0.02 0.29 0.549 2.808 0.95 32×32× 4 0.97 0.04 0.40 0.393 1.815 1.12 64×64× 4 1.13 0.12 0.43 0.389 1.316 0.90
A=crack surface density (in cm2/cm3) calculated as: section crack density· 1/2π
B=crack surface density (in cm2/cm3) calculated as: surface crack density· average crack depth
0.0 0.4 0.8 1.2 0 10 20 30 40 50 60 70 Specimen size (cm) 3-D crack d ensity (cm 2 /cm 3 )
= A: section crack density • ½π
= B: surface crack density • av. crack depth
Fig. 11 Size effect on three-dimensional desiccation cracking
in hardened cement paste (see text for discussion). The B-data have been slightly shifted in the diagram to avoid overlap of the error bars. Error bars show the full range of variation, i.e., the maximum and minimum values of three specimens
these two measures (A/B) varied between 0.90 and 1.17
(Table2). Differences between the two measures A or
B are because: (i) method B is sensitive to the accu-racy of crack roughness tracing and thus to the average image resolution as given in Table1; and (ii) desicca-tion cracks were not always perpendicular to the drying surface and this affects the stereological proportional-ity constant, and thus method A. Figure11shows that a size effect on 3D desiccation cracking exist, but smaller
than the one shown in Fig.7for desiccation cracking
on the drying surface.
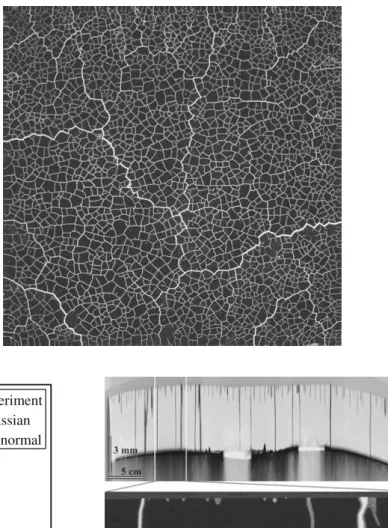
3.5 Desiccation cracking under substrate-restraint The effect of a restraining substrate on desiccation cracking in hardened cement paste was studied in a
specimen (TL-5 mm) with a thickness of 5.3 mm pre-pared on a rough marble substrate (Fig.12). This spec-imen showed two types of cracks (see Fig.14): (i) wide cracks with openings of in between 50 and 800 µm that extent all the way to the marble substrate; and (ii)
thin cracks with openings of much<50µm and a
lim-ited penetration depth of 0.1–2 mm. The mean size of fragments formed by the thin, shallow cracks in
TL-5 mm is equal to the 8× 8× 4cm ‘self-restraint’
speci-men (Fig.6) and this suggests that these thin cracks are also formed by self-restraint. From the angular rough-ness of the wide cracks that extend to the substrate, it can be concluded that the wide cracks grew from the thin, shallow cracks and thus formed later (Fig.12). The wider cracks form a kind of second-generation frag-ments due to the restraining effect of the substrate. The size of these large fragments will probably be much influenced by the bonding strength of the hardened cement paste with the substrate. We tried to increase the bond by coarse grinding the inside of the marble mould. However, large parts of the specimen ‘delami-nated’ from the substrate during the drying experiment as evidenced by a thin layer of epoxy between the spec-imen and substrate (Fig.14).
With the Matlab distribution fitting tool (dfittool) we found reasonable Gaussian and log-normal fits with a mean value of 0.64 cm to the experimental size
dis-tribution of all fragments (Fig.13). The
experimen-tal data are not symmetrically distributed around the mean, which could be a result of the edge effect and the non-uniformity of the crack pattern in TL-5 mm as shown in Fig.9. Another explanation is the hierarchical nature of the desiccation fragmentation. This is indi-cated by many 90◦/180◦ crack junctions (Bohn et al. 2005a; Toga and Erdem Alaca 2006) and an average fragment aspect ratio of 0.7. For hierarchical
fragmen-Fig. 12 Desiccation
cracking in specimen
TL-5 mm: impregnated
crack pattern on the drying surface (31× 31 cm)
0.0
0.5
1.0
1.5
2.0
2.5
0.0
0.5
1.0
1.5
Eq. fragment size (cm)
P
robability density f
u
nction (pdf)
experiment Gaussian log-normalFig. 13 Desiccation cracking in specimen TL-5 mm: fragment
size distributions with a bin size of 0.05 cm (n = 2,667 frag-ments)
tation a log-normal distribution for fracture lengths and
fragment sizes is expected in some cases (Iyer et al.
2008).
Fig. 14 Upper: stretched image of a cross-section from the upper
left to lower right corner in Fig.12(colour-inverted image). Num-ber of cracks to marble substrate is 16; numNum-ber of shallow cracks is 76. The sample buckled due to rewetting during grinding of the epoxy-impregnated surface and the substrate cracked. Lower: Cross-section image showing the variation in crack width and depth in the hardened cement paste layer. Note that the porous paste adjacent cracks is also impregnated with epoxy
4 Discussion
4.1 Size effect in self-restraint specimens
A significant size effect on desiccation cracking in free-shrinking specimen of hardened cement paste was
observed (Figs.7and11): the 2D and 3D crack
den-sity decreased with increasing specimen size, with the
exception of the smallest (4× 4× 4cm) specimen that
suffered a relatively strong edge effect. If we average the two measures for crack density we find that the
8× 8× 4cm specimens have a crack density of 2 and
1.5 times larger than the 64× 64× 4cm specimens for
2D and 3D desiccation cracking, respectively. What caused this size effect?
Desiccation crack patterns after 1 or 4 weeks dry-ing were studied, far before the specimens reached the ultimate state of drying. An important question to answers is if the studied crack-patterns are equal to the ones that occur in the ultimate state of drying? By
using the Acoustic Emission techniqueShiotani et al.
(2003) showed that desiccation crack-patterns in hard-ened cement paste specimens with a thickness of 40 mm developed within the first hour of drying. No signifi-cant acoustic activity was measured after the first hour in 12-day long drying experiments. By using a crack-impregnation technique it has also been shown that the section crack density and crack depths in such
speci-mens were similar after 1 and 150 days drying (
Biss-chop 2002). The only differences between those and the current experiments were the added water–cement ratio (0.45 instead of 0.5); the drying temperature (31 instead of 20◦C) and the lateral dimensions of the spec-imens. The desiccation crack-patterns described in this paper therefore are probably formed in the first hour or hours of drying. At the onset of drying, the moisture and shrinkage gradient is steepest and only goes down during further drying (Bisschop 2002). At later stages of drying, the 40-mm-thick specimens can cope with the shrinkage gradient by (elastic) warping and there is no reason why cracks should propagate any deeper.
The conclusion that is drawn from all the observa-tions, is that the larger specimens are not stress-free at the start of drying. The lower or even zero crack densities in the centers of these specimens are due to local compressive surface stresses. Larger compressive surface stress means that a larger region (fragment) needs to shrink in order to overcome the compression and reach the tensile strength of the material. Con-sidering the thermal history measured in the largest specimen (Fig.3), it seems likely that residual ther-mal stresses caused the size effect. Sther-mall specimens
(of e.g., 4× 4× 4cm) are expected to reach a much
lower peak temperature, even lower than in the corner regions of the largest specimen. Thus, lower residual stresses are expected in smaller specimens. Specimen TL-5 mm did probably also not reach a high peak temperature, because heat produced by cement hydration easily escaped from this thin specimen that was only ‘insulated’ by a 1-cm-thick marble mould
and a plastic sheet on the top surface. This explains the uniform crack-pattern with low fragment size in
TL-5 mm (Fig.9), presumably unaffected by residual thermal stresses.
It is difficult to give a full explanation of how the early age thermal evolution lead to compressive surface stresses in larger specimens. Various coupled thermo-mechanical processes probably played a role. Creep of cementitious materials is an important mechanism of stress relaxation and decreases with age (Neville et al.
1983). Residual thermal stresses are therefore more
likely to develop during cooling from the peak
tem-perature (80◦C in the largest specimen) to room
tem-perature, than in the period prior to reaching this peak temperature (when the material is solidifying). Gra-dients in peak temperature reached in the specimen’s radial (=horizontal) or axial (=vertical) directions, and subsequent non-uniform cooling may have led to the formation of residual stresses. A radial gradient in peak temperature means that the specimen core will con-tract more than the corner and boundary regions upon cooling. This would lead to a specimen core under ten-sile, rather than under compressive residual stresses. An axial gradient in peak temperature may lead to com-pressive surface stresses. However, this gradient was probably small considering the thickness and thermal situation of the specimen.
Another process that may have contributed to the formation of residual stresses is a restraining effect of the mould bottom on thermal shrinkage of the cooling specimen. The specimen top surface during the drying experiment, was the flat specimen bottom surface in the plywood mould. No grease was used in the exper-iments and plywood surface (coating) became some-what rough due to wetting, especially in the second and third experiments. During hardening, the cement paste therefore developed a bond with the mould walls. During cooling the specimens shrunk, but the friction between the specimen and the plywood bottom plate (substrate) provided a restraint. A stress gradient then existed from the restraint boundary into the specimen, in addition to the stresses created by non-uniform cool-ing of the specimen. Furthermore, stress-relaxation by creep of the material and strength development due to ongoing hydration will play a role in the mechan-ical evolution of the cooling specimen. These coupled mechanical processes make it hard to predict how resid-ual compressive surface stresses were formed. A thermo-mechanical (numerical) model of the
specimens, including creep and strength development, with and without boundary restraints provided by the mould, will give insight into the formation of residual thermal stresses in hardened cement paste and concrete.
Not only the desiccation crack density, but also the orientation of desiccation cracks is likely to be related
to residual thermal stresses. In two of 64× 64× 4cm
specimens a strong orientation of the long,
first-generation cracks was observed (Fig.5). In the third
64× 64× 4 specimen, first-generation cracks formed
a radial pattern (Fig.8). The direction of the principal residual stresses, may be related to how the specimen surface layers contract upon cooling, and how well and uniform the bond with the plywood mould developed. Another point we want to make is that residual com-pressive stresses must be balanced by residual tensile stresses in the specimen, and this may partly happen at the drying surface. Desiccation crack densities will probably be increased on a drying surface under
(resid-ual) tensile stress. Two large specimens (32× 32 and
64× 64× 4cm) with very low central cracks densities
have edge regions with very small fragment sizes, even
smaller than the fragments in the 8× 8× 4cm or
TL-5 mm specimens (Fig.8). This suggests that the sur-face was locally under residual tension near the edges in these specimens.
4.2 Self-restraint versus substrate restraint
Self-restraint is due to the development of a (steep) moisture and shrinkage gradient at the onset of drying and leads to the formation of tensile stresses at the dry-ing surface. In hardened cement paste and concrete this process is an important cause of desiccation cracking. Self-restraint should occur in any material that dries or cools non-uniformly by moisture or heat diffusion. Whether self-restraint leads to cracking will depend on the mechanical and transport properties of the material, the specimen thickness, as well as the drying or cooling rate. Experiments to study desiccation cracking in, for example, clay or other suspension mixtures are usually designed in such a way that substrate-restraint is the
dominant reason for stress-formation (e.g.,Groisman
and Kaplan 1994). How much self-restraint contributes to desiccation cracking in such experiments remains unknown. In hardened cement paste, the effects of self-restraint and substrate-self-restraint can be clearly
distin-guished as is shown in this paper. Substrate restraint has two effects on desiccation cracking in hardened cement paste. Firstly, a specimen fixed on a substrate can not deform (warp) freely upon the development of a shrink-age gradient. Desiccation cracking by self-restraint will therefore be enhanced by substrate-restraint. Secondly, when the drying front approaches the substrate, the sub-strate itself will cause additional desiccation cracking, i.e., cracks that penetrate all the way to the substrate. The spacing and width of substrate-restraint cracks will depend on the friction of the specimen with the sub-strate (Groisman and Kaplan 1994;Shorlin et al. 2000). In the extreme case, of a thin layer perfectly ‘glued’ to a stiff substrate, all self-restraint cracks may propagate to the substrate.
A number of (half-plane) models predict that the depth and spacing of desiccation cracks may double ones or more with the development of the moisture and
shrinkage gradient (Bažant and Raftshol 1982;Jagla
2002;Jenkins 2005). As a result, two or more peaks will be shown in the crack depth distribution of the final crack-pattern on a specimen cross-section. Such behaviour was not observed in the hardened cement paste specimens with a thickness of 4 cm. The undula-tions of the front formed by crack tips (Fig.10) can pos-sibly be explained by the presence of residual thermal stresses. The crack depth distribution of sample
TL-5 mm shows two peaks (Fig.14), but this is a result of cracks being formed by two different mechanisms: self-restraint (short cracks) and substrate-restraint (long cracks). Qualitatively this crack-pattern resembles those predicted byJenkins(2005).
Desiccation cracking undergoing substrate-restraint in, for example clay-like suspension mixtures, is typically hierarchical in thick specimens. The larger fragments bordered by the widest cracks form first, followed by a subdivision into smaller fragment with
ongoing drying (Corte and Higashi 1964;Bohn et al.
2005a,b;Mal et al. 2007). Desiccation crack-pattern in hardened cement paste by self-restraint is also hierar-chical as indicated by many 90◦/180◦crack junctions (Figs.1,2,5) variation in crack opening (Fig.1) and crack length, and the average fragment aspect ratio of around 0.7. When hardened cement paste undergoes substrate-restraint the pattern formed by the widest cracks may not appear to be hierarchical. This is, because these cracks are extensions of self-restraint cracks and thus form later and have an angular rough-ness (Fig.12).
5 Conclusions
– Self-restraint, stress formation due to the develop-ment of a (steep) moisture and shrinkage gradient at the onset of drying, is an important mechanism for desiccation cracking in hardened cement paste and concrete. The average depth of self-restraint desiccation cracks in this study was around 10% of the specimen thickness. When hardened cement paste specimens are fixed to a stiff substrate, des-iccation cracks by ‘substrate-restraint’ will form. These cracks are extensions of self-restraint cracks and therefore have an angular roughness.
– Specimen size has an effect on desiccation crack density in hardened cement paste. The crack density
on the drying surface of small specimens (8× 8×
4 cm) was twice larger than the surface crack
den-sity in the largest specimen (64× 64× 4cm). A size
effect on 3-dimensional crack density existed, but was smaller. We explain this size effect by higher residual thermal stresses in larger specimens due to the cement hydration process, and therefore is likely to be specific to cementitious materials. – The uniformity of the desiccation crack-pattern
decreased with increasing specimen size and so did the symmetry of the fragment size distribution around the mean. The most uniform desiccation crack pattern, with a fragment size distribution in between Gaussian and log-normal, formed in the specimen least affected by residual thermal stresses.
Acknowledgements The author thanks H. Richner for his assistance in the laboratory and J.G.M. van Mier, J. Mächler, P. Lura, R. Loser and F. Wittel for useful discussions.
References
Bažant ZP, Raftshol WJ (1982) Effect of cracking in drying and shrinkage specimens. Cem Concr Res 12:209–226 Bisschop J (2002) Drying shrinkage microcracking in
cement-based materials. PhD Thesis, Delft University of Tech-nology, Delft University Press, The Netherlands (ISBN 90-407-2341-9)
Bisschop J, Van Mier JGM (2008) Effect of aggregates and microcracks on the drying rate of cementitious composites. Cem Con Res 38:1190–1196
Bohn S, Pauchard L, Couder Y (2005a) Hierarchical crack pat-tern as formed by successive domain divisions. I. Temporal and geometrical hierarchy. Phys Rev E 71:046214
Bohn S, Platkiewicz J, Andreotti B, Adda-bedia M, Couder Y (2005b) Hierarchical crack pattern as formed by succes-sive domain divisions. II. From disordered to deterministic behavior. Phys Rev E 71:046215
Bolander JE, Berton S (2004) Simulation of shrinkage induced cracking in cement composite overlays. Cem Concr Com-pos 26:861–871
Chertkov VY (2002) Modelling cracking stages of saturated soils as they dry and shrink. Eur J Soil Sc 53:105–118 Colina H, Acker P (2000) Drying cracks: kinematics and scale
laws. Mater Struct 33:101–107
Corte A, Higashi A (1964) Experimental research on desicca-tion cracks in soil. US Army material command, CRREL research report 66, 76 pp
Groisman A, Kaplan E (1994) An experimental study of crack-ing induced by desiccation. Europhys Lett 25:415–420 Hansen W (1987) Drying shrinkage mechanisms in Portland
cement paste. J Am Ceram Soc 70:323–28
Hong AP, Li YN, Bazant ZP (1997) Theory of crack spacing in concrete pavements. J Eng Mech 123:267–275
Ismail M, Toumi A, François R, Gagné R (2008) Effect of crack opening on the local diffusion of chloride in cracked mortar samples. Cem Concr Res 38:1106–1111
Iyer K, Jamtveit B, Mathiesen J, Malthe-Sørenssen A, Feder J (2008) Reaction-assisted hierarchical fracturing during serpentinization. Earth Planet Sci Lett 267:503–516 Jagla EA (2002) Stable propagation of an ordered array of cracks
during directional drying. Phys Rev E 65:046147 Jenkins DR (2005) Optimal spacing and penetration of cracks in
a shrinking slab. Phys Rev E 71:056117
Kitsunezaki S (1999) Fracture patterns induced by desiccation in a thin layer. Phys Rev E 60:6449–6464
Kjellsen KO, Jennings HM (1996) Observations of microcrack-ing in cement paste upon drymicrocrack-ing and rewettmicrocrack-ing by envi-ronmental scanning electron microscopy. Adv Cem Based Mater 3:14–19
Leung K, Néda Z (2000) Pattern formation and selection in qua-sistatic fracture. Phys Rev Lett 85:662–665
Li YN, Hong AP, Bazant ZP (1995) Initiation of parallel cracks from surface of elastic half-plane. Int J Fract 69:357–369 Mal D, Sinha S, Dutta T, Mitra S, Tarafdar S (2007) Formation
of crack patterns in clay films: desiccation and relaxation. J Phys Soc Jpn 76:014801
Neville AM, Dilger WH, Brooks JJ (1983) Creep of plain and structural concrete. Construction Press, London, 361 pp Northcott GDS (1992) Concrete pavements. In: Geoff Mays
(ed) Durability of concrete structures—investigation, repair, protection. E & FN Spon, London, pp 226–247
Shiotani T, Bisschop J, Van Mier JGM (2003) Temporal and spa-tial development of drying shrinkage cracking in cement-based materials. Eng Fract Mech 70:1509–1525
Shorlin KA, de Bruyn JR, Graham M, Morris SW (2000) Development and geometry of isotropic and direc-tional shrinkage-crack patterns. Phys Rev E 61:6950–6957 Toga KB, Erdem Alaca B (2006) Junction formation during
des-iccation cracking. Phys Rev E 74:021405
Underwood EE (1970) Quantitative stereology. Addison-Wesley Publishing Company, Reading, MA, 274 pp
Weiss J (2003) Experimental determination of the Time Zero. In: Bentur A (ed) Early age cracking in cementitious systems. RILEM TC181-EAS report 25, pp 195–206
Yang W, Weiss WJ, Shah SP (2002) Predicting shrinkage stress field in concrete slab on elastic subgrade. J Eng Mech 126:35–41