Factors affecting the size of the detour effect in the kinaesthetic perception of Euclidean distance
12
0
0
Texte intégral
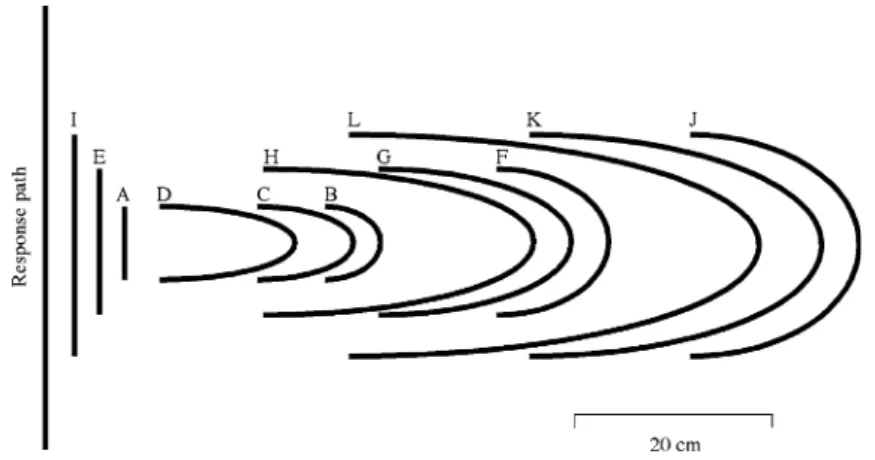
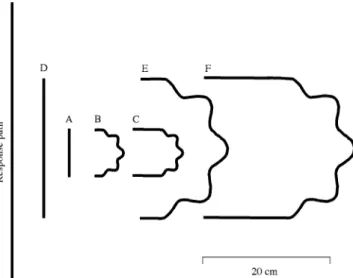
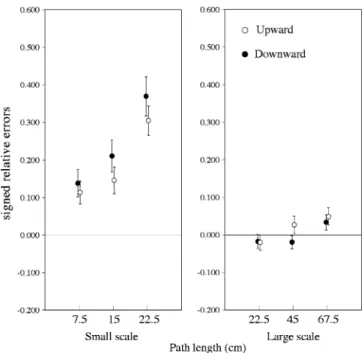
Figure
+4
Documents relatifs
