Anal Bioanal Chem (2006) 386: 12–20 DOI 10.1007/s00216-006-0658-0
O R I G I N A L PA P E R
Jorge Pisonero . Ivana Kroslakova . Detlef Günther . Christopher Latkoczy
Laser ablation inductively coupled plasma mass spectrometry
for direct analysis of the spatial distribution of trace elements
in metallurgical-grade silicon
Received: 4 May 2006 / Revised: 21 June 2006 / Accepted: 27 June 2006 / Published online: 12 August 2006
# Springer-Verlag 2006
Abstract The spatial distribution and concentration of impurities in metallurgical-grade silicon (MG-Si) samples (97–99% w/w Si) were investigated by use of laser ablation inductively coupled plasma mass spectrometry (LA-ICP-MS). The spatial resolution (120 μm) and low limits of detection (mg kg−1) for quality assurance of such materials were studied in detail. The volume-dependent precision and accuracy of non-matrix-matched calibration for quantification of minor elements, using NIST SRM 610 (silicate standard), indicates that LA-ICP-MS is well suited to rapid process control of such materials. Quantitative results from LA-ICP-MS were compared with previously reported literature data obtained by use of ICP-OES and rf-GD-OES. In particular, the distribution of element impurities and their relationship to their different segrega-tion coefficients in silicon is demonstrated.
Keywords Metallurgical-grade silicon .
Elemental segregation . Quantification . LA-ICP-MS
Introduction
In recent decades silicon has become one of the most important materials in industrial applications. Raw silicon of metallurgical-grade (MG-Si) is mainly used in the steel, aluminium and chemical industries [1]. Ferrosilicon alloys are used to improve the strength and quality of iron and steel products. Silicon-aluminium alloys have good casting and welding properties, although they have relatively low strength and ductility. Other metals, especially magnesium
and copper, are, therefore, often added to improve strength. In the chemicals industry, silicon metal is the starting point for production of silanes, silicones, fumed silica, and semiconductor-grade silicon. In particular, it must be mentioned that silicon-based solar cells are fabricated with solar grade silicon (SoG-Si) which is obtained from refined and purified MG-Si [2]. These solar cells currently account for almost 90% of the global market in the photovoltaic industry, which has been growing at a steady annual rate of 30% in recent years [3,4].
Silicon is the second most abundant element in the Earth’s crust and is typically found in the oxidized form (quartz sand) in nature. To obtain MG-Si (97–99% w/w Si), it has to be reduced with carbon in an electrical arc furnace. During solidification of the MG-Si from this carbothermic process, impurities with low segregation coefficients and concentrations exceeding the solid solubility concentrate, mainly along the grain boundaries of the resulting crystal-line material [1]. Segregation coefficients are defined as the ratio of the concentration of impurity atoms in the growing crystal to that in the melt in thermodynamic equilibrium. Thus, elements with different segregation coefficients are expected to have a different spatial distribution in the bulk material.
The quality and applicability of MG-Si and SoG-Si is determined by the concentration of element impurities and by their spatial distribution in the bulk material [3]. A variety of analytical techniques have been tested for quality control in the production of these materials [5]. For example, in the raw silicon industry most routine analysis to determine the chemical composition (minor and trace elements) of MG-Si is performed by inductively coupled plasma mass spectrometry (ICP-MS) or inductively coupled plasma optical emission spectroscopy (ICP-OES). The silicon samples must therefore be dissolved by use of a digestion method using hydrofluoric acid [6]. The risk of contamination, because of the presence of impurities from the reagents and from surface contami-nants, is high and, furthermore, this procedure is very time-consuming and limited for rapid process control. In addition, the spatial distribution of impurities is not directly
Dedicated to Professor Klaus G. Heumann
J. Pisonero . I. Kroslakova . D. Günther . C. Latkoczy (*) Laboratory of Inorganic Chemistry, ETH Zurich,
8093 Zurich, Switzerland
accessible. Another approach is the use of glow discharge mass spectrometry (GD-MS) or glow discharge optical emission spectroscopy (GD- OES) for direct solid analysis of the MG-Si samples [7]. For these techniques, sample preparation is “simple” and the risk of contamination is low. Relative sensitivity is almost uniform for all elements, and low limits of detection can be achieved (mg kg−1or ng g−1by use of OES or MS, respectively). One of their major advantages is access to light elements, for example carbon, nitrogen and oxygen, which are difficult to measure at low concentrations (sub mg kg−1 level) by other techniques. These techniques are limited in their spatial resolution (typically 4 mm), however. In addition to the techniques described above, secondary ion mass spectrometry (SIMS), with low limits of detection (<ng g−1) and high spatial resolution (0.5–1 μm) has also been used for analysis of semiconductors [5]. The sensitivity varies over 4–5 orders of magnitude from one element to another, however, and is matrix-dependent [8], so even semi-quantitative analysis is difficult to achieve when only non-matrix-matched calibration stan-dards are available. Although silicon implanted with several elements (B, P, As) is available as standard reference materials for SIMS depth profiling analysis (e.g. Charles Evans Analytical Group, Sunnyvale, CA, USA), there is still a lack of multi-element SRMs. It should also be mentioned that another highly used standard analytical tool for determining the surface contamination of silicon wafers in the semi-conductor industry is total-reflection X-ray fluorescence (TXRF), but again with limited spatial resolution of, typically, 10 mm [9]. SIMS is, nevertheless, the method of choice for sensitive surface, lateral, and in-depth analysis of semiconductors and other materials [10]. The advantages and disadvantages of commonly used techniques suggest that LA-ICP-MS should be a suitable technique, because it enables direct quantitative ele-mental analysis of a wide variety of sample matrices with a spatial resolution of a few μm and a depth resolution of tens of nm [11–13]. It is, therefore, possible to study the spatial distribution of the different elements within different samples at the micrometer scale. Further advantages of LA-ICP-MS are low limits of detection (<mg kg−1), a sampling process independent of sample thickness and electrical conductivity, and high sample throughput. In general, quantitative analysis by LA-ICP-MS results in better accuracy and precision when using a calibration sample with a matrix similar to that of the sample under analysis. Different calibration strategies are, moreover, currently being investigated to enable multi-matrix calibrations with adequate accuracy using UV-fs-LA-ICP-MS [14]. Amongst a variety of different other calibration strategies, including the use of liquid calibrations and “on-line” isotope-dilution tech-niques [5, 15–20], the use of silicate reference materials as calibration standards has proved in the past to be a feasible means of quantification of a variety of different matrices, mainly oxides [21,22]. Because of the lack of appropriate metallic multi-element standards, oxide
samples are used as calibration samples for quantitative analysis of metals. This non-matrix matched calibration is limited by the different particle formation of oxides and metals and, related, their incomplete vaporization of the aerosol in the ICP [23]. When using laser systems with ns pulse widths, element fractionation and phase separation might also limit accurate quantitative deter-minations [24]. The applicability of the NIST SRM glass series to quantitative analysis of metallic silicon samples has not yet been reported. Quantification of minor and trace elements in MG-Si samples by use of direct-solid mass spectrometry or optical emission spectroscopy has always been limited by the lack of appropriate calibra-tion materials. In this work, the use of NIST SRM 610 (silicate sample) as external calibration material for quantitative analysis of MG-Si, using Si as internal standard element, was studied. This reference material with a nominal trace element concentration range of approximately 400 mg kg−1was chosen because of the expected large variations in the trace element content of the MG-Si samples. The LA-ICP-MS results were compared with those previously reported for ICP-OES (liquid-analysis technique) and radiofrequency (rf)-GD-OES (direct solid-analysis technique) [7].
Experimental
Instrumentation
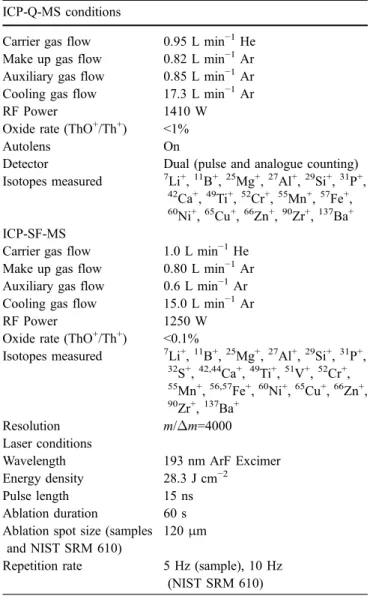
Laser sampling was performed with an Excimer laser (ArF) with 15-ns pulse duration and wavelength 193 nm (GeoLas M, MicroLas, Goettingen, Germany) and a spot diameter of 120 μm. The laser-induced aerosol was transported from the sample chamber (ablation cell) to the ICP by using helium as carrier gas. Before entering the ICP, the aerosol was mixed with Ar make-up gas. Two different types of ICP-MS instrumentation, one equipped with a quadrupole mass filter for ion-separation (Elan 6100 DRC+, Perkin Elmer Sciex, Canada) the other with a sector field-based mass spectrometer (Element 2, Thermo Finnigan, Bremen, Germany), enabling measurement of elements at a higher mass resolution (m/Δm=4000), were used to acquire transient ion signals. Before analysis, both instruments were optimized for the highest signal-to-noise ratio and the lowest oxide formation [25]. Detailed operating conditions of the laser and ICP-MS instruments are listed in Table 1.
Standard reference materials and samples
A standard reference material (NIST SRM 610) containing multi-element trace impurities with a nominal concentra-tion of approximately 400 mg kg−1was used for quanti-tative analysis of the MG-Si samples, because of the lack of silicon reference materials containing known concentra-tions of element impurities. As already mentioned, this
standard was chosen because the trace element content of the silicon samples was expected to fluctuate within a wide dynamic range. The reference values used for NIST SRM 610 were taken from Gao et al. [26]. Two MG-Si samples were provided by Ferroatlantica I + D (La Coruña, Spain) for the analysis. Sample A was taken directly after reducing the oxide SiO2 (quartz sand) in an electrical arc furnace
with carbon as reducing agent and sufficient energy to achieve the high temperatures necessary (∼2000 °C). Under these conditions, the reaction SiO2+2C→Si+2CO
occurs. The main impurities in this sample are aluminium, calcium, and iron at levels of thousands of mg kg−1, titanium at levels of hundreds of mg kg−1, and significant traces of boron and phosphorus, among other impurities (<100 mg kg−1) [1]. Sample B was taken after passing an oxygen flow through sample A. This procedure reduces the concentration of aluminium and calcium but, because of the oxidation process, the final concentration of other elements, for example iron and titanium are expected to be slightly higher. Both samples have previously been
analyzed by ICP-OES and rf-GD-OES and the results reported [7] were compared with results from LA-ICP-MS analysis.
Results and discussion
Element distribution of impurities in MG-Si
To study the distribution of the impurity elements, multi-element temporal profiles (dependence of ion signal on ablation time) were acquired for different MG-Si sample positions by use of LA-ICP-Q-MS and LA-ICP-SF-MS (where “Q” and “SF” denote “quadrupole” and “sector-field”, respectively). The heterogeneity of the MG-Si sample depends on the grain size (from less than 200μm to more than 2 cm), because the less soluble elements mainly concentrate at the borders of the grains. Use of GD-OES or GD-MS, with a lateral resolution of typically 4 mm, would not enable determination of element distribution at the scale of the Si grains. In particular, for medium-sized Si grains (250–500 μm) scale, we found that LA analysis at 120 μm resolution resulted in an adequate analytical performance for these samples; this is important for complete characterization of the heterogeneity of such samples.
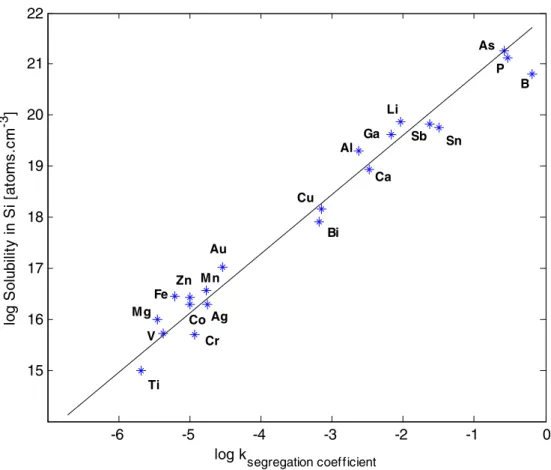
Previous studies on silicon samples have revealed a direct correlation between the segregation coefficient of elements and their solid solubility [27]. This correlation (correlation coefficient, r2=0.972) is illustrated in Fig.1. It has been observed that elements with the highest segrega-tion coefficients (between 0.1 and 1), for example B and P, dissolve in Si at concentrations up to 1021atoms cm−3[27]. It is possible to measure concentrations of B and P as high as several mg kg−1homogeneously distributed within the silicon grains during the crystal growth. In contrast, elements with low (<10−5) segregation coefficients, for example Cr, V and Ti could only be dissolved in Si with concentrations up to 1015–1016 atoms cm−3. Concentra-tions of these elements above a few mg kg−1are therefore expected to form clusters easily (enriched concentration areas) mainly along the grain boundaries of the resulting crystalline material. Elements with segregation coefficients between the two cases discussed would form clusters whenever their concentrations in the MG-Si are above their solid solubility.
The lateral resolution achievable by LA-ICP-MS, defined by the laser spot dimensions on the surface of a sample, can be used to evaluate the spatial distribution of different elements in MG-Si. The ion-signal intensities in LA-ICP-MS are also linearly dependent on the volume of material ablated from the sample. A compromise should therefore be established between sensitivity and lateral resolution. This was studied and a laser spot with a diameter of 120μm was finally selected to ensure lateral resolution of the element distribution of impurities in MG-Si and to ensure sufficient sensitivity for quantitative analysis.
Table 1 Conditions used for LA-ICP-MS analysis ICP-Q-MS conditions
Carrier gas flow 0.95 L min−1He Make up gas flow 0.82 L min−1Ar Auxiliary gas flow 0.85 L min−1Ar Cooling gas flow 17.3 L min−1Ar
RF Power 1410 W
Oxide rate (ThO+/Th+) <1%
Autolens On
Detector Dual (pulse and analogue counting) Isotopes measured 7Li+,11B+,25Mg+,27Al+,29Si+,31P+, 42 Ca+,49Ti+,52Cr+,55Mn+,57Fe+, 60 Ni+,65Cu+,66Zn+,90Zr+,137Ba+ ICP-SF-MS
Carrier gas flow 1.0 L min−1He Make up gas flow 0.80 L min−1Ar Auxiliary gas flow 0.6 L min−1Ar Cooling gas flow 15.0 L min−1Ar
RF Power 1250 W
Oxide rate (ThO+/Th+) <0.1%
Isotopes measured 7Li+,11B+,25Mg+,27Al+,29Si+,31P+, 32S+,42,44Ca+,49Ti+,51V+,52Cr+, 55 Mn+,56,57Fe+,60Ni+,65Cu+,66Zn+, 90 Zr+,137Ba+ Resolution m/Δm=4000 Laser conditions
Wavelength 193 nm ArF Excimer
Energy density 28.3 J cm−2
Pulse length 15 ns
Ablation duration 60 s Ablation spot size (samples
and NIST SRM 610)
120μm
Repetition rate 5 Hz (sample), 10 Hz (NIST SRM 610)
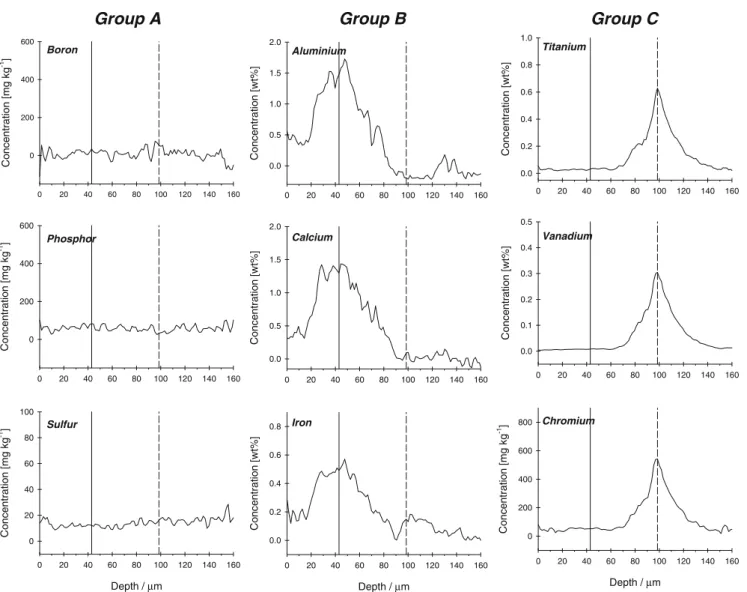
As an example from five individual sampling positions, Fig. 2 shows quantitative depth profiles for selected elements (B, Al, P, S, Ca, Ti, V, Cr, and Fe) measured in a single hole-drilling analysis by LA-ICP-SF-MS. A typical analysis consisted of 60 s ablation of the material after 30 s gas background acquisition and further quantification by use of an external reference material together with internal standardization (explained in detail in the next section) [28]. It was observed that the ion-signal intensities such as those of 11B+,31P+, or 32S+(group A) were constant over time, indicating non-heterogeneous distribution of these elements in the depth of the material. In contrast, ion-signal intensities of the other elements selected were observed to give peaks of maximum intensity at different times. Thus, considering the rate of ablation of MG-Si under these operating conditions (∼2.5 μm s−1 corresponding to ∼500 nm per laser shot) [29], it can be concluded that micro-regions (<100 μm) with enriched concentrations of these elements occur at different depths. These elements can, moreover, be divided in two groups (B and C) according to the different time (depth) positions of the maximum intensities (enriched concentration areas). Figure2shows the signals for all three different groups of elements (A, B, and C), using dashed and solid lines to mark the positions of the maximum concentrations for group B (Al, Ca and Fe) and for group C (Ti, V and Cr), respectively. It was also observed that the elements of each group have similar solid solubility, indicating that elements with different segregation coefficients form clusters at different depths in the MG-Si samples. In particular, the
elements of group B are those with the lowest solid solubility in MG-Si (<1016 atoms cm−3). To ensure the different locations of the peak maxima were not caused by spectral skew effects, the dwell times for all the elements were reduced to minimum values, without affecting the results [30]. Spectral skew effects could be neglected, because the duration of the peaks was much longer than the individual spikes.
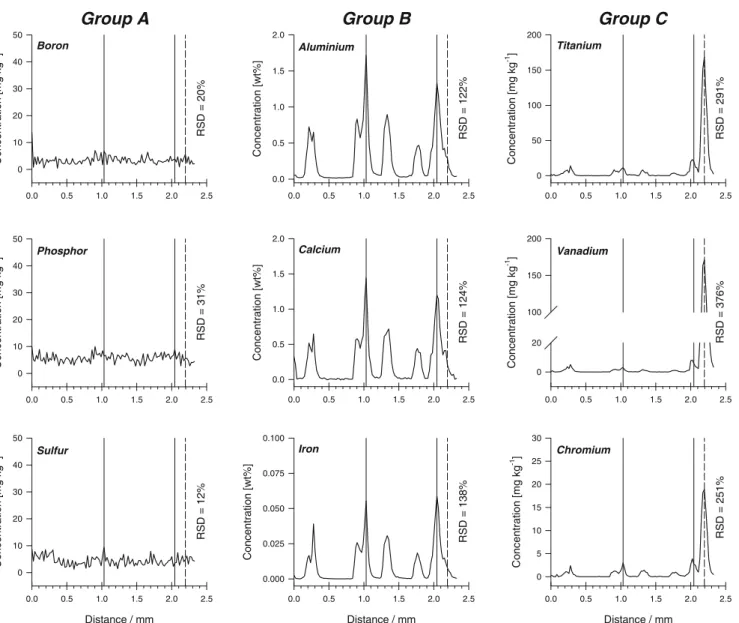
To evaluate the lateral distribution of impurities in MG-Si samples, ion-signal intensities were also acquired in a scanning laser mode (line scans) over distances of 2.5 mm at a speed of 10μm s−1. Using this sampling approach, ion-signal intensities of elements from group A (11B+,31P+, or
32S+) remained stable within signal fluctuations over the
entire line scan of the order of 12–31%. This is again in agreement with the high solid solubility or high segregation coefficients of these elements. In contrast, ion-signal intensities of groups B and C (27Al+,42Ca+, 49Ti+, 51V+,
52Cr+or56Fe+) fluctuated over several orders of magnitude
in short distances (∼100 μm), indicating heterogeneous lateral distribution of these elements on the micrometer scale. To discriminate possible fluctuations because of sampling, transport, and plasma fluctuations, the ion signals were normalized to silicon as the major element of the sample (internal standardization). Figure 3 shows variation of the amounts of the elements, measured by LA-ICP-SF-MS, at different lateral ablation distances, and the calculated relative standard deviations (RSD) for the individual signals over the whole line scan. It is apparent that elements from groups B and C give peaks of maximum
-6 -5 -4 -3 -2 -1 0 15 16 17 18 19 20 21 22 log k segregation coefficient lo g S o lu b ilit y in S i [ a to m s .c m -3 ] Ti Al Ga Li Sb Sn B P Cr As V Ca Cu Bi Mn Au Mg Fe Ag Co Zn Fig. 1 Correlation (correlation
coefficient r2=0.972) between element segregation coefficients and solid solubility in silicon [27]
intensity (regions of enriched concentration) at different lateral positions indicated by the solid and dashed lines, respectively. The elements with the lowest solid solubility (Ti, V, and Cr) were heterogeneously distributed in the MG-Si sample, because they were concentrated only in a small region (∼100 μm) along the total line-scan distance (2.5 mm). For elements with greater solid solubility in MG-Si, however (Al, Ca, and Fe), a layered distribution with more peak maxima (enriched areas) was observed. The intensities observed implied, however, that they were not as concentrated as the elements with the lowest solid solubility. This heterogeneous distribution of the elements could not be detected in the qualitative depth profiles of MG-Si samples obtained by use of rf-GD-OES [7]. Because the surface of the sample was sputtered from a circular area with a diameter of 4 mm (low lateral resolution), hetero-geneous distribution at the micrometer scale could not be observed, because the ion signals represent the average concentration of impurities from the entire sputtered area. The amount of material sputtered per unit time (5μg s−1) in
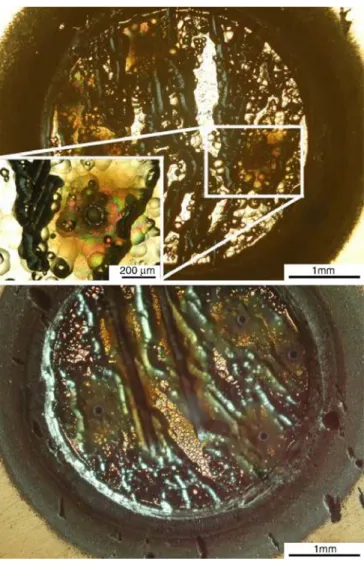
GD was, moreover, approximately three orders of magnitude larger than the amount of ablated material in LA. Figure 4 shows an optical microscopy image of a GD-sputtered crater in MG-Si, illustrating the silicon grain structure of the MG-Si, the dimensions of the laser ablation spot, and the laser line scans.
Quantitative analysis of metallurgical grade silicon samples with LA-ICP-MS
In addition to distribution analysis of minor elements within MG-Si samples, quantification of elements was also performed. In the first experiments a quadrupole-based ICP-MS was used, because of its routine, mature, and high-throughput performance requested by industry for rapid process analysis. Elements like P, S, Ca, and Fe can, however, be severely affected by polyatomic interferences from the silicon matrix itself (Table 2). To overcome spectral overlap, dynamic-reaction-cell or collision-cell
0 20 40 60 80 100 120 140 160 C onc entr ation [mg k g -1] 0 200 400 600 0 20 40 60 80 100 120 140 160 C onc entr ati on [m g k g -1] 0 200 400 600 Depth / µ m 0 20 40 60 80 100 120 140 160 C onc entration [mg kg -1] 0 20 40 60 80 100 Sulfur Boron Phosphor Group A 0 20 40 60 80 100 120 140 160 C onc entr a ti on [w t%] 0.0 0.5 1.0 1.5 2.0 0 20 40 60 80 100 120 140 160 C onc entr ati on [w t%] 0.0 0.5 1.0 1.5 2.0 Depth / µ m 0 20 40 60 80 100 120 140 160 C onc entr ati on [w t%] 0.0 0.2 0.4 0.6 0.8 Calcium Iron 0 20 40 60 80 100 120 140 160 C onc entr ati on [w t%] 0.0 0.2 0.4 0.6 0.8 1.0 0 20 40 60 80 100 120 140 160 C onc entr ation [w t%] 0.0 0.1 0.2 0.3 0.4 0.5 Depth / µ m 0 20 40 60 80 100 120 140 160 C o ncentr ation [mg k g -1 ] 0 200 400 600 800 Chromium Vanadium Titanium Group B Group C Aluminium
Fig. 2 Quantitative multi-element depth profiles for sample A measured by LA-ICP-SF-MS in single-hole-drilling mode with medium mass-resolution (m/Δm=4000). Solid lines show peak
maxima for the elements of group B and dashed lines show peak maxima for the elements of group C
quadrupole instruments have been studied and successfully used [31–34]. These methods were, nevertheless, not explored, because chemical resolution can lead to some loss in the multi-element capability and to the formation of new interferences. An ICP-MS instrument equipped with a double-focusing sector-field mass spectrometer was there-fore used in a second step to identify possible interferences. Because the elements mentioned above were only present at very low concentrations in the samples investigated, the greater sensitivity provided by these instruments is also beneficial. In addition, the high-mass resolution mode enables access to the high-abundance isotopes of these elements, which leads to improved limits of detection [35]. When the mass resolution needed to resolve main spectral interferences occurring in a silicon matrix sample was checked (Table 2), it was, moreover, calculated that the medium mass resolution (m/Δm=4000) mode of
ICP-SF-MS instruments is sufficient to resolve such poly-atomic interferences.
Quantification of analytical data measured by LA-ICP-Q-MS
Samples were quantitatively analyzed by using external reference material NIST SRM 610, which is well defined in terms of the concentrations and spatial distribution of major, minor, and trace elements [26, 36–40]. Correc-tions for drift, plasma instability, and ablation yield were applied by using silicon as internal reference element. Measured data were treated according to the procedure described by Longerich et al. [28]. Quantification results from LA-ICP-MS and the concentrations previously reported after use of ICP-OES and rf-GD-OES [7] are summarized in Tables 3 and 4. Quantification in
ICP-Distance / mm 0.0 0.5 1.0 1.5 2.0 2.5 C onc entr ation [mg k g -1] 0 10 20 30 40 50 RS D = 1 2 % Sulfur 0.0 0.5 1.0 1.5 2.0 2.5 C onc entr ation [m g kg -1] 0 10 20 30 40 50 RSD = 20% Boron 0.0 0.5 1.0 1.5 2.0 2.5 C onc entr ation [m g kg -1] 0 10 20 30 40 50 RSD = 31% Phosphor
Group A
Distance / mm 0.0 0.5 1.0 1.5 2.0 2.5 C onc entr ation [mg k g -1] 0 5 10 15 20 25 30 Chromium R S D = 251% 0.0 0.5 1.0 1.5 2.0 2.5 Concentr ation [mg k g -1] 0 20 100 150 200 RSD = 376% Vanadium 0.0 0.5 1.0 1.5 2.0 2.5 C onc entr ation [m g kg -1] 0 50 100 150 200 RS D = 29 1 % Titanium 0.0 0.5 1.0 1.5 2.0 2.5 Conc entr ation [wt%] 0.0 0.5 1.0 1.5 2.0 RSD = 124% Calcium Distance / mm 0.0 0.5 1.0 1.5 2.0 2.5 Concentr ati on [w t%] 0.000 0.025 0.050 0.075 0.100 RS D = 1 3 8% Iron 0.0 0.5 1.0 1.5 2.0 2.5 C onc entr ation [wt%] 0.0 0.5 1.0 1.5 2.0 RS D = 12 2 % AluminiumGroup B
Group C
Fig. 3 Quantitative multi-element lateral profiles for sample A measured by LA-ICP-SF-MS in line-scan mode with medium mass resolution (m/Δm=4000). Solid lines show peak maxima for the
elements of group B and dashed lines show the peak maxima for the elements of group C. Signal variation is expressed as the relative standard deviation calculated for each line scan
OES was based on external multi-element calibration after wet digestion of the sample, whereas the rf-GD-OES quantification was based on external calibration using multi-matrix solid samples used to calculate the emission yield for each element. It is apparent that average concentrations of the minor elements (Al, Ca, and Fe) in sample A are within 20–30% of the values reported by Menendez et al. [7]. The relative standard deviation is very high, however (approximately 50%). These high RSD mostly reflect the heterogeneous
distribution of these elements in the sample, as a result of the segregation coefficients for Al, Ca, and Fe in silicon already discussed above (Figs. 2 and 3). In contrast, the opposite behaviour is observed for the elements boron and phosphorus, which are very soluble in silicon. Even if they are present at trace level concentrations (lower signal intensities), measurement precision is better than 10% for B and 20% for P. This again indicates that the main cause of the high standard deviation is sample heterogeneity and not instrument precision. As already mentioned, sample B is a product of a process of cleaning of sample A by passing oxygen through the sample. As shown in Table 4, the concen-tration of some elements (Al, Ca, Li, Mg, and Ba) was dramatically reduced (by up to an order of magnitude, e.g. Ca) after this cleaning step. In contrast, the concentrations of elements such as Fe, Ti, Mn, Ni, and Cu were found to be higher, probably because of oxidation processes.
At this point it should be mentioned that to obtain quantitative results more in agreement with those from the bulk analysis techniques discussed above, different laser ablation strategies, for example surface mapping (array of line scans) or larger spot sizes must be used. The principal objective of this work was, however, to show that LA-ICP-MS could be used to furnish more information about the local distribution of elements in the MG-Si samples, rather than precise bulk concentrations. The element concentra-tions in Tables 3 and 4 (averages from five individual single-spot analyses and line scans, respectively, with their standard deviations) were presented to show that a silicate reference material can be used to quantify elements within in a silicon matrix and to give a correct estimate of the concentration range as previously reported after use of bulk techniques such as ICP-OES and GD-OES, even when LA-ICP-MS is used in single-hole-drilling mode only, or with a single line scan, respectively.
Quantification of analytical data measured by LA-ICP-SF-MS
To quantify the elements accurately and to check the results obtained from LA-ICP-Q-MS, measurements were per-formed with an ICP-SF-MS in medium mass-resolution mode (m/Δm=4000) to avoid any of the possible spectral interferences mentioned above (Table 2). Because laser-ablation data are acquired in transient data mode, all isotopes had to be measured within a single resolution mode, because switching between different mass-resolu-tion modes can be only achieved by changing the posimass-resolu-tion of the entrance slit, which takes approximately 2 s, which is too long for time-resolved analysis.
Two different laser modes (single-hole drilling and single-line scans) were used to compare the effect of total analyzed mass on the precision and accuracy of the quantitative results. Even if the amount of mass analyzed by single-line scans (∼15 μg) is approximately ten times higher than that for single-hole drilling mode (∼1.5 μg), Fig. 4 Optical microscopy images of the glow-discharge crater
made in metallurgical-grade silicon and magnification of the laser ablation crater (left corner) and laser-line scans (below)
Table 2 Possible interferences occurring in a silicon matrix Nuclide Interfering ions Abundance m/Δm
31P+ 15N16O+ 0.37 1458 1 H14N16O+ 99.38 967 32S+ 16O16O+ 99.52 1802 42 Ca+ 28Si14N+ 91.89 1964 44 Ca+ 28Si16O+ 92.01 2688 56 Fe+ 28Si28Si+ 85.06 2957 40 Ar16O+ 99.36 2504
the precision of the quantitative results was not signifi-cantly better than that of the ICP-OES and rf-GD-OES results. This implies that the results obtained by use of the two different modes clearly reflect the local distribution of the elements Al, Ca, Fe, Ti, V, and Cr in the samples, which is the major reason for the high standard deviations found for these elements. The results obtained by LA-ICP-Q-MS and ICP-SF-MS overlapped within the standard deviation calculated for five individual measurements. This proved that when the optimized instrumental analysis conditions are used determination of the elements (except S and V) is not hindered by spectral interferences and that use of LA-ICP-Q-MS is adequate for analysis of such samples. In future projects, the analysis of silicon samples containing elements at even lower concentrations will be an important
issue. The suitability of LA-ICP-SF-MS for measurement of these elements on their high-abundant isotopes, without spectral overlap, becomes an argument for changing to sector-field-based or dynamic reaction cell-based quadru-pole instruments.
One consequence of the different dimensions of the areas analyzed (different masses analyzed) is that the precision (expressed as the RSD) of bulk analytical results obtained by use of ICP-OES after wet digestion (1 g sample) and by rf-GD-OES (sputtered mass∼1.5 mg) must be significantly better that for LA-ICP-MS (ablated mass ∼1.5 μg for single-hole drilling and ∼15 μg for line scans). Even the tenfold increase in the analyzed mass when changing from single hole drilling to line scan does not significantly improve the precision of the results,
empha-Table 4 Quantitative results obtained for sample B by use of LA-ICP-MS, with NIST SRM 610 as external reference material, and by use of other analytical techniques (all values in mg kg−1)
a
Below detection limit
b
Not measured
Element LA-ICP-Q-MS LA-ICP-SF-MS ICP-OES [7] rf-GD-OES [7] Single hole Single hole Line scan
Al 1850±100 1400±200 1900±350 1060±50 1050±110 Ca 103±30 42±4 120±80 28±1 23±3 Fe 2050±250 1800±360 2600±1300 2200±100 2210±170 Ti 114±29 150±17 220±20 230±12 224±24 B 26±1 27±5 38±2 32±1 34±2 Li NDa ND ND Mg 5±2 ND 8±5 P 30±4 39±7 56±4 Cr 44±21 24±7 36±8 Mn 62±14 33±5 45±15 Ni 23±5 11±11 44±2 Cu 31±12 19±12 31±1 Zn 1±0.5 2±1 5±3 Zr 4±1 1±1 9±1 Ba ND ND ND V NAb 52±9 126±11 S NA 128±5 142±11
Table 3 Quantitative results obtained for sample A by use of LA-ICP-MS, with NIST SRM 610 as external reference material, and by use of other analytical techniques (all values in mg kg−1)
a
Not measured
Element LA-ICP-Q-MS LA-ICP-SF-MS ICP-OES [7] rf-GD-OES [7] Single hole Single hole Line scan
Al 4700±2300 4000±1700 5200±2300 3400±300 3500±200 Ca 4050±2050 3050±1300 4700±2200 3300±40 3350±150 Fe 1050±500 1200±500 1400±850 1750±200 1700±150 Ti 70±40 50±1 110±70 170±20 170±15 B 25±2 20±9 40±4 30±1 32±1 Li 8±2 15±3 20±4 Mg 13±4 17±2 18±8 P 30±6 50±9 40±4 Cr 24±12 22±14 20±14 Mn 26±9 42±32 21±12 Ni 10±5 14±6 27±13 Cu 8±3 20±10 9±3 Zn 1.0±0.5 6±5 4±3 Zr 3±1 2±1 5±3 Ba 11±5 8±3 17±10 V NAa 31±25 80±55 S NA 114±6 150±25
sizing that these measurement modes can only be used to estimate the bulk concentration of the elements in such heterogeneous samples. In contrast, the average concentra-tions for both samples are higher when measured in line-scan mode than with single-spot analysis. The different analysis depths of approximately 150 μm for single-spot analysis and approximately 30μm for line scan mode gives a first indication of possible surface contamination problems or oxidation processes for these silicon samples, which are currently the subject of further investigations.
Conclusions
The polycrystalline structure of MG-Si with grain sizes of several hundreds of micrometers and the different segregation coefficients of the impurity elements are responsible for the highly heterogeneous distribution of elements in these samples at the micrometer scale. These theoretical considerations have been fully supported by LA-ICP-MS data acquired with high spatial and depth resolution. It has been shown that elements with low segregation coefficients form regions within the material hundreds of micrometers across whereas elements highly soluble in the silicon samples are homogeneously dis-tributed throughout the samples. To obtain the bulk concentration of elements in such samples by LA-ICP-MS, either larger laser spot sizes or surface mapping techniques must be used. Because the properties of the sample are strongly affected by the local distribution of trace elements and, therefore, knowledge of the accurate bulk concentration might not be the only information required, LA-ICP-MS still adds valuable information for characterization of such heterogeneous materials. Concen-trations of elements (e.g. P and S) below the detection limits of other direct techniques for analysis of solids can, moreover, be measured by use of LA-ICP-MS.
Acknowledgements The authors wish to thank A. Miranda from Ferroatlantica I + D (La Coruña, Spain) and A. Menéndez from the University of Oviedo (Oviedo, Spain) for technical support. Financial support from a Marie Curie Intra-European Fellowship (FP6-2004-Mobility 5) and from ETH Zurich and the Swiss National Science Foundation are gratefully acknowledged.
In contrast with some opinions (personal communication with Klaus Heumann, Johannes Gutenberg-University of Mainz, Germany), laser ablation ICP-MS has, in recent years, become a quantitative technique for solid analysis. Convincing arguments, diverse thinking, and fundamental research have, however, always been abundant in his scientific career. The authors would, in addition, like to acknowledge the significant contribution of Klaus Heumann to Atomic Spectros-copy; this has resulted in many ideas and procedures followed throughout this study.
References
1. Dietl J (1983) Sol Cells 10:145–154
2. Yuge N, Abe M, Hanazawa K, Baba H, Nakamura N, Kato Y, Sakaguchi Y, Hiwasa S, Aratani F (2001) Prog Pholtavoltaics 9:203–209
3. Buonassisi T, Istratov AA, Marcus MA, Lai B, Cai ZH, Heald SM, Weber ER (2005) Nat Mater 4:676–679
4. Kazmerski LL (2006) J Electron Spectrosc 150:105–135 5. Becker JS, Dietze HJ (2003) Int J Mass Spectrom 228:127–150 6. Yu LL, Fassett JD, Lindstrom AP (2003) J Anal At Spectrom
18:738–741
7. Menendez A, Bordel N, Pereiro R, Sanz-Medel A (2005) J Anal At Spectrom 20:233–235
8. Hagenhoff B (2000) Mikrochim Acta 132:259–271
9. Potts PJ, Ellis AT, Kregsamer P, Marshall J, Streli C, West M, Wobrauschek P (2004) J Anal At Spectrom 19:1397–1419 10. Fearn S, McPhail DS (2005) Appl Surf Sci 252:893–904 11. Durrant SF (1999) J Anal At Spectrom 14:1385–1403 12. Günther D, Jackson SE, Longerich HP (1999) Spectrochim
Acta B 54:381–409
13. Günther D, Hattendorf B (2005) Trends Anal Chem 24:255–265 14. Koch J, Wälle M, Pisonero J, Günther D (2006) J Anal At
Spectrom Advanced Article
15. Günther D, Frischknecht R, Muschenborn HJ, Heinrich CA (1997) Fresenius J Anal Chem 359:390–393
16. Günther D, Cousin H, Magyar B, Leopold I (1997) J Anal At Spectrom 12:165–170
17. Tibi M, Heumann KG (2003) J Anal At Spectrom 18:1076–1081 18. Boulyga SF, Pickhardt C, Becker JS (2004) At Spectrosc
25:53–63
19. Pickhardt C, Izmer AV, Zoriy MV, Schaumloffel D, Becker JS (2006) Int J Mass Spectrom 248:136–141
20. O’Connor CJ, Sharp BL, Evans P (2006) J Anal At Spectrom 21:556–565
21. Iizuka T, Hirata T (2004) Geochem J 38:229–241
22. Bernal JP, Eggins SM, Mcculloch MT (2005) J Anal At Spectrom 20:1240–1249
23. Kuhn HR, Guillong M, Günther D (2004) Anal Bioanal Chem 378:1069–1074
24. Kuhn HR, Günther D (2003) Anal Chem 75:747–753 25. Wang Z, Günther D (2004) ICP Inf Newsl 30:1042–1046 26. Gao S, Liu XM, Yuan HG, Hattendorf B, Günther D, Chen L,
Hu SH (2003) Geochim Cosmochim Acta 67:A116 27. Fischler S (1962) J Appl Phys 33:1615
28. Longerich HP, Jackson SE, Günther D (1996) J Anal At Spectrom 11:899–904
29. Horn I, Guillong M, Günther D (2001) Appl Surf Sci 182:91–102 30. Pettke T, Heinrich CA, Ciocan AC, Günther D (2000) J Anal At
Spectrom 15:1149–1155
31. Hattendorf B, Günther D (2000) J Anal At Spectrom 15: 1125–1131
32. Bandura DR, Baranov VI, Tanner SD (2001) Fresenius J Anal Chem 370:454–470
33. Moens LJ, Vanhaecke FF, Bandura DR, Baranov VI, Tanner SD (2001) J Anal At Spectrom 16:991–994
34. Tanner SD, Baranov VI, Bandura DR (2002) Spectrochim Acta B 57:1361–1452
35. Latkoczy C, Günther D (2002) J Anal At Spectrom 17: 1264–1270
36. Pearce NJG, Perkins WT, Westgate JA, Gorton MP, Jackson SE, Neal CR, Chenery SP (1997) Geostand Newsl 21:115–144 37. Rocholl ABE, Simon K, Jochum KP, Bruhn F, Gehann R, Kramar U, Luecke W, Molzahn M, Pernicka E, Seufert M, Spettel B, Stummeier J (1997) Geostand Newsl 21:101–114 38. Rocholl A, Dulski P, Raczek I (2000) Geostand Newsl 24:
261–274
39. Eggins SM, Shelley JMG (2002) Geostand Newsl 26:269–286 40. Kempenaers L, Janssens K, Jochum KP, Vincze L, Vekemans B, Somogyi A, Drakopoulos M, Adams F (2003) J Anal At Spectrom 18:350–357