Computational Design of Interfaces: Mitigating He
Damage in Nuclear Fusion Applications
by
Dina V Yuryev
Submitted to the Department of Materials Science and Engineering
in partial fulfillment of the requirements for the degree of
Doctor of Philosophy in Materials Science and Engineering
at the
MASSACHUSETTS INSTITUTE OF TECHNOLOGY
February 2017
Massachusetts Institute of Technology 2017. All rights reserved.
A uthor ...
Certified by...
Signature redacted
Department of Materials S ence
d Engineering
December 1, 2016
Signature redacted
Michael J. Demkowicz
Associate Professor
Thesis Supervisor
Signature redacted
Accepted by...
Chairman,
MASSACHUSTTS "INSTITUTE OF TECHNOLOGYFEB 2
2017
I... ...Donald Sadoway
Department Committee on Graduate Theses
Computational Design of Interfaces: Mitigating He Damage in
Nuclear Fusion Applications
by
Dina V Yuryev
Submitted to the Department of Materials Science and Engineering on December 1, 2016, in partial fulfillment of the
requirements for the degree of
Doctor of Philosophy in Materials Science and Engineering
Abstract
In order for nuclear fusion to be a feasible source of energy, materials must be developed that are resistant to the damaging byproducts of a fusion reaction. One of these byproducts is He, that is implanted into the plasma facing wall of the reactor. Once implanted, it causes irreparable damage due to it's insolubility in the material: the He cannot escape in a non-destructive manner. In this thesis, an interface in a layered metal nanocomposite is designed to have desirable precipitation properties, specifically that He precipitates will link up to form stable, continuous pathways. Once in these channels, the He may still migrate within the channels themselves. Thus, channels that terminate at free surfaces may enable controlled He removal via outgassing, thereby averting He-induced damage. In this thesis, computational methods are developed for identifying promising interfaces that give rise to He channels and for modeling He network behaviors at these interfaces. These models are then applied to materials systems of interest to determine if elongated precipitates arise. Finally, experimental results are presented that support computational predictions that Cu-V interfaces result in linear helium channels.
Thesis Supervisor: Michael J. Demkowicz Title: Associate Professor
Acknowledgments
I would like to thank my advisor, Professor Michael J. Demkowicz, for his guidance over
the duration of my graduate students. I am grateful for the high scientific and commu-nication standards he set for me, and owe much of my development as a researcher and presenter to him.
I would also like to thank my committee, Professor Christopher Schuh and Professor
Kenneth Kamrin for their support and guidance. Their questions and suggestions were insightful and allowed me step out from the narrow view with which I considered my project.
I would like to thank my collaborators at Los Alamos National Laboratory: Dr. Di
Chen, Dr. Nan Li, Kevin Baldwin, and especially Dr. Yongqiang Wang who was my advisor during a 4 month fellowships at LANL. Their experimental work helped strengthen my thesis work and it was a pleasure to work with them both at the lab and remotely.
I would like to acknowledge my funding sources: the LDRD Program at Los Alamos
National Labs and the SCGSR Program through the DOE Office of Science through which
I received my lab fellowship. I would also like to acknowledge my computing resources:
the High Performance Computing Center at Idaho National Labs as well as the High Per-formance Computing Resources at Texas A&M.
I feel privileged to have worked alongside my colleagues in the Demkowicz group.
Specifically, I would like to thank Sanket Navale and Raghav Aggarwal for their willing-ness to discuss and share their work and help me with mine. I would also like to thank the
MOOSE developers who who have helped me with my code development and
implemen-tation. Namely I would like to thank Derek Gaston who were always willing to meet with me to troubleshoot.
Friends I have made along the way have made my experience at MIT enjoyable and
I couldn't have done it without them. Thank you to all my friends both at MIT and out,
who have made the grad school process possible: Alex, Michelle, Ian, Brent, Corentin,
Christelle, Arianne, and my boyfriend Billy. A special thanks to Billy for his help in
Finally, I'd like to thank my parents and grandparents for their unwavering love and support in all my endeavorers.
Contents
1 Introduction
1.1 M otivation . . . . 1.2 Overview of Interfaces . . . . 1.2.1 Classification of Interfaces . . . . 1.2.2 Quantitative Interface Structure Models . . . .
1.2.3 Effect of semicoherent interface structure on properties . . 1.2.4 Growth mode of He precipitates at semicoherent interfaces
1.3 Thesis overview . . . .
2 Calculating MDI distributions with 0-lattice Theory
2.1 Introduction . . . . 2.2 O-lattice calculation for FCCIIBCC interface . . . .
2.3 Applying design criteria to l,,, and l . . . . .. 2.4 R esults . . . . 2.5 Applying FCC/BCC 0-lattice calculation to HCP/BCC interfaces
2.6 Comparison to experimental results . . . . 2.7 O-lattice summary . . . . 19 . . . . . 19 . . . 20 . . . 21 . . . 23 . . . . . 27 . . . . . 30 . . . . . 33 35 . . . . . 35 . . . . . 35 . . . 38 . . . 42 . . . . . 44 . . . . . 46 . . . 48
3 Developing a phase field model for simulating He precipitates on heteroge-neous energy interfaces 51 3.1 Introduction . . . . 51
3.2 Modeling Assumptions . . . . 52
3.4 Application to a model problem . . . . 62
3.5 Phase-field model discussion . . . . 66
4 Applying a phase-field model to He precipitation at a Cu-V interface 71 4.1 Introduction . . . . 71
4.2 He wetting of a single Cu-V interface . . . . 71
4.2.1 Simulation set up for a single Cu-V interface . . . . 71
4.2.2 Results and analysis: He precipitate formation at a single Cu-V interface . . . . 75
4.3 He wetting of adjacent Cu-V interfaces . . . . 81
4.3.1 Simulation set up for two adjacent interfaces . . . . 81
4.4 Results and analysis: He precipitate formation at two adjacent Cu-V inter-faces . . . . 85
4.5 Comparison to experimental results . . . . 85
4.6 High performance computing troubleshooting . . . . 88
4.7 Discussion of Cu-V results . . . . 90
5 Applying a phase-field model to He precipitation on high energy wetting rib-bons at the interface 93 5.1 Introduction . . . . 93
5.2 Simulation set up of wetting ribbons . . . . 94
5.3 Results of wetting ribbon simulations . . . 97
5.4 Discussion of wetting ribbon results . . . 108
6 Conclusion 111
List of Figures
1-1 Edge-on (top) and In-plane (bottom) views of a) coherent, b) semicoher-ent, and c) incoherent GBs in a-Fe. The atoms are colored according to coordination number. . . . . 22
1-2 1l and I I* are favored boundaries. A E17 boundary can be described to
be made up of repeating units made up of E 1 and 1* structures[ I]. . . . . 24 1-3 a) Burgers circuit that encloses a vector -' that lies within the interface b)
Burgers circuit redrawn in the reference configuration with closure failure. . 26
1-4 a) He precipitates in single crystal Au. b) Plane view of a 1 V twist GB in
Au. He precipitates (bright dots) decorate the nodes of the GB dislocation network. c) Monte Carlo simulation of He precipitates at a - 20 twist GB
in C u [2]. . . . . 3 1
2-1 The distribution of MDIs (black dots) desired in our design: closely spaced along ^ and far apart along fn ( fLp). He bubbles precipitating on MDIs are expected to link up and form continuous linear channels along ^ as illus-trated by the dotted contours. O-lattice theory gives translation vectors of the MDI lattice, ii and iV. From these, Gaussian lattice reduction determines the shortest and second shortest MDI basis vectors d' and v. . . . . 37
2-2 Contour plots of 1,,, and 1_ over the design space, in units of ajcc, described
by 0 and p. The design objectives call for 1,mi, values that fall into lighter
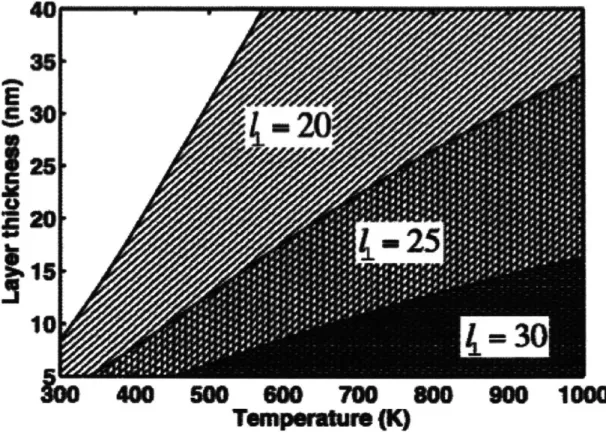
2-3 Envelopes of layer thickness and temperature where fbid <
fa
<10-2 for three values of 1_: 20, 25, and 30. Changes in l alter the temperatures and layer thicknesses where fbid <fgi4
< 10-2. We impose l in our design, restricting the temperature and layer thickness to the darkest cross-hatched envelope shown above. . . . . 432-4 The solution space for our design problem is the intersection of envelopes satisfying the restriction on l,,i, imposed by design criterion 1 (black ing) as well as the restriction on l imposed by criteria 2 and 3 (red hatch-ing). The vertical line at 0;~ 5.260 denotes interfaces synthesized by PVD. Ovals highlight the intersection of the solution space with this line. From the element pairs that fall into this subspace, we select Cu-V due to rel-atively low materials cost for validation. The horizontal yellow lines de-pict possible tungsten containing composites that satisfy the design criteria. However, these composites (Ni-W, Cu-W, and Ir-W) cannot be synthesized
with PVD methods. . . . . 45
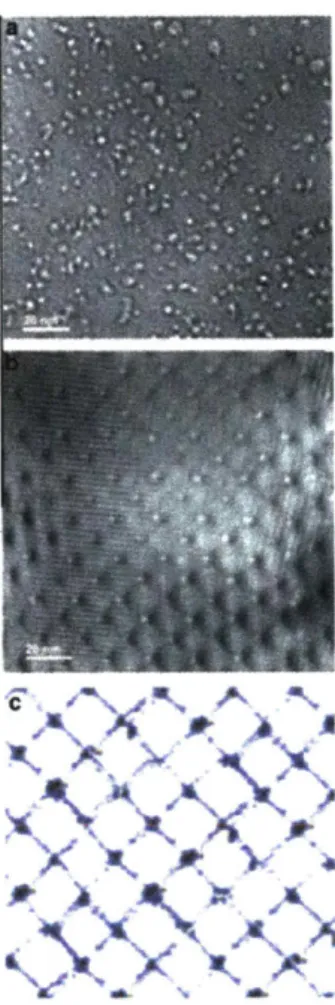
2-5 a) Planeview TEM image of He bubbles aligned on MDIs in a Cu-V K-S oriented interface. The yellow dashed box highlights the area where these He distributions are present b) The magnified image of the yellow dashed box in a). Red lines mark the aligned MDIs. The rows have an average spacing of approximately 8nm and the average spacing between bubbles is approximately 2nm. This agrees with the calculated MDI spacings from O-lattice theory of 1,,i, = 6.4 and l = 23.3. . . . . 50
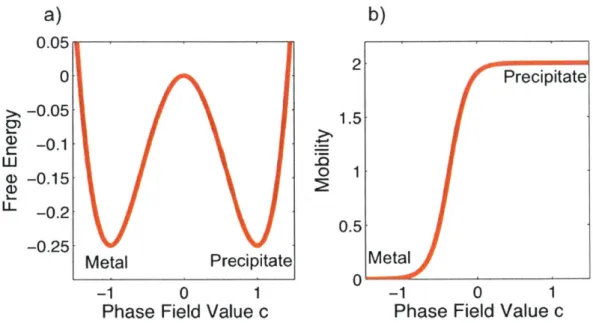
3-1 a) The free energy of the two-phase system described by our model. Min-ima occur at c = -1 (the pure metal phase) and c = 1 (the helium precipitate phase). b) The order parameter-dependent mobility is high in the precipi-tate and at the precipiprecipi-tate/metal interface. It is low in the metal phase . . . . 54
3-2 a) No wetting occurs when W, the excess interface wetting energy, is less than 0. b) Wetting does occur when W is greater than 0. The arrows in-dicate the directions of interface tensions used to derive Youngs relation in Equation 3.5. YAB is the location-dependent energy of the interface between elements A and B, YAHe is the interface energy between helium and element
A, into which the helium precipitates grow, and YBHe is the interface energy between helium and element B. . . . . 58
3-3 A cross section through a hemispherical precipitate wetting an interface.
Blue and red represent metal and precipitate phases in equilibrium, respec-tively. a) Initial state with precipitate volume Vi. b) The order parameter value inside the precipitate is increased to c = 4. The color change of the precipitate indicates the precipitate phase is no longer in equilibrium. c) After relaxation, the precipitate grows from its initial volume, Vi, to Vf = 2.51V, and the phase field value inside it returns to equilibrium. . . . . 61
3-4 a) The simulation cell for the model problem described in section 3.4. The red circles are wetting regions while the surrounding interface area is non-wetting. b) Initial precipitate morphology with a helium bubble covering each wettable patch. This figure shows the isosurface with order parameter c=0, corresponding to the midpoint of the metal/precipitate interface. . . . . 63
3-5 Isosurfaces of the typical progression of our example simulations: a) Ini-tialization: each wetting patch is covered with a precipitate of equal di-ameter, which relaxes to the designated wetting angle. b) The precipitates become larger, but do not interact. c) Precipitates interact and begin to co-alesce. d) The coalesced precipitates reach an equilibrium configuration.
All coalescence or de-wetting processes typically take place in 1 or 2
sim-ulation steps. e) The precipitate grows uniformly as more precipitate phase
3-6 Isosurfaces of the four final precipitate morphologies observed in our model problem: a) a single extended precipitate covering all wetttable patches fully, b) all wettable patches are fully covered, but there are several distinct precipitates, c) one or more wettable patches are partially de-wettted, and
d) one or more wettable patches are fully de-wetted. . . . . 65
4-1 a) The simulation cell for a single Cu-V described in section 4.2.1. The red circles are wetting regions while the surrounding interface area is non-wetting. Periodic boundary conditions are applied in the x and y directions
b) Initial precipitate morphology with a helium bubble covering each
wet-table patch. This figure shows the isosurface with order parameter c=0. . . 73
4-2 a) A perspective view of the c=0 isosurface of He precipitates at a Cu-V interface patterned with MDIs. b) A top down view of the c=O isosurface of He precipitates at a Cu-V interface patterned with MDIs. Stable linear precipitate channels do form. . . . . 76
4-3 a) The total surface area of the precipitate as a function of normalized pre-cipitate volume. The red dashed line represents the prepre-cipitate surface area of 40 spherical caps and the blue dashed line represents the surface area of 4 horizontal spherical segments with fixed length of 23nm, both on a uniform surface with wetting angle 115'. b) The interfacial wetted area of the precipitate as a function of normalized precipitate volume. The red dashed line represents the precipitate surface area of 40 spherical caps on a uniform interface and the blue dashed line represents the wetted interfacial area of 4 horizontal spherical segments with fixed length of 23nm, both on a uniform surface with wetting angle 115 . . . 80
4-4 a) The simulation cell for two adjacent Cu-V interfaces described in section 4.3.1. The red circles are wetting regions while the surrounding interface area is non-wetting. Periodic boundary conditions are applied in the x and y directions b) Initial precipitate morphology with a helium bubble covering each wettable patch. This figure shows the isosurface with order parameter
c=0. ... ... 82
4-5 a) This shows the atomic structure of a { I11 } fcc plane and a { 1 10} bcc plane with their <1 10> and <111> type directions respectively. b)Depicts the possible orientations of the different < 111 >BCC and < 110 >FCC
directions relative to each other. There are 7 possible misorientations. . . . 84
4-6 A perspective view of the c=0 isosurface of He precipitates at two adjacent Cu-V interfaces patterned with MDIs. . . . . 85
4-7 a) TEM image of the edge-on view of a Cu-V trilayer. Each vanadium layer is 150nm and the Cu layer is 5nm. b) TEM image of the in-plane view of the Cu-V interface. White lines are linear channels formed by He precipitates. The yellow box highlights two aligned channels that are approximately l0nm apart, corresponding to the spacing predicted by 0-lattice theory of 8.6nm . . . . 87
4-8 a) Solve time as a function of processing cores for a strong scaling phase-field study run by Williamson et al. [3]. b) Solve time as a function of processing cores for the physics relevant to the Cu-V simulation. Solve time levels out when computing power drops below 10,000 DOFs per pro-cessor. . . . . 89
5-1 a) The simulation cell for a single wetting ribbon, b)two parallel wetting ribbons on adjacent interfaces and c) two orthogonal wetting ribbons in adjacent interfaces. The red areas are wetting regions while the surround-ing interface area is non-wettsurround-ing. d) Initial precipitate morphology with eight helium bubbles equally spaced along a single wetting ribbon, e) six-teen helium bubbles equally space along two parallel wetting ribbons on adjacent interfaces and f) sixteen heium bubbles equally spaced along two orthogonal wetting ribbons on adjacent interfaces. . . . . 96
5-2 The final morphologies for the nine different combinations of wetting rib-bon configuration and wetting angles. a-c) The c=0 isosurface for the sin-gle wetting ribbon configuration with 600, 900, and 1200 wetting ansin-gles. d-f)The c=0 isosurface for the two parallel wetting ribbons configuration with 600, 900, and 1200 wetting angles. g-i)The c=0 isosurface for the two orthogonal wetting ribbons configuration with 600, 900, and 120' wetting angles. . . . . 98
5-3 a) The initialized simulation cell used to calculate the horizontal cylindrical segments reference case for the parallel and orthogonal ribbon simulation set up, where red coloring corresponds to the helium phase and blue col-oring corresponds to the metal phase. A 2D simulation was run and pre-cipitate surface area and interfacial area was extracted. Since the length of the horizontal cylindrical segment is fixed to that of the length of the wetting ribbon, surface area and interface area values are multiplied by 20. The yellow line segments in the figure show the wetting area of the cell. Here, the wetting angle is 600, but similar runs were done for 900 and 1200. The rest of the boundary is non-wetting. b) This image captures the coa-lescence event between the top and bottom precipitate, corresponding to a sharp decrease in the precipitate surface area. . . . . 99
5-4 a) The plot of the precipitate surface area as a function of normalized pre-cipitate volume for 60' (red circles), 90' (blue triangles), and 120 (black plus signs) wetting angles for a single wetting ribbon. b) The plot of the interfacial area wetted by the precipitate as a function of normalized pre-cipitate volume for 60', 90', and 120' wetting angles for a single wetting ribbon. Reference cases are rendered in the blue dashed and solid lines. . . 101
5-5 a) The plot of the precipitate surface area as a function of normalized pre-cipitate volume for 60' (red circles), 900 (blue triangles), and 1200 (black plus signs) wetting angles for two parallel wetting ribbons on adjacent in-terfaces. b)The plot of the interfacial area wetted by the precipitate as a function of normalized precipitate volume for 60', 90', and 1200 wetting angles for two parallel wetting ribbons on adjacent interfaces. The refer-ence cases are rendered in dashed and solid blue lines. . . . 105
5-6 a) The plot of the precipitate surface area as a function of normalized pre-cipitate volume for 600 (red circles), 90' (blue triangles), and 120' (black plus signs) wetting angles for two orthogonal wetting ribbons on adjacent interfaces. b)The plot of the interfacial area wetted by the precipitate as a function of normalized precipitate volume for 60', 90', and 120' wetting angles for two orthogonal wetting ribbons on adjacent interfaces. Refer-ences cases are rendered in dashed and solid blue lines. . . . 107
List of Tables
3.1 Final morphologies observed for each angle and wettable patch spacing combination investigated. . . . . 67
Chapter
1
Introduction
1.1
Motivation
Fusion power has the potential of meeting world energy demands with minimal environ-mental impact [4, 5]. The performance and safety of a fusion reactor is primarily governed
by the integrity of the plasma-facing wall under operating conditions [6]. During
opera-tion, this wall gets bombarded with matter and energy, byproducts of the fusion reaction. As a result plasma-facing materials need to withstand high temperatures, thermal cycling, neutron radiation, light radiation and ion and helium (He) bombardment [7]. While He is often considered a harmless, non-reactive gas, it gets implanted into the plasma facing wall and causes irreparable damage to engineering alloys. Once implanted into a metal, He amplifies radiation-induced embrittlement [8], swelling [9], and surface damage [10]. The destructive effects of He originate in its insolubility: implanted He precipitates out into nanoscale He-filled cavities[ 1]. Under some conditions, this cavity maintains it's size as a stable "He bubble" up to a diameter of approximately 10nm, while under other conditions it can grow without bound into a void [12, 13]. It is these voids that are responsible for the He-induced damage rather than small scale He bubbles. The current approach to managing implanted helium has two primary components: 1. Maximizing the size at which a harm-less He bubble transitions into a damaging void and 2. Increasing the number of nucleation sites for He bubbles to form, decreasing the He flux per bubble, and slowing down the bub-ble growth rate [14]. These approaches focus on delaying the onset of the "bubbub-ble-to-void"
transition.
Recent research has suggested that some interfaces are excellent trapping sites for He bubbles due to their structure [11, 14, 15, 16, 17]. However, the array of interfaces is ex-tensive and to enumerate over all possible interfaces in not feasible. Rather than finding an appropriate interface for He management through brute force, we propose using patterned designer interfaces with properties tailored for mitigation of He damage. While free sur-faces can be easily patterned [18, 19, 20], intersur-faces are buried within a material and thus difficult to access directly. Rather than using, for example, a hydrophobic coating to pattern a free surface as a means of controlling water droplet dynamics [21, 22], we tune interface crystallography and composition as a means of controlling the intrinsic interface structure and thus the interface properties. This thesis will focus on the design and investigation of interfaces that promote precipitation of He bubbles in such a way that they coalesce into long, linear channels, enabling controlled He removal via outgassing, thereby averting He-induced damage, prolonging materials lifetime, and increasing safety.
1.2 Overview of Interfaces
In this section models for classifying the structure of an interface are discribed, particu-larly focusing on the misfit dislocation model chosen for the design work proposed in this thesis. Furthermore, interface properties are examined and specifically their connection to
structure.
An interface in a polycrystalline solid is often thought of as a dividing plane between two adjoining crystals. However, it has an atomic-level structure of its own, which depends on numerous crystallographic and compositional variables. This structure plays a key role in determining a wide range of interface properties, including mechanical, electrical, ther-mal, and diffusion properties [23]. Thus, if the structure of an interface may be controlled, then-in principle-so may a wide range of its properties.
An interface between misoriented crystals of identical composition and structure (i.e. a homophase interface or grain boundary(GB)) has five macroscopic degrees of freedom (DOFs): three to describe the misorientation of the adjoining crystals and two to describe
the orientation of the interface plane. In addition to these macroscopic DOFs, a complete description of the state of an interface (homophase or herterophase) may require addi-tional "microscopic" DOFs, which detail the atomic-level configuration. The structure, and therefore the properties, of an interface depend on all of these DOFs [23]. A brute force approach to interface structure design that relies on direct enumeration is infeasible. It is therefore necessary to develop a more intelligent approachs towards selecting interfaces whose structures give rise to desired properties.
1.2.1
Classification of Interfaces
Interfaces in polycrystals are either homophase or heterophase. A homophase interface or grain boundary (GB) is formed between two misoriented crystals of identical composition and crystal structure. A heterophase interface is formed when materials of two different phases adjoin each other. The adjoining crystals may differ in composition, crystal struc-ture, or both.
Interfaces that have perfect atomic matching across the entirety of their area are referred to as "coherent". GBs may be coherent and stress free, while heterophase interfaces may generally only be coherent if one of the adjoining crystals is strained such that it matches the crystallography of the neighboring crystal. Since coherent interfaces are often lower in energy than an interface lacking perfect atomic matching, it can be energetically fa-vorable for such straining to occur if the strained crystal is sufficiently thin. However, as the thickness of the strained crystal increases, the elastic energy needed to maintain co-herency exceeds the energy difference between the coherent and incoherent interfaces and a coherent-to-incoherent structural transition may occur [24, 25, 26].
Coherent-to-incoherent transitions occur by the nucleation of dislocations, which move through the adjoining crystals and are deposited on the interface. At the end of this transi-tion, the resultant configuration is an array (or arrays) of misfit dislocations at the interface. The long-range elastic fields of this array are equal and opposite to the stress needed to impose coherency at the interface. If the arrays are spaced such that there are patches of coherency between them, the resulting interface is called "semicoherent". However, if the
Figure 1-1: Edge-on (top) and In-plane (bottom) views of a) coherent, b) semicoherent, and c) incoherent GBs in ce-Fe. The atoms are colored according to coordination number.
dislocation array density is so high such that no coherent patches remain, the interface is classified as "incoherent."
An example of coherent, semicoherent, and incoherent structures is given in Fig. 1, which shows the structure of a GB along
{
112} planes in as-Fe for different twist angles. The interface in Fig. 1-1 .a) is a coherent twin boundary with a single extrinsic dislocation. Both the edge-on (top) and in-plane (bottom) view show perfect atomic matching (except in the region of the dislocation). Fig. 1-1 .b) shows an interface with a 50 twist from the coherent configuration in Fig. 1-1 .a). It contains two arrays of misfit dislocations. In the inplane view, there are clearly coherent patches between the intersecting dislocations. Finally, Fig. 1-1.c) depicts an interface with a 30 twist from the coherent configuration where the dislocation arrays are so dense that there are no disceable coherent patches. The atoms in these figures are colored by coordination number. Atoms with the same color have the same structure and thus are "ordered", while atoms of different color have differentstructure and are "disordered".
It has also been suggested that some incoherent interfaces may be amorphous and ex-perimental studies have imaged interface films that indeed appear to be amorphous [27, 28]. The idea of amorphous interfaces, however, remains controversial. For example the exis-tence of thin intergranular disordered films of nanometer thickness has been predicted in the atomic structures of certain high-energy GBs in silicon [29]. However, it was subsequently
argued that these GBs do contain structural ordering after all [30].
1.2.2
Quantitative Interface Structure Models
Several models have been developed to describe and predict the structure of different classes of interfaces. The coincident site lattice (CSL) model, the misfit-dislocation model, and the structural unit model (SUM) are the most commonly used ones for describing co-herent, semicoco-herent, and incoherent interfaces, respectively.
In the CSL model, the degree of fit (X) between two crystals at an interface is de-scribed as the reciprocal of the number of coincident sites (i.e. atomic sites common to both lattices) to the number of total sites. While two misoriented crystals will have an identical CSL for a given misorientation (because CSL only takes into account 3 of 5 of the DOFsjust the misorientation of the crystals), the structure of the boundary will drastically change depending on the orientation of the interface plane (it does not depend on the I value alone) [31]. This model is a purely geometric one in which boundaries with more coincident sites are thought to have lower energies than boundaries with fewer coincident sites [32]. Mori et al. measured the grain boundary energies for a [001] twist boundary in copper (Cu) [33]. They found that while E boundaries did, in general, have lower energies than general boundaries (those that can not be described by a CSL), there was no clear relationship between E number and energy, e.g. lower I values did not correspond to lower GB energies. This implies that GB energy does not depend on E values alone. Although CSLs can only describe a small fraction of GBs, they are more frequently encountered in polycrystalline materials than non-CSL boundaries. Another advantage of the CSL model is that the interface can be thought of as a structure of identical repeating units. If the properties of a single unit can be characterized, the properties of the entire interface can be inferred, but only for certain GB plane orientations. While this model is useful because coherent CSL type boundaries are often low in energy and therefore abundant, it has short-comings when it comes to describing a broader class of interfaces. For example, CSL is only useful in describing GBs because heterophase interfaces typically have no CSLs. Fur-thermore, the CSL does not take into account the orientation of the interface plane, which
I's I I
- I*
Xz17
8
0*
6990
9-28I
0 * . . . . .0
0
* * 0 * . 0Fiur -2 1 ndII*ae faoed . budes A 11,onaycnb ecieob
m * e u o 0 E * s - *.
* . 0
Figure 1-2: E1 and E21* are favored boundaries. A M17 boundary can be described to be made up of repeating units made up of Xl and 1 * structures[ 1].
plays an important role in determining interface structure.
It has been observed that the structure of some non-CSL boundaries may be described as consisting of recurring structural units drawn from coherent structures. This observation led to the development of the structural unit model (SUM) of interfaces. The SUM defines a structural unit as a small group of atoms (on the order of 10 atoms), arranged in a char-acteristic configuration drawn from coherent interfaces, which are referred to as delimiting boundaries. All other boundaries that have misorientations and boundary planes between the favored boundaries can be thought of as being made up of a mixture of the structural units present in the favored boundaries [34, 1].
1 and I* boundaries (i.e. a perfect crystals) are the simplest delimiting boundariesl
used. The structure of these boundaries is identical, as demonstrated in Fig. 3, but they give rise to differing structural units. An example of an application of the SUM to a [001] tilt boundary is shown in Fig. 1-2. The structure of this boundary can be described in terms of distorted Il (empty boxes) and El * (shaded boxes) structural units [1]. As the tilt axis changes, so does the number and distribution of these structural units within the boundary.
One of the key strengths of the SUM is that it may be applied to incoherent interfaces. However, the SUM has many limitations. It is not applicable to all boundaries in all ma-terials: the SUM cannot be used for both twist and tilt GBs [1]. First, to use the SUM it must be possible to define favored boundaries, which is problematic for interfaces between materials that have no CSLs. In practice, this restriction has confined application of the
SUM to GBs in cubic materials. Furthermore, the SUM does not give unique descriptions
of GBs: different combinations of structural units can be used to describe a single boundary and there is no way to determine the best choice of units. Also, as seen in Fig. 1-2 the units can be distorted for some boundaries. These distortions may be very large, putting into question the validity of the model. Another limitation of the SUM stems from its assump-tion that the structure of any GB with a given character may be described with a single set of structural units. In fact, however, the structural units that are present at a given boundary may be material dependent. A computational study done by Rittner and Seidman demon-strated that while the SUM is applicable to a range of Al boundaries, the results cannot be used to predict the structure of same I boundaries in Ni [35]. In conclusion, the capability of the SUM is descriptive rather than predictive.
The misfit dislocation model is useful in describing semicoherent interfaces. In this model, the structure of the interface is described by one or more intersecting arrays of misfit dislocations. Between the dislocations are coherent patches of interface. The number and character of the misfit dislocations in an interface is related to the strain needed to impose coherency. Therefore it is possible to predict a misfit dislocation configuration in an interface, specifying the spacing, direction, and Burgers vector of the dislocations. 0-lattice theory [36, 37] and the Frank-Bilby equation (FBE) [23] provide some insight into the misfit dislocation structure at a semicoherent interface.
O-lattice theory computes the distribution of misfit dislocation arrays, giving geometri-cal information about dislocation arrangement. One way to interpret the results of O-lattice theory is that it gives the distribution of misfit dislocation intersections (MDIs). However, it cannot uniquely specify misfit dislocation Burgers vectors and different sets of disloca-tion arrays can give rise to an identical distribudisloca-tion of MDIs. Each interface can have up to three sets of dislocation arrays. In its original form [38, 39], O-lattice theory can only be
a) b)
Lattice 8
S
-Lattice A t f
Figure 1-3: a) Burgers circuit that encloses a vector f that lies within the interface b) Burgers circuit redrawn in the reference configuration with closure failure.
used for crystal structures that can be related to each other through uniform deformations (e.g. it can handle FCC/BCC interfaces but not BCC/HCP because transforming between these two structures requires a deformation and a shuffle of atoms).
The Frank-Bilby equation can be use to determine the average Burgers vector content of an interface [23]. This equation may be derived by drawing a Burgers circuit that encloses a probe vector # in the interface as shown in Fig. 1-3.a). The crystals on either side of the interface are related to some reference state by uniform displacement gradients F^ and FR.
If the Burgers circuit is then redrawn in the reference state, there will be a closure failure
as shown in Fig. 1-3.b):
E
= [(FB)-1 - (F^)1]f (1.1)E
may be interpreted as the sum of the Burgers vectors of all dislocations crossed byf.
However, it cannot uniquely specify spacing or directions of the dislocation arrays. For example, an array with Burgers vectorE
is equivalent to an array that has twice the density of misfit dislocations but Burgers vector of B/2. To fully characterize the dislocation structure, additional assumptions must be made [40].Typically, to fully predict the misfit dislocation structure of an interface, defined by the spacing between dislocations, the dislocation line direction, and the Burger's vector, it is necessary to use atomistic level modeling [41, 42]. This methodology is computation-ally costly as it requires the tracking of millions of variables. However, recently methods
have been developed to determine misfit dislocation array structure using mesoscale mod-eling which are on the order of 100x faster than using atomic simulation [43, 44]. This methodology relies on O-lattice theory to calculate dislocation line direction and spac-ing. Anisotropic elasticity theory is used to calculate the Burgers vector, yielding multiple possible solutions [45]. To identify the correct solution, the lowest interface energy is de-termined using the elastic energy of the misfit dislocations.
It is only appropriate to use the misfit dislocation model at interfaces where individual misfit dislocations can be identified. Thus for large misfits (for example big differences in lattice parameters or structure) or large misorientations (or both), the dislocations begin to overlap and the misfit dislocation model no longer applies.
The misfit dislocation model is a promising for making predictions of the structure of an interface. It may be applied to some heterophase interfaces and can describe interfaces with general misorientations of crystals. Although this model has limitations, it provides the distribution of MDIs allowing for the predictions of precipitation behavior at semicoherent
interfaces.
1.2.3
Effect of semicoherent interface structure on properties
Interface structure plays a key role in determining interfacial properties. Properties such as segregation, diffusion, and precipitation governed by interface misfit dislocations are discussed here. Both the misfit dislocations and their intersections influence behavior.
The segregation of solutes to interfaces has been observed in a variety of alloy systems. For example, in austenitic stainless steels, chromium (Cr) and carbon (C) may segregate to grain boundaries [46]. This process is the mechanism of sensitization in stainless steels, which negatively affects their corrosion and fracture resistance [47]. Because of its tech-nical importance, the effect of interface structure on segregation in steels has been widely studied. Laws and Goodhew measured the full width half maximum (FWHM) of Cr con-centration profiles at the GB for a variety of CSL and non-CSL grain boundaries. They found that the FWHM did not depend on whether the boundaries were CSL or not, and fur-thermore the -value of the CSL boundaries did not have a correlation with the FWHM. For
example, E3 and El 11 boundaries exhibited among the narrowest Cr concentration profiles, whereas 9 boundaries exhibited profiles that were twice as wide. Non-CSL boundaries also had both wide and narrow profiles. They concluded that the differences in concentration profile width, and thus segregation of Cr, must be a function of the atomic packing at the boundary, which depends on both misorientation and the GB plane orientation [48].
Another study done by Isheim et al. examined the relationship between coherency and solute segregation at metal/metal-nitride heterophase interfaces. They found that molybde-num nitride particles in Fe-2at% Mo-X (where X=0.4at% Sb or 0.5at% Sn) formed with either a very thin platelet type structure or a much thicker structure of coarser plates. The thin plate particles formed a coherent interface whereas the coarser plates formed a semi-coherent interface with the Fe-rich matrix. They observed segregation of large Sb and Sn atoms only to the thicker precipitates. They concluded that there is a preference for segregation to interfacial misfit dislocations due to the excess free volume associated with the semi-coherent interface [49]. Simulations have contributed to the understanding of the relationship between interface structure and segregation. In Monte Carlo simulations of segregation at [001] twist boundaries in Pt(Au) alloy, Seki et al. varied twist angle between the crystals from 0 to 450 and measured the spatial distribution of Au atoms at the interface [50]. They determined that Au atoms segregate primarily to the cores of the misfit screw dislocations formed at the boundary and found that the Au concentration increased linearly as the twist angle increased, saturating at ~ 35'. This is because as twist angle increased, so did misfit dislocation density.Once dislocation cores began to overlap (i.e. the interface is incoherent)the interface was saturated and there is no preference for the Au to segre-gate to specific locations within the boundary [51]. In summary, the literature suggests that the structure of interfaces, in particular, the misfit dislocation structure, plays a role in determining segregation properties of solutes.
Interface structure not only affects segregation properties at interfaces, but also plays an important role in diffusion. Atomistic studies have shown that highly mobile He interstitials in a-Fe migrate readily along screw dislocation cores [52]. Thus, in pure twist GBs, screw misfit dislocations provide fast pathway for l-D He diffusion.
experimentally. Average diffusivity (measured by the tracking of a radioactive tracer) in-creased with increasing misorientation angle for tilt boundaries in Cu/Au bicrystals as ob-served in a study done by Couling and Smoluchowski [53]. They found that at some critical angle, the average diffusivity saturated. They concluded that the increased diffusivity was correlated to an increase in misfit dislocation density at higher misorientations. However, at some critical angle the dislocation arrays were so closely spaced that diffusion was easy in all directions. Sommer et al. [54] investigated the diffusion of a radiotracer in a Au/Cu bicrystal. In this study they measured diffusion in two mutually perpendicular directions in a (111) interface and in a (011) interface between two FCC crystals with different lattice parameters. The (111) interface was described as having a hexagonal network of misfit dislocations while the (011) interface had an anisotropic, (different Burgers vectors and spacing for each set of dislocation arrays) mutually perpendicular network of misfit dislo-cations. They found that diffusion in the (011) interface was anisotropic whereas it was nearly identical in the two directions measured for the (11) interface. This study demon-strates the correlation between diffusion and the structure and directionality of dislocations in an interface.
Like segregation and diffusion, precipitation is influenced by interface structure. Both simulations and experiments have show that fluid (liquid or gas) precipitates tend to accu-mulate and cluster into bubbles at inhomogeneities in materials such as GBs, interfaces, and dislocation rather than in perfect crystalline grain interiors [55]. In particular, the pre-cipitation behavior of He is of interest due to it's presence in nuclear materials systems. He-lium precipitate size and density have been observed to vary from grain boundary to grain boundary [56]. In an experimental study, Thorsen et al. observed that low energy bound-aries contained smaller He precipitates and smaller densities of precipitates then boundbound-aries that were likely to have higher energy [57].
In addition to GBs acting as preferential areas for helium precipitates, it has been found that dislocations are preferred nucleation sites for He. Atomistic studies on the interaction of He with a-Fe have shown that He is bound to both edge and screw dislocations in a-Fe to a distance of approximately two Burgers vectors from the core of the dislocation. The binding energies correlate with the excess atomic volume near the core regions (i.e. high
He dislocation bonding energies indicate high excess atomic volume)[58, 52]. Thus in pure twist and tilt GBs that contain misfit screw and edge dislocations respectively, the misfit dislocations act as preferred nucleation sites, due to more excess atomic volume.
Singh and Leffers experimentally studied the formation of He precipitates in aluminum
(Al) GBs. They found that while He precipitates formed on dislocations in the boundary,
dislocation nodal points or locations of dislocation intersection were even more strongly preferred. The precipitates that formed within the GB were larger than those observed in the matrix, indicating a preference for He to precipitate at GBs. Additionally, the authors observed rows of precipitates in the GB that appeared parallel and regularly spaced and were thought to have nucleated on MDIs. They also found that precipitate distribution var-ied from boundary to boundary, indicating a dependence of He behavior on GB structure, namely the density of dislocation intersections [59].
Figure 1-4 demonstrates the distribution of He bubbles in a) a single crystal of Au, b) at a - 1 twist boundary on {100} planes in a Au bicrystal, and c) a Monte Carlo simulation
of a ~ 2 {1001 twist boundary in Cu, which has the same crystal structure as Cu. Both the TEM image and simulation demonstrate that He preferentially precipitates at the dislo-cation nodes. Furthermore, this study shows the effectiveness of the boundary at collecting He from the neighboring crystalline material [2]. In conclusion, He precipitation depends on interface structure and in particular He demonstrates a strong tendency to precipitate at
MDIs.
1.2.4
Growth mode of He precipitates at semicoherent interfaces
Recently, a mechanism for the way He precipitates at semicoherent interfaces has been suggested through atomistic modeling [60]. This study focuses on a FCC/BCC Cu-Nb interface due to the availability of experimental results [14, 61] and validated potentials
[62]. It has been experimentally observed that Cu-Nb follows the Kurdjumov-Sachs (KS)
orientation relation where a FCC Cu { 11} plane neighbors a BCC Nb { 1101 plane and
an interfacial Cu <110> direction lies parallel to a NB <111> direction. Though atomistic simulations, it has been shown that this interface contains two sets of parallel misfit
dislo-AW~
Figure 1-4: a) He precipitates in single crystal Au. b) Plane view of a V twist GB in Au.1 He precipitates (bright dots) decorate the nodes of the GB dislocation network. c) Monte Carlo simulation of He precipitates at a - 2' twist GB in Cu [2].
cations, thus this interface can be described as semicoherent [61]. In agreement with the work reviewed in the preceding sections, the study found that successively added He atoms aggregate into clusters located at MDIs. These clusters preferentially grow into the Cu side of the interface likely due to lower vacancy formation and migration energies in Cu than
Nb.
Up to about 20 He atoms, the clusters grow as flat platelets along the interface while
maintaining a thickness of two atomic layers. These platelets are stable even when there is a vacancy supersaturation. Beyond about 20 atoms, however, the clusters grow by increasing their thickness one atomic layer at a time, while maintaining a constant area at the interface. In order to explain this mechanism of He growth, it is necessary to consider interface wetting, the phenomena that dictates He favorability towards adhering to the interface. Consider three surface energies that occur when He is at an interface formed between two elements A and B. yAB is the location-dependent energy of an interface between elements-A and B, YAH, is the interface energy between helium and element A, into which the helium
precipitates grow, and YBHe is the interface energy between helium and element B[63].
From these energies an excess interface wetting energy can be derived:
W = YAB + YAHe - YBHe (1.2)
When W<0, it is energetically favorable for He to exist as a cluster or bubble entirely within A. However, when W>O, the surface energy of the precipitate is minimized when he He cluster wets the interface. The interface energy determines the He bubble contact angle
[64] which is discussed further in section 3.3.
Applying this general equation to the Cu-Nb system, if the Cu-Nb interface had a single uniform surface energy, then He precipitates would either wet or not wet the interface. However, the Cu-Nb interface energy is not uniform over dimensions comparable to the size of the He platelets mentioned above. Thus, certain areas of the interface may satisfy the condition for wetting while others do not. It was determined through atomistic modeling that interface regions around misfit dislocation intersections have high energy and satisfy the wetting condition (W>0) [60]. The regions between the dislocation intersections have
considerably lower energy and do not satisfy the wetting condition (W<O). As such, He clusters tend to grow at dislocation intersections. Once a cluster has completely covered the high energy region near a dislocation intersection, no further wetting is possible and the He grows into the Cu layer.
The implication of this finding is that it is not necessary to know the exact atomic struc-ture of an interface to know where He will preferentially precipitate. Rather, it is sufficient to know the position-dependant energy distribution and, more specifically, the regions of sufficiently high energy for wetting to occur (e.g. dislocation intersections as in the ex-ample above). This description of He precipitate growth relies on the thermodynamics of interfaces and free surfaces and therefore is not limited to the model interface discussed above, but can be expected to hold for any surface.
1.3
Thesis overview
This thesis designs semicoherent interfaces with energy distributions that cause He to pre-cipitate into stable, connected pathways. The first part of this work focuses on developing computational methods for identifying promising interfaces that give rise to He channels and for modeling He network behaviors at these interfaces. The second part of this work focuses on applying the developed model to interface systems of interest with non-uniform
interface energies.
Chapter 2 develops an approach to interface design using O-lattice theory as a means of predicting MDI structure given crystallography and composition. Design criteria is used to identify a candidate interface, Cu-V, as a "proof of concept" materials system that gives rise to He channels. Chapter 3 describes a phase field model that can simulate the growth, coalescence, and stability of He precipitate morphologies on interfaces with location depen-dent energies. Chapter 4 applies the phase-field model to the Cu-V interface to determine if He channels do indeed form at these interfaces. Finally, Chapter 5 applies the phase-field model to interfaces that have high energy features other than MDIs, namely threading dislocations. The simulations are compared to experimental results of implanted Cu-V biy-layer and tribiy-layer systems. We conclude that He channels do form as a result of the intrinsic
Chapter 2
Calculating MDI distributions with
O-lattice
Theory
2.1
Introduction
O-lattice theory is a well-known method for predicting certain features of the internal struc-ture of interfaces between crystalline solids. Provided the crystallography of an interface, it gives the distribution of periodically recurring structural elements, such as MDIs or re-gions of local coherency [23, 40]. Rather than using it to predict interface structure from interface crystallography, we use it to design interfaces with pre-specified internal structure
by controlling interface crystallography. In this section we perform O-lattice calculations
of FCCIIBCC interfaces and apply design constraints to isolate interfaces with desirable precipitation properties, namely that He coalesces into long, linear channels.
2.2
O-lattice
calculation for FCCIIBCC interface
O-lattice theory calculates locations of O-lattice points, which are points of "best match" in an interface. To better understand the concept of best match, consider the following construct: two crystals are misoriented and parallel cuts are made to both at a prescribed plane orientation. The cut faces subsequently adjoined. When the boundary is relaxed, the atoms will shift slightly, except those at a location of "best match". This shift will
result in areas surrounding the points of "best match" to extend into coherent patches (i.e. regions of perfect atomic matching) and the areas of bad match" to contract to dislocations. The superlattice that describes the points of best match (i.e the distribution of coherent patches) will have an identical distribution to the superlattice that describes the points of worst match: the distribution of MDIs.
To promote precipitation of He into linear channels, we seek interfaces with MDIs spaced closely in one direction, ^ and far apart in the perpendicular direction, fi as shown in Figure 2-1. As He bubbles nucleate at MDIs and grow, they are expected to impinge upon each other, coalescing and forming a linear channel along ^. If neighboring channels are sufficiently far apart, then they do not interact and the interface area between them remains free of precipitates. This design objective calls for a highly anisotropic MDI distribution in order promote precipitation of He into linear channels. Some semicoherent interfaces, such as low-misorientation grain boundaries in cubic metals [2], tend to contain relatively isotropic MDI distributions and are therefore poor candidates for our design. We choose to investigate heterophase interfaces formed by joining a 111 plane of a face-centered cubic
(FCC) metal to a 110 plane of a body-centered cubic (BCC) metal. MDI distributions at
such interfaces have been studied extensively and are known to be anisotropic [61, 41]. Within this class of interfaces, there are two parameters that influence MDI distribu-tions: the ratio of cubic lattice parameters in the neighboring crystals, p = afc,/ceb, where afC is the lattice parameter of the FCC crystal and abc is the lattice parameter of the BCC crystal, and the twist angle 0 describing the relative rotation of the crystals parallel to the interface plane. We measure 0 with respect to the Nishiyama-Wasserman (N-W) orienta-tion relaorienta-tion, where a BCC <100> direcorienta-tion is parallel to a FCC<l 10> direcorienta-tion. p and 0
define the interface design space.
O-lattice theory calculates two basis vectors i1 and V, which describe translations of the MDI lattice. To determine these basis vectors, first we must find a displacement gradient matrix, A, that takes a set of translation vectors Xfe of the interfacial FCC
{
I11} plane and maps them to corresponding translation vectors Jebcc of the interfacial BCC{
110} plane:AJfcc = bc, [65]. When the 0 = 0', we can write the displacement gradient as AO = XbccX, where Xbcc and Xf c are 2 x 2 matrices whose columns contain corresponding
Ib~
mo
1'PO
vo , ,
ONE
Figure 2-1: The distribution of MDIs (black dots) desired in our design: closely spaced along ^ and far apart along ft ( f.Lp). He bubbles precipitating on MDIs are expected to link up and form continuous linear channels along p as illustrated by the dotted contours. O-lattice theory gives translation vectors of the MDI lattice, it and V. From these, Gaussian
lattice reduction determines the shortest and second shortest MDI basis vectors ul and v.
0
translation vectors 1bc, and fcc. These matrices may be written in many equivalent ways,
for example,
-\[6/4 V6/4 -\c2/2 -F/2 X fc - a cc , XbIc -- a bc 1
-c 5/
Vd/4
[-1/2 1/2In this configuration the blank direction points along the x-axis and the blank direction points along the y-axis. The BCC <100> direction is parallel to the FCC <110> direction as specified by the N-W orientation relation. We can imagine rotations of the FCC translation vectors relative to the BCC translation vectors. For non-zero 0 values we can find A, where A = R(0)AO, where R(0) is a rotation matrix applied to the bcc side of the interface. We can
calculate the MDI distribution using the O-lattice equation [65]:
[U
I =(I - A-)'Xcc (2.1)where I is the identity matrix. When expressed in units of acc, U and V only depend on
p and 0.
The it and V vectors given by equation 2.1 may be any two translation vectors of the MDI lattice. In general, neither of them lies along the direction of smallest MDI spacing,
fl.
We use Gaussian lattice reduction to determine the shortest and second shortest MDI basis vectors, di' and v [66], starting from any given i and V. The Gaussian lattice reductionalgorithm can be seen in Appendix A. The shortest distance between MDIs is l,j = 1'I.
From
'
and v, we also determine the perpendicular distance lI between rows of closest-spaced MDIs, as shown in Figure 2-1. Both quantities are expressed in units of afcc.Figure 2-2 a) and b) shows ,,j, and l, respectively, as functions of 0 and p. They demonstrate remarkably rich variations of 1,,j, and l across the design space. Neither 1,'m or 1, are monotonically increasing or decreasing with 0 or p.
2.3
Applying design criteria to 1mj, and
l
To select the 0 and p that represent interfaces where coalescence of He bubbles into contin-uous linear channels is likeliest, we prescribe three physics-based design criteria:
a) b) 0.9. 0.9 010.85. 0.85 E 0. 8 0.8. ' 0.75 0.75-0.7 0.7 0 1 2 3 4 5 6 7 0 1
Twist angle 0 (dog)
2 3 4 5 6 7
Twist angle 6 (deg)
Figure 2-2: Contour plots of 1mi and l over the design space, in units of af c, described by
6 and p. The design objectives call for imipi values that fall into lighter regions in (a) and 1,
1. 1,ti, must be small enough so that He bubbles growing at MDIs coalesce before
be-coming unstable He-filled voids,
2. 1, must be large enough so that neighboring channels do not interact, and
3. l must not be so large that implanted He impurities cluster and precipitate before
they are able to diffuse to the closest channel.
The purpose of criterion 1 is to avoid the "bubble-to-void transition": an osmotically driven instability of He precipitates under vacancy supersaturation [12, 13]. Criteria 2 and
3 ensure that there are precipitate-free regions between neighboring channels.
Under irradiation conditions relevant to nuclear energy, the "bubble-to-void" transition occurs when He bubble diameters are on the order of IOnm [13]. To ensure that adjacent He bubbles coalesce well before they reach this size, we state criterion 1 as 1,mm < 7, which
corresponds to approximately 3nm for transition metals. Thus, individual bubbles will reach a maximum diameter of 3nm before coalescing with neighboring bubbles, preventing
a void from forming. For criterion 2, we require 1_ > 31
,,i,. This ensures that adjacent rows of bubbles are far enough apart that they do not interact. To develop a quantitative expression for criterion 3, we require that the fraction fbind of implanted He atoms that form di-helium clusters (which we assume to be immobile) before reaching a channel be below a specified limit: fbind <finad
We define fbind as the proportion of the rate of di-helium cluster formation (R) of the total rate of He arrival at the interface (Ki):
fbind = R/Ki (2.2)
Assuming that all of the He implanted into a crystalline layer of thickness t, which is cen-tered on an interface of thickness ti = 2afr, becomes trapped at the interface,
ti
Ki = Ko t(2.3)
2afcc
KO is the number of He atoms implanted per unit volume per unit time. The operating conditions of an implanter or reactor determine KO. To ensure our design is conservative,
we use the especially high implantation rate Ko ~ 1032
m3/s, characteristic of the
plasma-facing wall of a fusion reactor [67]. To find the reaction rate, we use mean field reaction rate theory[68] to define the reaction rate as:
R = 2K2He
(24)
where K2Heis the rate constant calculated assuming one of the He species is immobile and
the other is mobile and CHe is the average concentration of implanted He. Since both He
are mobile, we multiply K2He by a factor of 2. The reaction rate constant K2He is equal to
K2He = 12accDHe (2.5)
where DHe is the temperature dependent diffusivity of interstitial He. Within the interface,
steady-state He diffusion between two adjacent channels obeys
a2C
DHe + Ki = 0 (2.6)
We calculate a general solution to the partial differential equation above:
K1
c(x) = - x2
+ COx + C1 (2.7)
2
DHe
where CO and C1 are constant coefficients. We apply the boundary conditions c(O) =
c(afccIlI) = 0 (no He re-emission from channels) to obtain the expression for c(x):
c(x) = - 2 x2 + xKafccl (2.8)
DHe 2
DHe
Finally, we average c over the distance between neighboring channels, afcclot,
I "af,71- Ki 2 Kiatccl-L
1Cl x2 + xdax
(2.9)
afccli -0 0 2DHe 2DHe
which yields
Kia 2 12
S fC 1. (2.10)

![Figure 1-2: E1 and E21* are favored boundaries. A M17 boundary can be described to be made up of repeating units made up of Xl and 1 * structures[ 1].](https://thumb-eu.123doks.com/thumbv2/123doknet/14434506.515745/24.917.313.588.127.473/figure-favored-boundaries-boundary-described-repeating-units-structures.webp)