Compact Representations for Fast Nonrigid
Registration of Medical Images
by
Samson J. Timoner
B.S., Caltech, Pasadena, CA (1997)
M.S., MIT, Cambridge, MA (2000)
Submitted to the Department of Electrical Engineering and Computer
Science in Partial Fulfillment of the Requirements for the Degree of
Doctor of Philosophy in Electrical Engineering and Computer Science
at the
MASSACHUSETTS INSTITUTE OF TECHNOLOGY
May 2003
©
Massachusetts Institute of Technology 2003. All rights reserved.
A uthor ...
Department of Electrical Engineering and Computer Science
May 23, 2003
Certified by ... .
-W. Eric L. Grimson
Bernard Gordon Professor of Medical Engineering
7Thesis Supervisor
Accepted L .. ...
...
...
...
...
Arthur C. Smith
Chairman, Departmental Committee on Graduate Students
MASSACHUSETTS INSTITUTEOF T ECHNOLOGY
Compact Representations for Fast Nonrigid Registration of
Medical Images
by
Samson J. Timoner
Submitted to the Department of Electrical Engineering and Computer Science on May 23, 2003, in partial fulfillment of the requirements for the Degree of
Doctor of Philosophy in Electrical Engineering and Computer Science
Abstract
We develop efficient techniques for the non-rigid registration of medical images by using representations that adapt to the anatomy found in such images.
Images of anatomical structures typically have uniform intensity interiors and smooth boundaries. We create methods to represent such regions compactly using tetrahedra. Unlike voxel-based representations, tetrahedra can accurately describe the expected smooth surfaces of medical objects. Furthermore, the interior of such objects can be represented using a small number of tetrahedra. Rather than describing a medical object using tens of thousands of voxels, our representations generally contain only a few thousand elements.
Tetrahedra facilitate the creation of efficient non-rigid registration algorithms based on finite element methods (FEM). We create a fast, FEM-based method to non-rigidly register segmented anatomical structures from two subjects. Using our compact tetrahedral representations, this method generally requires less than one minute of processing time on a desktop PC.
We also create a novel method for the non-rigid registration of gray scale images. To facilitate a fast method, we create a tetrahedral representation of a displacement field that automatically adapts to both the anatomy in an image and to the displace-ment field. The resulting algorithm has a computational cost that is dominated by the number of nodes in the mesh (about 10,000), rather than the number of voxels in an image (nearly 10,000,000). For many non-rigid registration problems, we can find a transformation from one image to another in five minutes. This speed is important as it allows use of the algorithm during surgery.
We apply our algorithms to find correlations between the shape of anatomical structures and the presence of schizophrenia. We show that a study based on our representations outperforms studies based on other representations. We also use the results of our non-rigid registration algorithm as the basis of a segmentation algorithm. That algorithm also outperforms other methods in our tests, producing smoother segmentations and more accurately reproducing manual segmentations.
Thesis Supervisor: W. Eric L. Grimson
Title: Bernard Gordon Professor of Medical Engineering
Readers: Jacob White, Professor of Electrical Eng. and Computer Science MIT. William M. Wells III , Associate Professor Harvard Medical School. Ron Kikinis, Associate Professor Harvard Medical School.
Acknowledgements
Let me begin by expressing my appreciation for the guidance provided by Eric Grim-son, Sandy Wells, and Ron Kikinis over the last several years. Each has provided a different and important outlook on this research and has pushed me in interesting and clinically important directions. Most importantly, each has provided a research environment, filled with intelligent people, in which I have greatly enjoyed working.
Jacob White, my last committee member, provided support in a very different way: he has allowed me to attend his group meetings for years and thereby learn how to think about numerical methods. The concepts of spending a lot of computation time setting up a problem so that one can spend a lot less computation time solving a problem come directly from listening to him and his students. I have absorbed many ideas about "sparsifying" problems from his group. While most of these ideas don't show up explicitly in my thesis, they have been very important in shaping the way I think about trying to solve problems quickly.
I am thrilled to have had the opportunity to work with so many interesting and intelligent people at MIT and Brigham and Women's hospital. I have had numerous useful and interesting conversations with researchers including Alex Norbash, Steve
Haker, Simon Warfield, John Fisher, Christian Shelton, Erik Miller, just to name a few.
This work could not be completed without the contributions of my colleagues. My most important collaborators are Polina Golland and Kilian Pohl. Polina Gol-land collaborated on the classification work in Chapter 4. Kilian Pohl and I jointly developed the automatic segmentation algorithm in Chapter 5.
Furthermore, I enjoyed the opportunity to work with clinical researchers. I collab-orated with Dr. Martha Shenton and Dr. James Levitt investigating the correlation of shape of anatomical structures in the brain with the presense or absense of schizophre-nia. I worked with Dr. Lennox Hoyte investigating the movement of female pelvis muscles. I worked with Dr. Arya Nabavi investigating intra-operative brain shift. I worked with Dr. Claire Tempany, detecting the movements of the prostate data.
I am grateful for the support of the Fannie and John Hertz Foundation; they have paid me a generous stipend for the last five years. The National Science Foundation (NSF) Engineering Research Center (ERC), under Johns Hopkins Agreement #8810-274, has supported this research. And, National Institutes of Health (NIH) grant
1P41RR13218 supports collaboration between Brigham and Women's Hospital and MIT.
MIT might have been a very lonely place without the support and companionship of my friends. Of the many people who have added cheer to my life in the last few years, I particular wish to acknowledge Professor E. Dickson, Dr. K Atkinson, Dr. C. Stauffer, and Dr. C Shelton.
Last but not least, this thesis would have had many more grammatical errors if it were not for my readers: Steve Haker, Charles Surasky, Biswajit Bose, Gerald Dalley, Kinh Tieu, Chris Christoudias, Henry Atkins, Polina Golland, and Kilian Pohl.
Contents
1 Introduction 17
1.1 Motivating Concepts . . . . 20
1.2 Compact Representations of Anatomical Structures . . . . 21
1.3 Non-rigid Matching of Anatomical Structures . . . . 22
1.3.1 Morphological Studies . . . . 24
1.3.2 Segmentation . . . . 25
1.4 Non-rigid Registration of Images . . . . 26
1.5 Contributions . . . . 28
1.6 Conclusions . . . . 30
2 Forming Tetrahedral Meshes 31 2.1 G oals . . . . 33
2.2 Desirable Properties of Tetrahedral Meshes . . . . 33
2.3 Prior Work . . . . 36
2.4 Mesh Formation . . . . 37
2.5 Multiple Resolution Meshes . . . . 38
2.6 Fitting a Mesh to a Surface . . . . 40
2.7 Mesh Improvement . . . . 41 2.7.1 Mesh Smoothing . . . . 42 2.7.2 Edge Collapse . . . . 44 2.7.3 Edge Flipping . . . . 44 2.8 Methods . . .. . . . .. . . .. . . . . 45 2.8.1 Mesh Improvement . . . . 46
2.8.2 Compact Representations . . . . 2.8.3 Summary . . . . 2.9 R esults . . . .
2.9.1 Smoothing . . . . 2.9.2 Compact Meshes . . . . 2.9.3 Other Multi-resolution Technologies . 2.10 Discussion and Conclusion . . . .
3 Free Form Shape Matching
3.1 Related Work . . . . 3.2 Choice of Representation . . . . 3.3 M ethods . . . . 3.3.1 Representation . . . . 3.3.2 Matching Framework . . . . 3.3.3 Image Mesh Agreement Term . . . 3.3.4 Solving Technique . . . . 3.3.5 Matching Parameters . . . . 3.3.6 Validation . . . . 3.4 Amygdala-Hippocampus Complex Dataset 3.5 Thalamus Dataset . . . . 3.6 Discussion and Conclusion . . . .
4 Application: Morphological Studies
4.1 Background: Performance Issues in Morphological Studies . . . 4.1.1 Choice of Shape Descriptor . . . . 4.1.2 Statistical Separation . . . . 4.1.3 Visualization of Differences . . . . 4.2 M ethods . . . . 4.3 Results: Amygdala-Hippocampus Study . . . . 4.3.1 Comparison of Representation . . . . 4.3.2 Effects of Volume Normalization . . . .
48 50 . . . . 50 . . . . 52 . . . . 55 . . . . 57 . . . . 58 61 . . . . 63 . . . . 64 . . . . 66 . . . . 67 . . . . 6 7 . . . . 69 . . . . 7 1 . . . . 74 . . . . 74 . . . . 7 5 . . . . 76 . . . . 79 83 . . . 84 . . . 84 . . . 88 . . . 90 . . . 91 92 . . . 93 . . . 95
4.3.3 Effects of Alignment Technique . . . . 95
4.3.4 Visualization of Differences . . . . 96
4.4 Results: Thalamus Study . . . . 101
4.5 Discussion . . . . 103
4.6 Conclusion . . . . 105
5 Application: Segmentation 107 5.1 Overview of Segmentation Techniques . . . . 109
5.2 Segmentation Techniques Used . . . . 111
5.2.1 Atlas Matching . . . 111
5.2.2 Inhomogeneity and Tissue Estimation . . . . 112
5.2.3 Deformable Models . . . . 114
5.3 Methods . . . . 115
5.3.1 Deformable Model . . . . 116
5.3.2 Error in Weight Estimates . . . . 120
5.3.3 Feedback of Shape Information . . . . 120
5.4 Experiments . . . . 121
5.5 R esults . . . . 122
5.5.1 Algorithm Sensitivities . . . . 123
5.5.2 Segmentation without a Shape Prior . . . . 125
5.5.3 Segmentation with a Shape Prior . . . . 125
5.5.4 Validation . . . . 127
5.6 Discussion . . . . 129
5.7 Conclusion . . . . 131
6 Non-Rigid Registration of Medical Images 133 6.1 Key Concepts . . . . 134
6.1.1 Previous Work . . . . 137
6.2 Methods . . . .. . . .. .. . . . . 138
6.2.1 Initial Representation . . . . 138
6.2.3 Particulars of Image Matching . . . . 143
6.2.4 Determining the Deformation Field . . . . 145
6.2.5 Locally Maximizing the Objective Function . . . . 147
6.2.6 Comparison to Chapter 3 . . . . 149
6.2.7 Summary . . . . 149
6.3 Results . . . . 150
6.3.1 Shape Matching . . . . 150
6.3.2 Brain Images . . . . 151
6.3.3 Female Pelvis Images . . . . 156
6.3.4 Computational Analysis . . . . 159
6.4 Discussion . . . . 159
6.5 Conclusion. . . . . 161
7 Conclusion 163 7.1 Future Directions of Research . . . . 164
7.2 Conclusion . . . . 166
List of Figures
1-1 Rigid alignment example . . . . 1-2 Four left thalam i . . . . 1-3 Transferring information to an intra-operative image. . . . . 1-4 Surface of a voxel and mesh representation of the entire prostate . . . 1-5 Four left thalami and correspondences found on their surfaces . . . . 1-6 Shape differences between thalami from controls and diseased individuals 1-7 3D models of the thalamus found using an EM-MRF algorithm, manual
segmentation, and a new method that uses shape information . . . . 1-8 Images of a pelvis, brain and abdomen. . . . . 1-9 Non-rigid matching of intra-operative brain data . . . . 2-1 2-2 2-3 2-4 2-5 2-6 2-7 2-8 2-9 2-10 2-11 2-12
Surfaces of voxel- and mesh-representations of the prostate A T -vertex . . . . Poorly-shaped tetrahedra . . . . Cube subdivision into tetrahedra . . . . Subdividing tetrahedra . . . . The most common ways a tetrahedron is intersected. . . . Mesh smoothing . . . . Edge collapse . . . . Edge sw ap . . . . Example sphere meshes . . . . Example amygdala-hippocampus meshes . . . . Example Heschyl's gyrus mesh . . . .
18 19 20 21 23 24 26 27 29 . . . . 32 . . . . 34 . . . . 35 . . . . 38 . . . . 39 . . . . 41 . . . . 42 . . . . 44 . . . . 45 . . . . 51 . . . . 51 . . . . 51
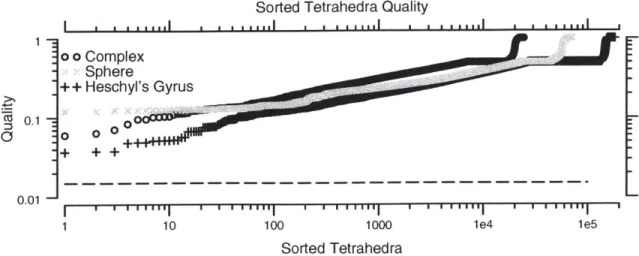
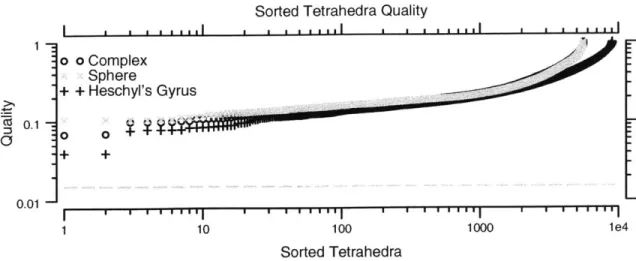
2-13 2-14 2-15 2-16 2-17 2-18 2-19 2-20
Quality plot of a mesh . . . . Mesh smoothing results: Heschyl's gyrus . . . . . Mesh smoothing results: sphere . . . . Mesh smoothing results: complex . . . . Quality plot of compact mesh . . . . Thin slice through compact mesh representations Example of template meshing . . . . Multi-resolution meshes . . . .
3-1 Surface of manually segmented amygdala-hippocampus complex . . . 3-2 Illustration of volumetric attraction . . . . 3-3 Compact sphere representation . . . . 3-4 Representations used in shape matching. . . . . 3-5 Illustration of the sparsity structure of the elasticity matrix . . . . 3-6 Illustration of challenges in obtaining convergence of the non-rigid
m atcher .. . . . .. . . .. .. . . . ... . ... . 3-7 Location of the left amygdala-hippocampus complex in the brain . 3-8 Correspondences of six matched amygdala-hippocampus complexes 3-9 80% Hausdorff distance between the deformable model and the target 3-10 3-11 3-12 3-13 4-1 4-2 4-3 4-4 4-5 4-6
Illustration of errors in non-rigid shape matching... Location of the left thalamus complex in the brain... Thalamus correspondences . . . .
Hausdorff distances in the thalamus matching study . . . .
Distance map representation of a complex . . . . Illustration of the challenge of aligning shapes . . . . Similarity matrix between shapes . . . . Effect of alignment methods on classification accuracy. . . Shape differences of right amygdala hippocampus complex Shape differences of left complex . . . .
. . . . 53 . . . . 53 . . . . 54 . . . . 54 . . . . 55 . . . . 56 . . . . 59 . . . . 59 62 66 66 67 69 73 75 77 78 78 79 80 80 . . . . 85 . . . . 87 . . . . 93 . . . . 96 . . . . 98 . . . . 99
4-7 Amygdala-hippocampus complex shape differences found using a linear classifier . . . . 1 0 0 4-8 Shape differences of the thalamus . . . .
Confounding effects of segmentation of MR . . . . Slice through an atlas of white matter . . . . The main steps in the segmentation algorithm . . Deformable tetrahedral mesh . . . . Convergence of updated tissue probabilities . . . . Eigenvectors of the thalamus deformable model . Variance captured by PCA of the right thalamus . Challenges in matching deformable models to the
. . . . 102 . . . . 108 . . . . 111 ... .. . ... 116 . . . . 117 . . . . 121 . . . . 122 . . . . 123
results of the EM-M RF algorithm. . . . . 5-9 3D models of the thalamus found using an EM-MRF algorithm, man-ually, and with the addition of shape information . . . . 5-10 Comparison between an automatic segmentation of the thalamus and a manual segmentation without shape prior . . . . 5-11 Comparison between an automatic segmentation of the thalamus using shape information and a manual segmentation . . . . 5-12 5-13 5-14 6-1 6-2 6-3 6-4 6-5 6-6 6-7 6-8 Dice similarity comparison . . . . Hausdorff similarity comparison . . . . A brain segmentation . . . . Block matching example . . . . Images of a pelvis, brain and abdomen. . . Adapting mesh to anatomy . . . . Adaptive flow chart . . . . Adaptive representation of a vector field Representation of a sinusoidal vector field Thin slice through a mesh of an ellipse . . Non-rigid matching of two ellipses . . . . . 124 126 126 126 127 128 129 . . . . . 135 . . . . . 136 . . .. ... 139 . . . . . 140 . . . . . 141 . . . . . 143 . . . . . 144 . . . . . 150 5-1 5-2 5-3 5-4 5-5 5-6 5-7 5-8
6-9 Non-rigid matching of segmented prostate data . . . 151 6-10 Non-rigid matching of intra-operative brain data . . . 152 6-11 Mesh adaptation for the brain image . . . 153 6-12 Comparison of manually labeled fiducials in a brain image sequence . 155 6-13 Female pelvis non-rigid matching sequence . . . 157 6-14 Points at which the pelvis warping was validated. . . . . 158
List of Tables
2.1 The effect of edge collapse on example meshes . . . . 57
4.1 Comparison of classifiers based on distance maps and displacement fields 94 4.2 The effect of volume normalization on classifer accuracy . . . . 94 4.3 Cross training accuracy for the thalamus . . . . 103
Chapter 1
Introduction
Advances in non-invasive imaging have revolutionized surgery and neuroscience. Imag-ing techniques such as magnetic resonance imagImag-ing (MRI) and computed tomography (CT) scanning yield three-dimensional images of the insides of living subjects. This information allows physicians to diagnose and plan treatment without opening the patient or to carefully plan surgery to avoid important anatomy. Additionally, re-searchers can use these images to investigate anatomical structures in living patients, rather than in cadavers. In fact, not only can scientists investigate the structure of anatomy, but through techniques such as functional magnetic resonance imaging (fMRI), they can infer the function of anatomy.
Neuroscientists and clinicians have created a demand for medical image process-ing tools. One example is the desire for tools that automatically register three-dimensional images such as those in Figure 1-1. Physicians sometimes look for changes
between two images by overlaying them. However, because of differences in patient positioning during each image acquisition, images generally need to be aligned be-fore being compared. Physicians would like to avoid the somewhat tedious process of manual registration. Instead, they prefer an automatic way to register volumetric images.
In many cases, even after alignment, simply overlaying two images is not sufficient to compare them. For example, a common procedure to detect tumors in the liver is to inject an agent into a patient that preferentially enhances tumors in MRI images.
Figure 1-1: From left to right: A slice through a three-dimensional CT of a human head; a slice through a three-dimensional MRI (T2) of the same subject; a checker-board visualization of the two images overlaid; a checkerchecker-board visualization of the two images overlaid after a manual registration. Without registration (center right) the nose and ears and eyes are clearly not registered properly. It is therefore difficult to compare the images by overlaying them. The manual rigid registration (right) makes comparing the images much easier.
To decide if a region contains tumor, doctors will compare two images in time and see if that region becomes brighter. However, as the liver expands and contracts upon breathing [Ros02], the regions move and deform. Thus, overlaying two images of the same liver at different points in the breathing cycle makes comparing the two images difficult. In order to readily make that comparison, one would like to non-rigidly register the images. Non-rigid registration is the process of registering two images while allowing the images to deform into each other.
Not only is non-rigid registration useful in comparing images of the same subject, it is useful in comparing images of different subjects. Physicians are interested in comparing images of different subjects to find differences in anatomy due to biological processes such as aging or disease. For example, there is evidence that the size and shape of some anatomical structures in the brain correlate with the presence or absence of schizophrenia [SKJ+92]. One way to compare anatomical structures across subjects is to use non-rigid registration. An example of anatomical structures to be compared is shown in Figure 1-2.
Non-rigid registration has another important application other than comparing images; it is also used to map information from one image to another. This second application is of particular importance for intra-operative imaging. Intra-operative
Figure 1-2: The surfaces of four left thalami. The examples were taken from subjects in a study trying to correlate the presence of schizophrenia with the shape of the thalamus. Note the differences in size between the thalami, as well as the difference in the shape of the "hook-shaped" part of the thalamus (the lateral geniculate nucleus). The left thalamus is a structure in the left part of the brain.
imaging is the process of acquiring new images during surgery. These images give surgeons updated information about the location of deforming tissues. Unfortu-nately, intra-operative images are often of lower quality than pre-surgical images'. Additionally, while physicians have time to annotate pre-operative data with surgi-cal path planning and segmented structures, they rarely have time to stop surgery and annotate intra-operative data. An example of the need to map information onto intra-operative data is shown in Figure 1-3 for the case of a prostate surgery. The major zones of the prostate have carefully been identified in an image taken weeks before surgery (left). Physicians are would like to target the peripheral zone in the prostate because they believe it is the source of cancer growth. Unfortunately, the intra-operative image (right) does not have sufficient contrast to view the separate zones. This surgery would benefit from updated information on the location of the peripheral zone; that information could be obtained using non-rigid registration.
While surgeons could benefit greatly by non-rigidly mapping augmented, high-contrast, pre-operative data to intra-operative data, in practice non-rigid registration is rarely used during surgery. Most non-rigid registration algorithms require several
'The lower quality results partly from the fact that during surgery, physicians are unwilling to wait the long periods necessary to obtain high contrast images. Also important is that in order to make surgery and imaging compatible, intra-operative imaging equipment can be less sensitive than typical imaging equipment. For example, intra-operative MRI imagers use significantly lower magnetic fields than normal imaging magnets, resulting in lower contrast images.
Figure 1-3: Left: pre-operative image of a male pelvis. The prostate central zone has been outlined in blue; the prostate peripheral zone has been outlined in red. Right: image taken just before surgery commences. In the right image, the peripheral zone is difficult to see. Physicians would benefit by knowing its location. They could obtain that information by non-rigidly registering the pre-operative image (left) to the inter-operative image (right).
hours to complete, making them unusable during surgery.
In summary, neuroscientists and clinicians have created a demand for medical image processing tools. One such tool is non-rigid registration which is useful for comparing images across subjects, in comparing images of the same subject, and in general mapping information from one image to another. It is our goal to make contributions to the field of non-rigid registration of three-dimensional images. In particular, we will develop methods to compare anatomical structures across subjects and to make a non-rigid registration algorithm that is fast enough to be used during surgery.
1.1
Motivating Concepts
To create efficient non-rigid registration algorithms, we note that in many fields of research, the use of a representation that is related to the structure of a problem leads to compact descriptions and efficient algorithms. For example, variations in camera images can be dominant in any direction. Freeman found that by using filters that could be aligned to the direction of variation, he could make far more compact descriptions of the image and more effective algorithms based on that representation
[Fre92].
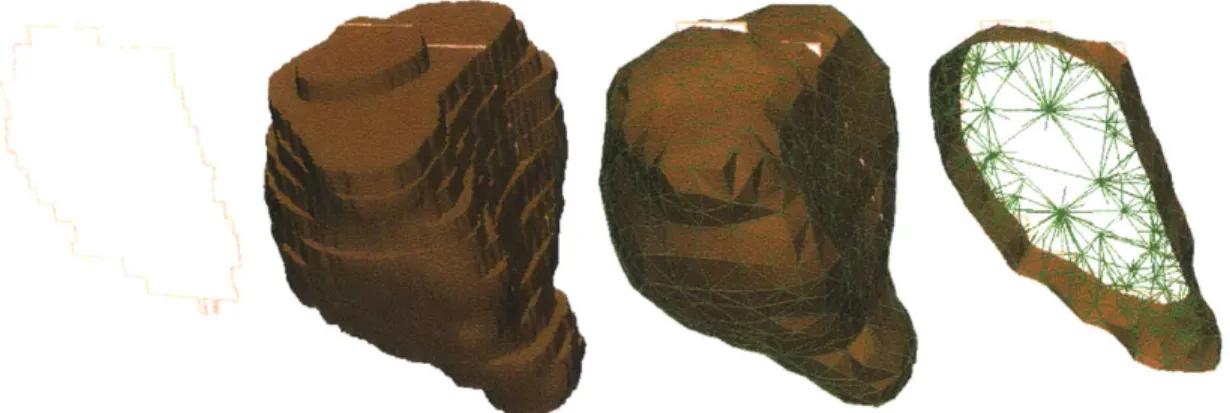
As another example, when solving Maxwell's equations, the potential due toFigure 1-4: Left: Slice through a voxel representation of a prostate. Center Left: Surface of a voxel representation of a prostate. The region encompasses 80,000 voxels. Center Right: Surface of a tetrahedral mesh representation of a prostate using 3500 tetrahedra. Right: thin slice through the mesh. The representation using tetrahedra is roughly 20 times smaller and better represents the expected smooth surface of the anatomy.
a source of charge varies quickly close to the source, and slowly far away. Multipole methods effectively use representations that are adapted to this rate of variation [Phi97]. By using such representations, multi-pole methods for solving Maxwell's equations can be made much more computationally efficient than other methods.
In medical images, the primary structure is due to anatomy. We believe that using representations that conform to the shapes of anatomical images will lead to compact representations of data, as well as efficient algorithms. We therefore begin by developing compact representations of anatomical objects using tetrahedra. Those tetrahedra will facilitate the creation of efficient finite element based methods to non-rigidly align medical images.
1.2
Compact Representations of Anatomical
Struc-tures
Images of anatomical structures frequently have uniform intensity interiors and smooth surfaces. A typical medical object is segmented and then described using tens of thou-sands of voxels, with each voxel storing redundant data (a voxel is the name given to a point in a three-dimensional image). Such regions are inefficiently described
using a uniform grid of points. In fact, not only is the description inefficient, but the resulting surface of such a representation is described as an unrealistic jagged edge (see Figure 1-4). We seek a volumetric representation that more accurately represents smooth surfaces while representing uniform regions efficiently. We propose using vol-umetric meshes to describe medical objects. Volvol-umetric elements have the ability to compactly represent large uniform regions. The surfaces of such elements can be chosen to correspond to the surfaces of medical objects, so that smooth surfaces can be well described. The interior of medical objects can be filled with a small number of volume elements. For these reasons, volumetric meshes should represent medical data more efficiently than uniform grids of voxels.
We develop methods to create tetrahedral meshes to describe anatomical struc-tures. We choose tetrahedra because they are the simplest three-dimensional volu-metric element; compared to other voluvolu-metric elements with more nodes, tetrahedra are relatively easy to manipulate. However, as we describe in Chapter 2, there are numerous challenges to overcome to obtain a good tetrahedral representation of an object. Figure 1-4 compares a voxel based representation of a prostate and a repre-sentation using a mesh of tetrahedra we created. The voxel based reprerepre-sentation uses 80,000 voxels. The tetrahedral mesh based representation is much smaller; it uses only 3500 tetrahedra.
1.3
Non-rigid Matching of Anatomical Structures
Having developed compact representations of an anatomical structure, we proceed to use those representation to develop fast algorithms to non-rigidly register anatomical structures from different subjects. As tetrahedra facilitate the creation of efficient algorithms based on finite element methods (FEM), we develop FEM based methods to find a registration.
Finding a good non-rigid registration between two medical shapes can be chal-lenging because medical shapes typically have smooth surfaces. As shown for the thalamus in Figure 1-2, it is not obvious where points in one smooth surface should
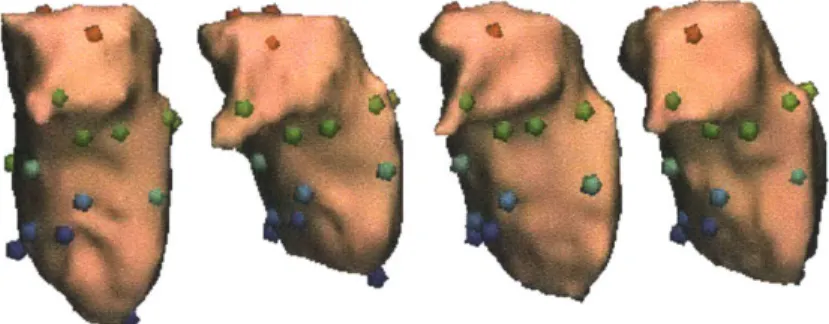
Figure 1-5: The surfaces of four left thalami with colored spheres indicating corre-spondences.
lie on a second such surface. To overcome this challenge, we register anatomical shapes while minimizing an elastic energy. That is, during the matching process, we treat one of the objects like a linear elastic material. We then try to find a trans-formation from the first shape to the second that maximizes overlap and minimizes a linear elastic energy. Intuitively, in a good match, high curvature regions in one object should match to high curvature regions in a second object. Matching by mini-mizing a linear elastic energy should accomplish this goal. Matching a sharp portion of one surface against a sharp portion of another surface results in a lower energy configuration than flattening a region to match against a less sharp adjacent region.
Unfortunately, such linear-elastic matching leads to a set of ill-conditioned equa-tions that are difficult to solve. However, while the equaequa-tions may be poorly condi-tioned, the problem is not. We present a fast, linear-time algorithm that overcomes the ill-conditioned nature of the equations. Because we use compact tetrahedral representations during this process, the resulting algorithm generally finishes in less than 30 seconds on a desktop machine. Using the non-rigid registration algorithm, we can take anatomical shapes such as the thalami shown in Figure 1-2, and find correspondences on the surface such as those shown Figure 1-5.
Once anatomical shapes have been registered across subjects, we use the resulting transformations in two, applications. First, we use the transformation as a way to compare shapes in a morphological study. Second, we create a segmentation algorithm that uses the measured variability in a set of structures to identify new examples of structures.
Figure 1-6: Shape differences of the left thalamus between normal and first episode schizophrenic subjects. The thalami are from three normal subjects. The color coding indicates how to change the surface of the thalami to make them be more like the left thalamus in schizophrenic subjects.
1.3.1
Morphological Studies
As we have already described, researchers are interested in comparing anatomical structures to correlate shape with biological processes, such as the effects of aging and disease. We show that correspondences found using the method discussed in the last section are effective for use in a study of shape.
We develop methods to find shape differences between two groups. We choose a reference shape and then represent each other shape using the displacement field from the reference to the other shape. We then form a classifier using support vector machines to separate the two groups of shapes. Finally, using the methods developed by Golland et al. [GGSKO1], we take derivatives of the classification function to determine shape differences.
In this work, we use these methods to find shape differences in anatomical struc-tures in the brain between groups of normal subjects and groups of schizophrenic subjects. In particular, we examine the amygdala-hippocampus and the thalamus. For the amygdala-hippocampus, we not only show that displacement fields are effec-tive at determining shape differences, but they are more effeceffec-tive than methods based on another representation [Gol01]. For the thalamus, we find shape differences that were hitherto unknown. Those shape differences are shown in Figure 1-6.
1.3.2
Segmentation
The morphological studies that we perform are based on manual segmentations of shape. That is, a researcher identified voxels in the image that she believed contained the tissue of interest. Manual segmentation is a tedious, time consuming and error prone task [Dem02, KSG+92]. For studies involving tens of cases, manual segmenta-tion may be a viable opsegmenta-tion. However, for studies involving hundreds or thousands of cases, manual segmentation can be impractical.
For large studies, it is desirable to use automatic methods to identify anatomical structures. Unfortunately, automatically identifying tissue types in medical images has proven challenging. That challenge is partly due to noise and image inhomo-geneities, and partly due to the nearly invisible borders between some anatomical structures.
Automatic, intensity based segmentation methods have been very successful in dealing with some of those challenges. In particular, such methods are able to handle imaging noise and image inhomogeneities. However, these methods have difficulties finding low contrast borders. Deformable models are a second class of methods that, conversely, often work well with nearly invisible boundaries. These methods create a generative model based on training representations of shape, and try to segment by fitting that generative model to a new image. But, these methods also have draw-backs. First, it is challenging to accurately model the variability in many structures. Second, these methods are typically trained on images from one imager. They there-fore have difficulties with other types of images, or even other imagers of the same type.
We develop a new method that combines the deformable model and intensity based methods. We use an intensity based method to capture all information in the image that is known about the various tissue classes to be segmented. That method produces an image of probabilities showing which voxels are most likely in which tissues. We then fit a deformable model to those tissue probabilities. The resulting fit can be given back to the intensity based method so that method can incorporate
(a) Prior Method (b) New Method (c) manual segmentation
Figure 1-7: 3D models of the right (maroon) and left (violet) thalamus generated by (a) existing intensity based algorithm, (b) the new algorithm and (c) a manual segmentation. Note that the thalami produced with a shape prior (b) are significantly smoother than those produced without a shape prior, which have protrusion and sharp edges.
all information.
To accomplish that fit, we create a deformable model based on the correspondences found by our non-rigid registration algorithm. We also create a new non-rigid regis-tration algorithm to fit the deformable model to the image of probabilities produced by the intensity based method.
We show that adding shape information into an intensity based method has signifi-cant advantages over a such a method alone. We segment the thalamus within an MRI of the brain and find that our new method yields boundaries which are significantly smoother than an intensity based method. Also, the new method yields boundaries which are significantly closer to those of manual segmentations. A comparison of the three segmentations can be found in Figure 1-7.
1.4
Non-rigid Registration of Images
In the research discussed up to this point, we adapted representations to anatomical structures that had been previously identified. In this section, we describe methods to non-rigidly register images, where anatomical structures have not previously been identified.
To make a fast non-rigid registration algorithm, we make the key observation that the information most useful for non-rigid registration is not uniformly distributed in
Figure 1-8: From left to right: Axial MRI of male pelvis, coronal MRI of a brain, and axial abdomen CT. These three images are examples of medical data appearing nearly uniform over large regions. In the pelvis, the muscle and fat has roughly uniform intensity. The white matter in the brain is nearly uniform intensity. In the CT image, the interior of the colon (in black), the liver (lower right), as well as other soft tissue all appear nearly uniform.
an image; it is generally concentrated at the boundaries of anatomical structures. As shown in Figure 1-8, large fractions of the image have uniform intensity (or texture). One would expect that by finding the displacement field in those regions, one could accurately capture the majority of the displacement field, which could be interpolated into regions of uniform intensity. Thus similarly to previous methods we automatically adapt representations to the anatomy in the image.
We also make a second key observation: the displacement fields between images need not be represented at the same resolution everywhere. Displacement fields be-tween pre-operative images and intra-operative images are generally continuous and smooth (though there are exceptions which can be dealt with explicitly such as in [MSH+02].) and slowly varying in large portions of the image. For example, a cur-sory review of brain warping papers suggests that displacement fields often change very quickly near an incision, but much more slowly far away it [FMNWOO, HRS+99, MPH+00, SD99]. Because displacement fields are mostly smooth, regions of slowly varying displacements can be accurately described using a small number of vectors that are interpolated within those regions. Thus, one way to create a compact repre-sentation of a displacement field is to identify regions of slowly-varying displacements and to represent those regions with as few vectors as possible.
a displacement field using the nodes of a mesh of tetrahedra. The nodes of the tetrahedral mesh can be created using different densities in different parts of the image, and selectively adapted as needed. Furthermore, the surfaces of the tetrahedra can be aligned to the surfaces of anatomical structures in the image. If segmentations are available, it is straightforward to include the surfaces of such regions directly in the mesh. If segmented regions are not available, the nodes of the mesh can be moved to places of large intensity variations where information for non-rigid registration is maximized.
We create a non-rigid registration algorithm based on this representation. The resulting algorithm has a computational cost that is dominated by the number of nodes in the mesh (often roughly 10000), rather than the number of voxels in an image (nearly 10 million). For many non-rigid registration problems, we can find a transformation from one image to another in five minutes. As example of the results of the algorithm is shown in Figure 1-9. Note how the mesh is concentrated in the region of largest deformations.
1.5
Contributions
In this thesis, we are concerned with using the structure of anatomical images to make efficient non-rigid registration algorithms. To that end, we contribute the following algorithmic developments in this thesis:
1. Methods to compactly represent medical shapes with tetrahedra. 2. Methods to quickly non-rigidly register anatomical shapes.
3. Methods to use the results of the non-rigid algorithm to form a representation of shape to be used in a morphological study.
4. A segmentation algorithm using the correspondences found with the non-rigid registration algorithm.
5. An adaptive non-rigid registration algorithm that adapts to both anatomy and to the displacement field so that the dominant computational cost need not scale linearly with the number of voxels in an image.
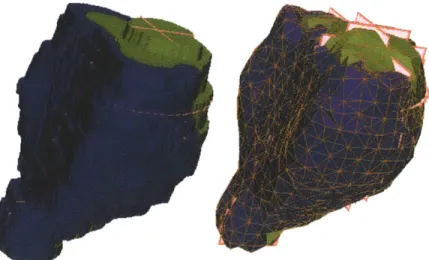
Target Image to be warped
Result of warping Mesh used to represent the displacement field Figure 1-9: Top left: MRI of a brain taking during surgery with edges highlighted. Top right: MRI taken of the same brain later in the surgery, with the edges from left image overlayed. Bottom left: the result of warping the top right image onto the top left image, with the edges of the top-left image overlaid. The non-rigid registration algorithm has effectively captured the deformation. The bottom right shows a mesh used in the registration process. Note how the mesh is very coarse in most areas, and fine in areas near the incision where most of the deformation is.
1. Correlating shape differences between the presence and absence of schizophrenia with the shape of the thalamus and the shape of the amygdala-hippocampus complex.
2. An automatic brain segmentation algorithm.
3. A non-rigid registration algorithm that is fast enough to be used during surgery.
1.6
Conclusions
We start by making representations that adapt to anatomy which we then use to create efficient algorithms to match anatomical structures. Using the results of that algorithm, we create effective methods to find shape differences in a morphological study and an effective segmentation algorithm.
We also recognize that displacement fields between images are often slowly chang-ing in large portions of the image so that dense representations of a displacement field need not be used in the entirety of the image. Using these observation and adapting our representations to anatomy, we create a fast non-rigid registration algorithms.
Overall, we use compact representation that adapt to the structure of the non-rigid registration problem in order to make fast and effective algorithms.
Chapter 2
Forming Tetrahedral Meshes
The main objective of this thesis is to create compact descriptions of medical ob-jects in order to make computationally efficient non-rigid registration algorithms. In this chapter, we focus on finding compact representations of anatomical structures. Anatomical structures often have uniform intensity interiors and smooth surfaces. A typical medical object is described using tens of thousands of voxels, with each voxel effectively storing redundant data. Not only is the representation inefficient, but the resulting surface of such a representation is an unrealistic jagged edge. Figure 2-1 shows an example of the prostate central and peripheral zone being described using this representation.
We seek a description of a region that more accurately represents smooth surfaces and represents uniform regions efficiently. We propose using volumetric meshes-±o describe medical objects. Volumetric elements have the ability to compactly represent large uniform regions. The surfaces of such elements can be chosen to correspond to the surfaces of medical objects, so that smooth surfaces can be well described. The interior of medical objects can be filled with a small number of volume elements. For these reasons, volumetric meshes should represent medical data more efficiently than uniform grids of voxels.
We have chosen to use meshes of tetrahedra. Tetrahedra are a good choice to represent medical data since it is particularly straightforward to use them to describe smooth surfaces. Also, tetrahedra are the simplest three dimensional volumetric
Figure 2-1: Left: Surface of voxel representation of a prostate central (green) and peripheral zone (blue). The region encompasses eighty thousand voxels. Right: the same region represented after smoothing the left surface and filling with tetrahedra. The brown lines represent the surface edges of the mesh. The region is described by seven thousand tetrahedra. The tetrahedra-based representation is much smaller than the voxel-based representation and better describes the expected smooth surface of the prostate.
element; compared to other volumetric elements with more nodes, tetrahedra are relatively easy to manipulate. Figure 2-1 shows a prostate represented using a tetra-hedral mesh; the resulting representation uses a factor of 10 fewer nodes than the voxel based representation and better describes the smooth surface of the prostate.
Tools to fill shapes with tetrahedra are typically designed to process surfaces from Computer Aided Design (CAD) programs. Medical data has two key properties not typically found in CAD data. First, the surfaces of medical structures are often irregular, including non-convex regions. Second, it is usually the case that any set of nodes that describe a medical object's surface are equally acceptable descriptions of that surface. Therefore, it is not important that the nodes of a tetrahedral mesh exactly overlap those of the original surface, as long as the surface is well described. Here, well described means that the volume overlap between the tetrahedral mesh and the surface interior is near 100%, and the distance from the surface to the surface of the mesh is small enough.
In this chapter, we begin by describing the goals of a tetrahedral mesher for medical data. We then review desirable properties of tetrahedral meshes. We discuss
the mesh formation methods we will use, and mesh improvement methods. We then present resulting tetrahedral meshes, showing that the quality of the meshes is above our target threshold.
2.1
Goals
In this chapter, we create a toolkit of meshing techniques. We incorporate a subset of those techniques into two different algorithms to satisfy the needs of Chapter 3 and Chapter 4.
For Chapter 3, we will create deformable models from tetrahedral meshes to de-form a medical shape from one subject into the same medical shape in another. Thus, we will solve a set of partial differential equations (PDE) on the tetrahedral mesh. As we have no prior information on the variability of one part of the surface of a struc-ture over another part, we desire a roughly uniform description of the surface of the structure. That is, we desire the faces of the tetrahedra that determine the surface to be approximately the same size. To create an efficient algorithm, we will also desire the interior of the structure to be as sparse as possible. Thus, for Chapter 3, we will create a approximately uniform description of the surface at a resolution specified by the programmer, while making the interior described as sparsely as possible.
In Chapter 4, we will desire not only a roughly uniform tiling of the surface, but a uniform description of the interior. In that chapter, we will use the displacement field of the deformable model as a representation of shape. As we desire a dense sampling of the displacement field inside the shape, we will create meshes with roughly uniform node density in the interior. Thus, a second algorithm in this chapter will create a roughly uniformly description of the interior and surface of a structure.
2.2
Desirable Properties of Tetrahedral Meshes
Tetrahedral meshes are generally used to solve partial differential equations (PDE). Typically, the tetrahedra are finite elements that represent small chunks of material.
Figure 2-2: Left: Three tetrahedra. The dot indicates a t-vertex: a vertex on the edge
of the left tetrahedron but not one of the corners of that tetrahedron. If that vertex moves a small amount as indicated by the arrow, the leftmost tetrahedron ceases to be a tetrahedron as shown in the right image.
In that role, there are several desirable properties of the tetrahedra. To review those
properties, consider the problem of solving for the final position of a block of rubber that is being compressed. To be accurate, it is clear that the volume elements de-scribing the rubber must describe the entire block. Holes in the rubber would ignore interactions between small elements of rubber. Thus, the first desirable property of a tetrahedral mesh is that it must completely fill the region being simulated.
A second desirable property of tetrahedral meshes is that no edge crossings are
allowed. An edge crossing forms what is know as a T-vertex; such a vertex is shown
in Figure 2-2. If the vertex in the figure moves, and all other vertices remain fixed,
the left most tetrahedron will cease to be a tetrahedron. There are ways to address
this problem [GKS02], but in this chapter we will avoid the additional complications of such methods by not allowing such vertices.
A third desirable property of tetrahedral meshes is that the tetrahedra be nearly
equilateral. Tetrahedra that are particularly skewed slow down and produce errors in the solutions given by partial differential equation (PDE) solvers [Ber99, FJP95]. The reason for these problems is that the equations corresponding to skewed tetra-hedra can be very poorly conditioned. Bern and Plassman classify "poorly-shaped" tetrahedra into the five classes as shown in Figure 2-3 according to dihedral angle and solid angle (Dihedral angles are the angles between triangles in a tetrahedron). In
Needle
Wedge
Sliver Cap Spindle
Figure 2-3: Examples of the five classes of poorly-shaped tetrahedra [BPar] . A
"needle" has the edges of one triangle much smaller than the other edges. A "wedge" has one edge much smaller than the rest. A "sliver" has four well-separated points that nearly lie in a plane. A "cap" has one vertex very close to the triangle spanned by the other three vertices. A "spindle" has one long edge and one small edge.
each case, a small motion of one vertex relative to the average length of a tetrahedron edge can cause the tetrahedron to have zero volume or "negative volume". Returning to the rubber simulation example, this situation corresponds to a small piece of the rubber compressing to zero volume and then continuing to compress, an unphysical result.
To avoid numerical problems, it is important to assure the quality of the tetrahedra in a mesh. There are several useful quality metrics [Ber99, LDGC99] which measure the skewness of tetrahedra. The metrics are 0 for a degenerate tetrahedron and 1
for an equilateral tetrahedron. We have chosen to use the following quality metric
[LDGC99]:
Quality = sign (Volume) 37 4 (2.1)
(4=
Area ()3where 37 is a normalization factor and the sum in the denominator is over the squared areas of each face of the tetrahedron and the sign of the volume is the sign of the
de-terminant of the scalar triple product used to calculate the volume of the tetrahedron.
This measure is one of several that becomes small for all five types of poorly-shaped tetrahedra, and becomes 1 for an equilateral tetrahedron. The measure also has the property that it becomes negative if a tetrahedron inverts.
For a given PDE on a particular domain, it is generally desirable to find a solution using as few computations as possible. It is therefore desirable to create tetrahedral
meshes that lead to as few computations as possible when solving a PDE. When
will result in two 3x3 non-zero sub-matrices in the solution matrix. The sub-matrices relate the displacements of the two nodes in the mesh. As we will be seeking fast algorithms, we would like to design meshes with as few edges as possible for a given node density. Similarly, for a given number of nodes, we often would like to minimize the number of tetrahedra in the mesh. When forming the solution matrix, calculations must often be done for every tetrahedron.
However, the number of non-zero entries in a matrix and the size of the matrix are not the only properties that determine the speed of solving a system of equations. Poorly shaped tetrahedra result in poorly conditioned matrices that can make itera-tive matrix solvers noticeably slower than they would be for well-shaped tetrahedra [BPar]. It is typically worthwhile to add additional tetrahedra and additional nodes in order to have well shaped tetrahedra.
In summary, we seek to create a mesh that (1) completely fills the region of interest, (2) has no T-vertices, (3) contains high quality tetrahedra, and (4) leads to as few computations as possible in a finite element simulation.
2.3
Prior Work
There are several publicly available, open-source tetrahedral meshers [Gei93, Owe98, SFdC+95], most of which are specialized for particular types of problems. Medical shape data has two important properties. First, surfaces are typically derived by running marching cubes [LC87] on a segmented volume and then smoothing and decimating the resulting surfaces [GNK+01, SMLT98]. The resulting nodes are not particularly important; that is, any set of nodes that describes the surface of the object is sufficient. Therefore, it is not critical that nodes of the surface mesh are also nodes in the volumetric mesh. A second property of medical shapes is that their surfaces can be complicated and non-convex. This causes problems for some less-sophisticated Delaunay meshers that are unable to handle this property.
Ferrant [Fer97] found that the meshers he tested on medical data were unable to produce desirable meshes. These meshers were unable to handle the non-convexity of
the medical data, produced many poorly-shaped tetrahedra, or produced many very small tetrahedra. He therefore wrote his own mesher by cutting tetrahedra using a marching tetrahedron algorithm.
We tested Ferrant's mesher on several anatomical structures and found the mesher lacking in some respects. In earlier versions of Ferrant's mesher, many of the tetra-hedra were strongly skewed. In later versions, Ferrant et al. [Fer97] introduced a Laplacian smoothing term, which greatly improved the shape of the tetrahedra in the cases he tested. Unfortunately, Laplacian smoothing can often worsen the quality of meshes [ABE97, DjiOO, Owe98]. We therefore did not further pursue the Ferrant mesher. Instead, we pursue methods to create our own mesher.
2.4
Mesh Formation
The goal of the tetrahedra mesher is to fill space with tetrahedra, conforming to a surface while creating as few skewed tetrahedra as possible (see Figure 2-3). There are three general methods for forming tetrahedral meshes [Owe98]: Delaunay tetrahe-dralization of pre-selected points, advancing front based methods, and oct-tree based methods. Each method has advantages and disadvantages.
Delaunay triangulation attempts to find the tetrahedralization of a given set of points such that the sphere through the four points of each tetrahedra (the circum-sphere) contains no other points inside it. Generally, the resulting meshes are of high quality, though they often contain sliver-shaped tetrahedra [BPar]. The major difficulty for such methods is choosing the location of the points to be meshed; the decision process can be complicated.
Advancing front methods are very similar to Delaunay methods. In Delaunay methods, all of the nodes are placed first and then meshed. In advancing front methods, new nodes are added to the mesh one at a time by placing them outside the boundary of an existing mesh and adding tetrahedra. These methods face the same challenges of Delaunay methods in that deciding where to place points can be difficult.
/
~!
/
Figure 2-4: Two ways to subdivide a cube into tetrahedra. On the left, a cube is subdivided into five tetrahedra, of which only the center is shown. On the right a cube is subdivided into twelve tetrahedra by adding a point in the center. Only four tetrahedra are shown, the remaining eight can be created by adding an edge on each face.
Oct-tree based methods involve dividing space into cubes and sub-dividing the cubes into tetrahedra. Using these methods, it is straightforward to form a mesh. The challenge lies in making the mesh conform to the structure of interest. We pursue oct-tree methods because they are simplest to implement. Also, oct-tree methods will allow the user to specify at what resolution he wishes to represent a surface.
We build meshes by filling space with cubes and then sub-dividing the cubes into tetrahedra in a consistent way. We divide all cubes into five or all cubes into twelve tetrahedra as shown in Figure 2-4. For subdivision into five tetrahedra, an alternating pattern of the subdivision shown, and one rotated 90 degrees relative to an edge of the cube is necessary for a consistent mesh. For twelve tetrahedra per cube, no such tiling is necessary.
2.5
Multiple Resolution Meshes
It is often important to have meshes with a spatially varying density of nodes. For example, for meshes containing multiple shapes one might want one shape to contain more tetrahedra than another. For some shapes, one might want smaller tetrahedra near the surface and larger tetrahedra in the interior. Or, one may wish more tetra-hedra in regions of high curvature of a surface. In this section, we briefly describe
Figure 2-5: Common methods of subdividing a tetrahedron. From left to right: edge bisection which splits a tetrahedron in 2; face trisection which splits a tetrahedron in 4; adding a point in the middle, which splits a tetrahedron in 4; and bisecting all the edges which splits the tetrahedron in 8. Note that only the third method does not affect the neighboring tetrahedra.
methods for making meshes with different sized tetrahedra. A review of such methods is found in [SFdC+95].
There are several ways of forming multi-resolution tetrahedral meshes within oct-tree mesh generation. The first involves subdividing cubes before converting them to tetrahedra [SFdC+95]. The challenge in this method is making sure that after dividing the different size cubes into tetrahedra, the resulting tetrahedra at the surfaces of the cubes share faces rather than crossing in T-junctions. This result can be obtained using complicated case-tables or using local Delaunay triangulation. We do not pursue these methods, with one exception. It is straightforward to divide some cubes into five and some cubes into twelve tetrahedra. This ability allows us to generate meshes with roughly a factor of 2 variation in node and tetrahedra density.
A second method to subdivide meshes is to place nodes and then locally re-mesh. Usually, remeshing is done using Delaunay methods. A third technique to making multi-resolution meshes is to modify an existing mesh by subdividing the mesh. These methods include: edge bisection, face subdivision, placing a point in the middle of a tetrahedra, and subdividing all the edges of a tetrahedron (Figure 2-5). The main challenge with using these methods is that repeated application of a method can lead to arbitrarily low quality tetrahedra [AMPOG]. Or conversely, an algorithm can over-refine a region in order to guarantee good-quality tetrahedra [AMPOO, SFdC+95].
We have implemented three simple but effective methods to subdivide tetrahedra (Figure 2-5). The first two are bisection and edge collapse. To subdivide via the bisection method, we serially bisect the longest edge in the region subject to the
constraint that the resulting tetrahedra are of quality above a threshold. Bisecting the longest edge of a tetrahedron does not guarantee good quality tetrahedra. But in practice, the method is useful. The reverse process is edge-collapse. As in bisection, we serially collapse the shortest edge in a region subject to the constraint that the resulting tetrahedra are of high quality. Edge collapse is further described in Section 2.7.2.
The final method is octasection, which subdivides all the edges of a tetrahedron. In this method, many tetrahedra are subdivided simultaneously to achieve large vari-ations in tetrahedral density. The major disadvantage of this method is that neigh-boring tetrahedra of tetrahedra that have been subdivided are also subdivided. For repeated iterations of octasection, these neighboring tetrahedra can become very low quality. This problem has led to the "red", "green" tetrahedron subdivision method. Tetrahedra that are octasected are labeled red. Tetrahedra that are subdivided be-cause only some of their edges were subdivided are labeled green. In subsequent iterations of this method, if a green tetrahedron needs to be further subdivided, the last subdivision of that tetrahedron is undone and replaced by octasection and then the new subdivision takes place. The red-green method is generally stable, though it leads to large increases in tetrahedral density.
2.6
Fitting a Mesh to a Surface
After forming an initial mesh, we adapt that mesh to an object by intersecting the edges of the mesh with the surface of the object. If the object is specified as labeled voxels, intersections are found by checking for edges in which the two nodes of the edge overlap different labels. If the surface is specified as a polygonal surface mesh, we place the surface mesh in a object oriented bounding box (OBB) tree [GLM96] and intersect the OBB tree with an oct-tree of the edges of the mesh.
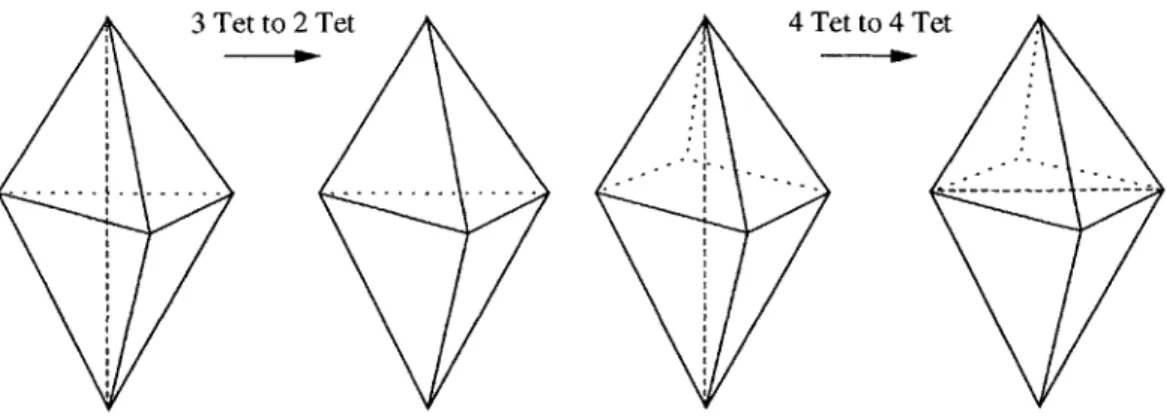
Once intersections are found, one subdivides the tetrahedra, introducing new nodes at intersections. There are 26 = 64 different ways the six edges of the tetrahe-dra can be intersected. Taking into account symmetries, there are 11 configurations