HAL Id: hal-01447715
https://hal.archives-ouvertes.fr/hal-01447715
Submitted on 1 Feb 2017
HAL is a multi-disciplinary open access
archive for the deposit and dissemination of
sci-entific research documents, whether they are
pub-lished or not. The documents may come from
teaching and research institutions in France or
abroad, or from public or private research centers.
L’archive ouverte pluridisciplinaire HAL, est
destinée au dépôt et à la diffusion de documents
scientifiques de niveau recherche, publiés ou non,
émanant des établissements d’enseignement et de
recherche français ou étrangers, des laboratoires
publics ou privés.
Pattern Analysis of the Kinematics in Ultrasound
Videos of the Common Carotid Artery – Application to
Cardiovascular Risk Evaluation
Guillaume Zahnd, Diane Galbrun, Sami Qorchi, Kozue Saito, André
Sérusclat, Philippe Moulin, Kazuyuki Nagatsuka, Maciej Orkisz, Yoshito
Otake, Yoshinobu Sato
To cite this version:
Guillaume Zahnd, Diane Galbrun, Sami Qorchi, Kozue Saito, André Sérusclat, et al.. Pattern Analysis
of the Kinematics in Ultrasound Videos of the Common Carotid Artery – Application to Cardiovascular
Risk Evaluation. International Forum on Medical Imaging in Asia (IFMIA 2017), Jan 2017, Tenbusu,
Japan. �hal-01447715�
Pattern Analysis of the Kinematics in Ultrasound Videos
of the Common Carotid Artery – Application to
Cardiovascular Risk Evaluation
Guillaume Zahnd
∗?, Diane Galbrun
§, Sami Qorchi
§, Kozue Saito
†, André Sérusclat
‡,
Philippe Moulin
#, Kazuyuki Nagatsuka
†, Maciej Orkisz
§, Yoshito Otake
∗, Yoshinobu Sato
∗∗Imaging-based Computational Biomedicine Lab, Nara Institute of Science and Technology, Japan
§Univ. Lyon, Université Claude Bernard Lyon 1, CNRS, Inserm, CREATIS UMR 5220, U1206, Lyon, France
†Department of Stroke and Cerebrovascular Diseases, National Cerebral and Cardiovascular Center, Osaka, Japan
‡Department of Radiology, Louis Pradel Hospital; Hospices Civils de Lyon; Université Lyon 1, Lyon, France
#Department of Endocrinology, Louis Pradel Hospital; Hospices Civils de Lyon; Université Lyon 1, Lyon, France
?zahnd-guillaume@is.naist.jp
Abstract—The clinical context of this study is the predic-tion of cardiovascular risk by analyzing ultrasound images of the common carotid artery. The principal methodological contribution of the present work is the implementation of image processing algorithms to characterize the pattern of the artery-wall spatio-temporal trajectory during the cardiac cycle. Normalized signals corresponding to the tra-jectory of the biological tissues were gathered via an initial phase of motion tracking based on Kalman filtering. The originality of the present work is the introduction of three complementary statistical approaches to interrogate these signals. First, a Machine Learning strategy was carried out with the AdaBoost algorithm to automatically identify healthy and at-risk subjects. Second, the Dynamic Time Wrapping method was applied to measure the pairwise similarity between signals and identify clusters. Third, a Principal Component Analysis was performed to randomly generate unseen patterns using Point Distribution Model-ing. A total of 84 subjects (42 healthy volunteers and 42 at-risk patients) were involved in this study. Two significantly different profile archetypes could be reconstructed from the two populations, showing the effect of the atherosclerosis pathology on the artery. Results demonstrate that the healthy and at-risk signals can successfully be classified with an accuracy of 73%. Quantification of the pairwise distance between all signals indicated that healthy patterns are more similar to each other, whereas there is a wider variability between at-risk patterns. Finally, new signals were generated using a statistical model, possibly hinting towards new patterns characteristics.
Keywords: Motion Analysis; Machine Learning; Dy-namic Time Wrapping; Statistical Shape Modeling; Ul-trasound; Carotid Artery; Cardiovascular Risk
I. INTRODUCTION
Cardiovascular diseases are the first cause of human mortality worldwide [1]. Cardiovascular risk prediction is therefore a major public health issue as well as a
particularly challenging task. Atherosclerosis, the prin-cipal disease that affects the arteries, is often quali-fied of being a “silent killer”, because its progression and evolution are tremendously complex, leading to a very high number of fatal events occurring without any premonitory sign [2]. This is extremely problematic because the performance of current methods to evaluate cardiovascular risk are limited [3], resulting in a total of 40 % of the population whose cardiovascular risk is unclear [4]. There is therefore a pressing need for novel indicators to improve cardiovascular risk prediction.
A number of algorithms and methodologies have been developed to analyze medical images in the objective to assess cardiovascular risk. More specifically, the common carotid artery (CCA) has been extensively investigated using B-mode ultrasound (US) imaging. To be clini-cally applicable and effective in the screening process, these methods must present the following qualities. First, (fully-)automatic processes are necessary to deal with large datasets and overcome the pitfalls inherent to man-ual (or visman-ual) human analysis, which is cumbersome, extremely time-consuming, and subject to variability between different analysts. Second, these algorithm have to be accurate, robust, and fully reproducible. Third, the proposed approaches must be capable of detecting very early presence of the atherosclerotic disease in asymp-tomatic subjects (i.e., years prior to the formation of the atheromathous plaque) in order to allow an appropriate preventive care strategy.
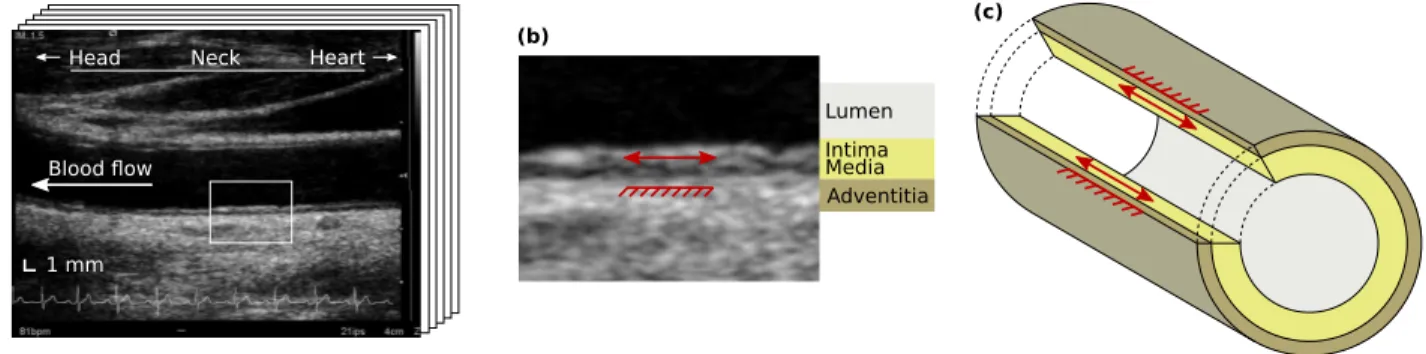
In the past decade, a few pioneering studies have started to explore the mechanical deformation of the arterial wall in the direction parallel to the blood flow [5] using a variety of motion tracking algorithms [6], [7], [8], [9], [10]. This pulsatile phenomenon, hereafter referred
to as “longitudinal kinetics” (LOKI, Fig. 1), corresponds to the shearing motion of the arterial tissues during the cardiac cycle [11]. This parameter has a colossal clinical potential, as it has been reported in several recent findings that LOKI was associated with cardiovascular risk factors [12], [13], [14], [15]. It is today hypothesized that LOKI is a strong candidate to become a valuable image-based biomarker for improved cardiovascular risk prediction at very early stage of the disease.
Most of the investigation efforts in the field of LOKI have been focused on the quantification of the peak-to-peak amplitude of the wall motion, corresponding to the total amount of displacement of the tissues during the cardiac cycle. The analysis of this parameter was successful, as a significant difference could be validated between healthy volunteers and at-risk patients [12]. Nevertheless, this approach is hindered by several limita-tions. First of all, LOKI amplitude has been demonstrated to be subject to a substantial variability along the length of the vessel [16], making local measurements irrelevant. Then, the peak-to-peak amplitude is a scalar parameter that does not reflect the pattern (speed, acceleration, direction) of the temporal trajectory. Finally, the motion amplitude may not be stable in time, as it depends on other physiological parameters such as pulse pressure.
The aim of this study is to perform an amplitude-independent analysis of LOKI by considering the pattern of the temporal trajectory of the arterial tissues during the cardiac cycle. This approach is strengthened by previous findings [17] demonstrating that the motion pattern is a reproducible parameter stable in time. A methodological framework based on statistical analysis is presented to process a collection of uni-dimensional signals that correspond to the normalized trajectory of the arterial wall. To validate our approach, the proposed method is applied in vivo on 84 subjects.
II. METHODS
This section is organized as follows. First, the pre-processing stage is detailed to describe the motion track-ing algorithm as well as the spatio-temporal normaliza-tion process. Then, three methodological contribunormaliza-tions and their respective applications are presented: 1) Ma-chine Learning is used for classification between healthy and at-risk subjects; 2) Dynamic Time Wrapping is used for quantifying the similarity between the signals from two subjects; and 3) Principal Component Analysis is used to discover new patterns. Finally, the data collection protocol that was used to acquire in vivo ultrasound images from 84 subjects is described.
A. Pre-processing
For each subject, LOKI was assessed by extracting the trajectory of the far wall using a previously validated motion tracking algorithm based on Kalman filtering [9]. This method has been implemented in a graphical user interface and is publicly available (https://www.creatis. insa-lyon.fr/carolab/). The electrocardiogram signal was used to determine the time points corresponding to the systole and extract a cropped signal corresponding to exactly one cardiac cycle, as depicted in Figure 2a,b. The peak-to-peak amplitude was measured pre-normalization and stored for further analysis.
In order to compare only the pattern between different signals without taking into consideration their amplitude or length, each individual signal was normalized both spatially and temporally (Fig. 2c). Spatial normalization was performed by shifting the amplitude of the signal so that the minimum and maximum values become 0 and 1, respectively. Temporal normalization was performed by re-sampling the signal so that its length becomes equal to 100 time units. For each signal, the area under the curve was calculated to quantify the relative amount of
1 mm Lumen Intima Media Adventitia (a) (c) (b) Neck Head Heart Blood flow
Fig. 1. Longitudinal kinetics (LOKI) of the arterial wall. (a) Temporal sequence (movie clip of several images) of the common carotid artery in B-mode ultrasound. (b) Detailed region of (a), showing LOKI (red arrow) taking place in the intima and media layers, while the adventitia layer remains quasi-static (red rake). (c) Schematic representation of LOKI in three dimensions.
displacement (RAD), as illustrated in Figure 3. Finally, two different statistical models of arterial motion were generated by averaging separately the healthy and at-risk signals, respectively.
B. Statistical pattern analysis
1) Machine Learning: The adaptive boosting
predic-tive algorithm AdaBoost [18] was implemented for fully-automatic classification of healthy and at-risk subjects. Briefly, the underlying principle of AdaBoost consists in iteratively adapting the weights of simple weak classifiers in the aim to finally generate a strong classifier that is well correlated with the ground truth annotations (i.e. the binary healthy or at-risk label corresponding to each signal). In the present framework, the features corre-sponding to each subject were generated by aggregating all the time points of the normalized signal, therefore resulting in a total of 100 features per subject. A leave-one-out scheme was then performed: a statistical model was first generated using 83 subjects (all but one), and the AdaBoost classification was subsequently applied to the remaining subject using the generated model. This
operation was repeated through the entire cohort, and the labels resulting from the classification were stored.
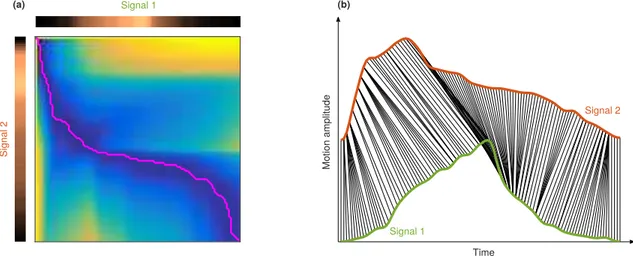
2) Dynamic Time Wrapping: Dynamic Time
Wrap-ping (DTW) is a technique used to determine the sim-ilarity between two time series [19]. In the present study, this approach was used to quantify the pairwise difference between all signals. Briefly, we developed a wrapping algorithm based on dynamic programming. The best match between two signals corresponds to the shortest path in a cumulated cost function generated from the relative difference between the coordinates of each sample of the signals (Fig. 4a). The similarity of the two compared signals is finally determined by the value of the cumulated cost map in the lower-right corner. An example of DTW result is presented in Figure 4b. It is noteworthy that DTW is conducted post-normalization, in the objective to fully capture the similarities between different patterns, while not being influenced by the amplitude or length of the analyzed signals.
3) Principal Component Analysis: A statistical shape
model was generated for both healthy and at-risk motion, using an approach based on Point Distribution Modeling
Time (normalized units) (a) 0 20 40 60 0 1 100 80 0.2 0.4 0.6 0.8 Mo tion am plitud e (nor mal ized un its) Mo tion am plitud e (mm ) Time (seconds) 0 0.2 0.4 0.6 0.8 1 0 1 0.2 0.4 0.6 0.8 Mo tion am plitud e (mm ) 0 0.5 1 1.5 2 2.5 3 3.5 0 1 0.2 0.4 0.6 0.8 Time (seconds) (b) (c) Spatio-temporal normalization Cardiac cycle extraction Motion tracking
Fig. 2. Signal normalization from longitudinal kinetics (LOKI). (a) Longitudinal component of the wall trajectory, during several cardiac cycles. The diastole is indicated by the vertical dashes. (b) Signal corresponding to LOKI during one single cardiac cycle, indicated in (a) by the gray region. The pre-normalization peak-to-peak amplitude is represented by the red arrow. (c) Same signal after spatio-temporal normalization.
Time
Longitudinal motion
RAD (%)
100-RAD (%)
Fig. 3. Motion of the arterial wall during the cardiac cycle. Up and down displacements correspond to a motion in the direction of the heart and the head, respectively. The relative amount of displacement (RAD) can be quantified by the area under the curve (gray region). The spatio-temporal domain is normalized.
(PDM) [20]. The following procedure was performed independently for the two cohorts. The covariance matrix of the zero-centered data was first calculated, and the most significant eigenvalues were kept. Here, it appeared that more than 99% of the information could be repre-sented by only 12 coefficients out of 100, which is the length of the original signals. Then, a collection of new artificial signals were generated by randomly modifying these 12 principal component coefficients within the values authorized by real in vivo signals.
C. Data collection
1) Study population: Forty-two young healthy
volun-teers (mean age 37±14 y.o., 17 males) as well as 42 older diabetic patients (mean age 57 ± 7 y.o., 27 males) were involved in this study. The inclusion criterion for the at-risk patients was the presence of one of the following diseases diagnosed at least 1 year before: metabolic syndrome, or type 1 or 2 diabetes. No other criterion, including clinical characteristics, was used to select these subjects. The healthy volunteers were cardiovascular risk factor-free (tobacco use, hypercholesterolemia, diabetes, hypertension or particular family history) as assessed by an oral questionnaire. Informed consent was obtained from all subjects. The study was conducted in compli-ance with the requirements of our institutional review board and the ethics committee.
2) Image acquisition: Longitudinal B-mode in vivo
image sequences of the left CCA were acquired for all subjects. Image acquisition was performed in the Uni-versity Hospital of Lyon (France), with a medical ultra-sound scanner (Antares, Siemens, Erlangen, Germany),
equipped with a 7.5–10 MHz linear array transducer. The pixel size was 30 µm and the frame rate was 26 Hz. After a 15 minutes rest, the subjects were examined in the
supine position with the neck extended and rotated 45◦
to the contralateral side. The transducer was centered on the CCA, in the longitudinal plane, 2 cm distant from the carotid bulb. The absence of atheromatous plaques in the imaged area was assessed by a medical doctor. To avoid the influence of the movement due to breathing, the subjects performed a breath hold during the acquisition. Images were recorded through at least two consecutive full cardiac cycles.
D. Statistical analysis
The Mann–Whitney U test was used to compare the value of the extracted parameters between healthy vol-unteers and at-risk patients. Statistical significance was assumed for p < 0.05. The accuracy, specificity, and
sensibility were defined as (TP+TN)/(TP+TN+FP+FN),
TN/(TN+FP), andTP/(TP+FN), withTP,TN,FP, andFN
the amount of true positive, true negative, false positive, and false negative, respectively. Here, “negative” and “positive” correspond to the detection of healthy and at-risk subjects, respectively.
III. RESULTS
The longitudinal motion was extracted from the in
vivo temporal image sequences of all the 84 subjects.
Illustration of typical patterns of the resulting trajectories are presented in Figure 5.
The two statistical models, resulting from averaging separately the healthy and at-risk signals, are displayed in Figure 6. Two different archetypes can be clearly observed. On one hand, the healthy profile starts with a gentle slope, then quickly returns to the initial position. This dynamic behavior is likely to reflect the elasticity of the tissues smoothly absorbing the initial mechanical force and freely recovering the starting position. On the other hand, the at-risk profile begins with a steep slope, then slowly returns to the initial position. This is hypothesized to correspond to stiffer tissues coping with the mechanical force by an abrupt deformation followed by a weak elastic recoil.
The results of the machine learning classification using the AdaBoost algorithm were the following. A total of 61 subjects out of 84 were correctly classified (healthy or at-risk). More precisely, the rate of correct classi-fication was 29/42 for healthy volunteers, and 32/42 for at-risk patients. This corresponds to an accuracy of 73%, a sensitivity of 78%, and a specificity of 74%.
The intra- and inter-class analysis, resulting from the pairwise DTW measurements, is presented in Figure 7. It
appears that the pattern dispersion is more clustered for healthy volunteers, showing that these signals are quite similar to each others. On the opposite, the pattern dis-persion for at-risk patients is more scattered, indicating a greater irregularity in these signals, which is presumably caused by the effect of the atherosclerosis pathology.
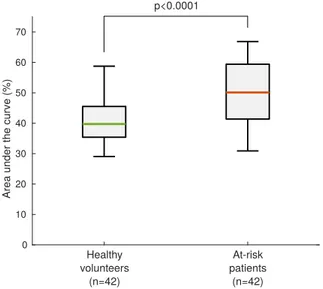
When quantifying the RAD by analyzing the area un-der the curve (Fig. 3), a significant augmentation was ob-served in at-risk patients compared to healthy volunteers, as presented in Figure 8. This result indicates that along the entire trajectory of the wall during the cardiac cycle, the relative motion of the tissues with respect to their original position is larger in at-risk patients compared to healthy volunteers, possibly indicating stiffer tissues. Let
us remind that since the motion amplitude is normalized, this finding does not indicate that the absolute motion is greater in these subjects.
Examples of new artificial signals generated via PDM are displayed in Figure 9. Although these two signals bear a strong resemblance with real in vivo signals (Fig. 5), this approach has also potential to discover novel patterns archetypes that are present within the data but remain unseen due to the very wide number of possible combinations.
Finally, the peak-to-peak amplitude of the longitu-dinal motion was significantly reduced in at-risk pa-tients compared to healthy volunteers (459 ± 258 µm
vs 797 ± 294 µm, p < 0.0001, Fig. 10). This result is a
Time Mo tion am plitud e Sign al 2 Signal 1 (a) (b) Signal 1 Signal 2
Fig. 4. Example of the proposed Dynamic Time Wrapping algorithm between two signals. (a) Extraction of the shortest path (pink line) to determine the optimal similarity points between two signals. (b) Co-registration of two signals. The green (signal 1) and orange (signal 2) profiles correspond to a healthy volunteer and a at-risk patient, respectively. The black lines indicate the optimal matching between the two signals. The spatio-temporal domain is normalized.
0 20 40 60 80 100 0 0.2 0.4 0.6 0.8 1 0 20 40 60 80 100 0 0.2 0.4 0.6 0.8 1 0 20 40 60 80 100 0 0.2 0.4 0.6 0.8 1 0 20 40 60 80 100 Time (normalized units) 0 0.2 0.4 0.6 0.8 1 0 20 40 60 80 100 Time (normalized units) 0 0.2 0.4 0.6 0.8 1 0 20 40 60 80 100 Time (normalized units) 0 0.2 0.4 0.6 0.8 1 0 20 40 60 80 100 Time (normalized units) 0 0.2 0.4 0.6 0.8 1 0 20 40 60 80 100 0 0.2 0.4 0.6 0.8 1 Long itudin al mo tion (nor mal ized un its) Long itudin al mo tion (nor mal ized un its)
Fig. 5. Representative examples of patterns corresponding to the longitudinal kinetics of the artery, showing a clear difference between healthy volunteers (top row) and at-risk patients (bottom row). It is also visible that the relative amount of displacement is superior for at-risk patients.
0 0.25 0.5 0.75 1 0 0.25 0.5 0.75 1
Longitudinal motion (normalized units)
0 0.25 0.5 0.75 1
Time (normalized units) 0 0.25 0.5 0.75 1 (a) (b)
Steep decrease Steady decrease
Steep increase Steady increase
Time (normalized units)
Fig. 6. Average pattern of the longitudinal motion for the 42 healthy volunteers (a) and the 42 at-risk patients (b). The standard deviation is indicated by the dashed regions.
proof of concept in accordance with previous findings that indicate that LOKI amplitude is associated with cardiovascular risk factors [12], [13], [14], [15].
IV. DISCUSSION
The main contribution of this study is a methodolog-ical framework based on statistmethodolog-ical analysis, presented here for the first time, to characterize the pattern of the trajectory of the arterial tissues during the cardiac cycle. Applied in vivo on a cohort of 84 subjects, this method demonstrated that the motion profile was clearly different between healthy volunteers and at-risk patients.
Three complementary methods have been introduced. The AdaBoost classifier demonstrated that Machine Learning is a powerful tool to identify healthy and at-risk subjects. The Dynamic Time Wrapping algorithm could successfully assess the pairwise similarity between two signals, paving the way for quantitative evaluation. Finally, the generation of new random signals has been explored by means of Principal Component Analysis, in the objective to discover unseen patterns.
The analysis of in vivo tissue motion is of tremendous importance for a great number of clinical and biomechan-ical applications. The motion of the arterial wall along the axis of the vessel (dubbed as LOKI for “longitudinal kinetics”) is speculated to be directly associated with arterial stiffness [11], a major indicator of cardiovascular risk. The pattern of the motion assessed in this study (Fig. 6) is likely to reflect the elastic properties of the biological tissues. More precisely, the back-and-forth motion during the cardiac cycle is hypothesized to play the role of a damping mechanism that cope with the
mechanical forces induced (e.g. blood friction, blood pressure). Healthy arteries are more elastic and there-fore better suited to handle the biomechanical stresses, whereas diseased arteries are stiffer, which contributes to the development of the atherosclerosis pathology [21].
LOKI is a recently discovered parameter [5]. Due to the very small amplitude of the motion (approximately 0.5 mm), it only became possible to observe LOKI with the development of modern US scanners with high spatial definition. To the best of our knowledge, US imaging is the only modality capable of capturing this phenomenon in vivo. Despite the fact that LOKI has been investigated in a number of studies during the past decade, this phenomenon is still relatively unexplored and remains not fully characterized. The non-uniform motion within the arterial layers reflects a very rich and complex physiological behavior. The factors provoking this phenomenon are probably multiples, however one of the principal cause is hypothesized to be the apical traction of the aortic valve annulus in late systole. A comprehensive analysis of LOKI is not available to-day, however a great collection of parameters (such as the peak-to-peak amplitude [12], [13], [14], [15], the intramural shear stress [22], the longitudinal stretching rate [16], and the pattern [23], [24], [25]) have been identified to characterize this phenomenon.
In this study, the focus was set on detection of the atherosclerosis at a very early stage of the pathol-ogy, namely before the formation of the atherosclerotic plaque. The context of this work is indeed inspired by the saying “An ounce of prevention is worth a pound of cure”. Rather than determining the threat level of one
Healthy vs
healthy At-risks vsat-risk Healthy vsat-risk 0 1 2 3 p<0.0001 p<0.0001 p<0.0001 Intr a- and int er -class di stance (n orma lized units)
Fig. 7. Inter- and intra-class similarity using the Dynamic Time Wrapping distance. For all box-and-whiskers plots in this article, percentiles are indicated by boxes (25th and 75th), inner lines (50th), and error bars (5thand 95th).
0 10 20 30 40 50 60 70
Area under the curve (%)
Healthy volunteers (n=42) At-risk patients (n=42) p<0.0001
Fig. 8. Comparison of the relative amount of displacement (RAD) between healthy volunteers and at-risk patients.
specific rupture-prone plaque, the objective is to improve cardiovascular risk prediction by detecting subjects that are likely to develop atherosclerosis. This question is currently a major research challenge worldwide [4], [26]. Enhanced risk classification will permit medical doctors to provide patients with more appropriate treatments. First, identification of high-risk patients will lead to effective therapy, thus reducing mortality, disability, and deterioration in quality of life. Second, identification of low-risk individuals will avoid unnecessary and iatro-genic lifetime drug therapy.
Time Long itudin al mo tion (a) (b) Time
Fig. 9. Example of two new artificial signals, randomly generated using Point Distribution Modeling, for a healthy (a) and at-risk (b) profile. The spatio-temporal domain is normalized.
0 0.2 0.4 0.6 0.8 1 1.2 1.4 1.6 LOKI am plitud e (mm ) Healthy volunteers (n=42) At-risk patients (n=42) p<0.0001
Fig. 10. Comparison of the peak-to-peak amplitude of the longitudinal kinetics (LOKI) between the two cohorts.
V. CONCLUSION
A methodological approach based on image processing was presented here for the first time to characterize the pattern of the spatio-temporal trajectory of the carotid artery during the cardiac cycle. Using statistical analy-sis, a significant difference was found between healthy volunteers and at-risk patients. Features extracted from the motion of the biological tissues have great potential to build a novel image-based biomarker that may improve cardiovascular risk prediction.
VI. ACKNOWLEDGEMENTS
This work was partly supported by the JSPS #PE16208 funding, and by the LABEX ANR-11-LABX-0063 of Université de Lyon, within the program “Investissements d’Avenir” (ANR-11-IDEX-0007) operated by the French National Research Agency (ANR).
REFERENCES
[1] WHO, “World Health Organization, Cardiovascular diseases (CVDs), Fact sheet number 317.” http://www.who.int/ mediacentre/factsheets/fs317/en/, September 2016.
[2] C. Napoli, L. O. Lerman, F. De Nigris, M. Gossl, M. L. Balestrieri, and A. Lerman, “Rethinking primary prevention of atherosclerosis-related diseases,” Circulation, vol. 114, no. 23, pp. 2517–2527, 2006.
[3] A. Simon, G. Chironi, and J. Levenson, “Performance of sub-clinical arterial disease detection as a screening test for coronary heart disease,” Hypertension, vol. 48, no. 3, pp. 392–396, 2006. [4] P. Greenland, S. C. Smith Jr, and S. M. Grundy, “Improving coronary heart disease risk assessment in asymptomatic people – Role of traditional risk factors and noninvasive cardiovascular tests,” Circulation, vol. 104, no. 15, pp. 1863–1867, 2001. [5] M. Persson, Å. R. Ahlgren, T. Jansson, A. Eriksson, H. W.
Pers-son, and K. Lindström, “A new non-invasive ultrasonic method for simultaneous measurements of longitudinal and radial arterial wall movements: first in vivo trial,” Clinical Physiology and Functional Imaging, vol. 23, no. 5, pp. 247–251, 2003. [6] S. Golemati, A. Sassano, M. Lever, A. Bharath, S. Dhanjil,
and A. Nicolaides, “Carotid artery wall motion estimated from B-mode ultrasound using region tracking and block matching,” Ultrasound in Medicine & Biology, vol. 29, no. 3, pp. 387–399, 2003.
[7] M. Cinthio, Å. Ahlgren, T. Jansson, A. Eriksson, H. Persson, and K. Lindström, “Evaluation of an ultrasonic echo-tracking method for measurements of arterial wall movements in two dimensions,” IEEE Transactions on Ultrasonics, Ferroelectrics, and Frequency Control, vol. 52, no. 8, pp. 1300–1311, 2005.
[8] A. Gastounioti, S. Golemati, J. Stoitsis, and K. Nikita, “Com-parison of Kalman-filter-based approaches for block matching in arterial wall motion analysis from B-mode ultrasound,” Measure-ment Science and Technology, vol. 22, no. 11, p. 114008, 2011. [9] G. Zahnd, M. Orkisz, A. Sérusclat, P. Moulin, and D. Vray, “Evaluation of a Kalman-based block matching method to assess the bi-dimensional motion of the carotid artery wall in B-mode ultrasound sequences.,” Medical Image Analysis, vol. 17, no. 5, pp. 573–585, 2013.
[10] E. Soleimani, M. Mokhtari-Dizaji, and H. Saberi, “A novel non-invasive ultrasonic method to assess total axial stress of the common carotid artery wall in healthy and atherosclerotic men,” Journal of Biomechanics, vol. 48, no. 10, pp. 1860–1867, 2015. [11] M. Cinthio, Å. R. Ahlgren, J. Bergkvist, T. Jansson, H. W. Pers-son, and K. Lindström, “Longitudinal movements and resulting shear strain of the arterial wall,” American Journal of Physiology, vol. 291, no. 1, pp. H394–H402, 2006.
[12] G. Zahnd, L. Boussel, A. Marion, M. Durand, P. Moulin, A. Sérusclat, and D. Vray, “Measurement of two-dimensional movement parameters of the carotid artery wall for early detection of arteriosclerosis: a preliminary clinical study,” Ultrasound in Medicine & Biology, vol. 37, no. 9, pp. 1421–1429, 2011. [13] S. Svedlund, C. Eklund, P. Robertsson, M. Lomsky, and L. Gan,
“Carotid artery longitudinal displacement predicts 1-year car-diovascular outcome in patients with suspected coronary artery disease,” Arteriosclerosis, Thrombosis, and Vascular Biology, vol. 31, no. 7, pp. 1668–1674, 2011.
[14] G. Zahnd, D. Vray, A. Sérusclat, D. Alibay, M. Bartold, A. Brown, M. Durand, L. M. Jamieson, K. Kapellas, L. J. Maple-Brown, K. O’Dea, P. Moulin, D. S. Celermajer, and M. R. Skilton, “Longitudinal displacement of the carotid wall and cardiovascular risk factors: associations with aging, adiposity, blood pressure and
periodontal disease independent of cross-sectional distensibility and intima-media thickness,” Ultrasound in Medecine & Biology, vol. 38, no. 10, pp. 1705–1715, 2012.
[15] Å. R. Ahlgren, M. Cinthio, S. Steen, T. Nilsson, T. Sjöberg, H. W. Persson, and K. Lindström, “Longitudinal displacement and intramural shear strain of the porcine carotid artery undergo profound changes in response to catecholamines,” American Jour-nal of Physiology - Heart and Circulatory Physiology, vol. 302, no. 5, pp. H1102–H1115, 2012.
[16] G. Zahnd, S. Balocco, A. Sérusclat, P. Moulin, M. Orkisz, and D. Vray, “Progressive attenuation of the longitudinal kinetics in the common carotid artery: preliminary in vivo assessment,” Ultrasound in Medicine & Biology, vol. 41, no. 1, pp. 339–345, 2015.
[17] Å. R. Ahlgren, M. Cinthio, H. W. Persson, and K. Lindström, “Different patterns of longitudinal displacement of the common carotid artery wall in healthy humans are stable over a four-month period,” Ultrasound in Medicine & Biology, vol. 38, no. 6, pp. 916–925, 2012.
[18] Y. Freund and R. E. Schapire, “A decision-theoretic generalization of on-line learning and an application to boosting,” Journal of Computer and System Sciences, vol. 55, no. 1, pp. 119–139, 1997. [19] T. K. Vintsyuk, “Speech discrimination by dynamic program-ming,” Cybernetics and Systems Analysis, vol. 4, no. 1, pp. 52–57, 1968.
[20] T. F. Cootes, C. J. Taylor, D. H. Cooper, and J. Graham, “Training models of shape from sets of examples,” pp. 9–18, 1992. [21] E. Soleimani, M. Mokhtari-Dizaji, H. Saberi, and S.
Sharif-Kashani, “A mathematical model for estimating the axial stress of the common carotid artery wall from ultrasound images,” Medical & Biological Engineering & Computing, vol. 54, no. 8, pp. 1205– 1215, 2016.
[22] T. Nilsson, Å. R. Ahlgren, T. Jansson, H. W. Persson, J. Nilsson, K. Lindström, and M. Cinthio, “A method to measure shear strain with high spatial resolution in the arterial wall non-invasively in vivo by tracking zero-crossings of B-mode intensity gradients,” in IEEE International Ultrasonics Symposium, pp. 491–494, 2010. [23] H. Yli-Ollila, T. P. Laitinen, M. Weckström, and T. M.
Laiti-nen, “Axial and radial waveforms in common carotid artery: An advanced method for studying arterial elastic properties in ultrasound imaging,” Ultrasound in Medicine & Biology, vol. 39, no. 7, pp. 1168–1177, 2013.
[24] H. Yli-Ollila, T. P. Laitinen, M. Weckström, and T. M. Laitinen, “New indices of arterial stiffness measured from longitudinal motion of common carotid artery in relation to reference methods, a pilot study.,” Clinical Physiology and Functional Imaging, vol. 36, no. 5, pp. 376–388, 2016.
[25] H. Yli-Ollila, M. P. Tarvainen, T. P. Laitinen, and T. M. Laitinen, “Principal component analysis of the longitudinal carotid wall motion in association with vascular stiffness: A pilot study,” Ultrasound in Medicine & Biology, p. in press, 2016.
[26] M. Naghavi, E. Falk, H. S. Hecht, M. J. Jamieson, S. Kaul, D. Berman, Z. Fayad, M. J. Budoff, J. Rumberger, T. Z. Naqvi, L. S. Shaw, O. Faergeman, J. Cohn, R. Bahr, W. Koenig, J. Demirovic, D. Arking, D. A. V. Herrera, J. Badimon, J. Gold-stein, Y. Rudy, J. Airaksinen, R. S. Schwartz, W. A. Riley, R. A. Mendes, P. Douglas, and P. K. Shah, “From vulnerable plaque to vulnerable patient – Part III: executive summary of the Screening for Heart Attack Prevention and Education (SHAPE) task force report,” The American Journal of Cardiology, vol. 98, no. 2, pp. 2–15, 2006.