HAL Id: inserm-00601587
https://www.hal.inserm.fr/inserm-00601587
Submitted on 19 Jun 2011
HAL is a multi-disciplinary open access
archive for the deposit and dissemination of
sci-entific research documents, whether they are
pub-lished or not. The documents may come from
teaching and research institutions in France or
abroad, or from public or private research centers.
L’archive ouverte pluridisciplinaire HAL, est
destinée au dépôt et à la diffusion de documents
scientifiques de niveau recherche, publiés ou non,
émanant des établissements d’enseignement et de
recherche français ou étrangers, des laboratoires
publics ou privés.
Masanao Tabuse, Shigeki Ohta, Yohei Ohashi, Raita Fukaya, Aya Misawa,
Kazunari Yoshida, Takeshi Kawase, Hideyuki Saya, Cécile Thirant, Hérve
Chneiweiss, et al.
To cite this version:
Masanao Tabuse, Shigeki Ohta, Yohei Ohashi, Raita Fukaya, Aya Misawa, et al.. Functional analysis
of HOXD9 in human gliomas and glioma cancer stem cells.. Molecular Cancer, BioMed Central, 2011,
10 (1), pp.60. �10.1186/1476-4598-10-60�. �inserm-00601587�
R E S E A R C H
Open Access
Functional analysis of HOXD9 in human gliomas
and glioma cancer stem cells
Masanao Tabuse
1,2, Shigeki Ohta
1,3, Yohei Ohashi
1, Raita Fukaya
1,2, Aya Misawa
3, Kazunari Yoshida
2,
Takeshi Kawase
2, Hideyuki Saya
4, Cécile Thirant
5, Hérve Chneiweiss
5, Yumi Matsuzaki
6, Hideyuki Okano
6,
Yutaka Kawakami
3and Masahiro Toda
1,2*Abstract
Background: HOX genes encode a family of homeodomain-containing transcription factors involved in the determination of cell fate and identity during embryonic development. They also behave as oncogenes in some malignancies.
Results: In this study, we found high expression of the HOXD9 gene transcript in glioma cell lines and human glioma tissues by quantitative real-time PCR. Using immunohistochemistry, we observed HOXD9 protein expression in human brain tumor tissues, including astrocytomas and glioblastomas. To investigate the role of HOXD9 in gliomas, we silenced its expression in the glioma cell line U87 using HOXD9-specific siRNA, and observed
decreased cell proliferation, cell cycle arrest, and induction of apoptosis. It was suggested that HOXD9 contributes to both cell proliferation and/or cell survival. The HOXD9 gene was highly expressed in a side population (SP) of SK-MG-1 cells that was previously identified as an enriched-cell fraction of glioma cancer stem-like cells. HOXD9 siRNA treatment of SK-MG-1 SP cells resulted in reduced cell proliferation. Finally, we cultured human glioma cancer stem cells (GCSCs) from patient specimens found with high expression of HOXD9 in GCSCs compared with normal astrocyte cells and neural stem/progenitor cells (NSPCs).
Conclusions: Our results suggest that HOXD9 may be a novel marker of GCSCs and cell proliferation and/or survival factor in gliomas and glioma cancer stem-like cells, and a potential therapeutic target.
Background
Gliomas, especially glioblastomas (GBMs), are the most malignant primary brain tumors[1]. The median survival of a patient with GBMs is 15 months, and this has improved little by temozolomide treatment[2]. GBMs have a high rate of cellular proliferation and a marked propensity to invade remote brain structures. Such aggressive and invasive growth is the hallmark feature that gives rise to their high morbidity and mortality. A better understanding of the mechanisms underlying the initiation and progression of GBMs at the molecular and cellular levels will open up new opportunities to develop therapeutic strategies.
The growth of many tumors depends on a subset of tumor cells with an extensive capacity for self-renewal,
called either cancer stem cells (CSCs) or tumor-initiat-ing cells[3]. Several studies report the presence of CSCs in gliomas[4,5]. In glioma CSC (GCSC), the expression of some neural stem markers, such as SOX2 and Musa-shi-1, has been reported[6,7]. In addition, some markers including CD133[8] and SSEA-1 (CD15)[9] have been evaluated as GCSC enrichment markers; however, sev-eral studies show their limitations as specific markers [10,11].
Homeobox proteins are master regulators of develop-ment and control many cellular processes, including proliferation, apoptosis, cell shape, and cell migration. Homeobox proteins belong to a superfamily, and are encoded by a number of genes, such as SIX, MSX, PAX, LIM, and HOX[12]. Among Homeobox proteins, HOX genes encode transcription factors that act as critical regulators of growth and differentiation, control of cell identity, cellular communication, cell cycle progression, hematopoiesis, and apoptosis in addition to the control * Correspondence: todam@sc.itc.keio.ac.jp
1
Neuroimmunology Research Group, Keio University School of Medicine, 35 Shinanomachi, Shinjuku-ku, Tokyo 160-8582, Japan
Full list of author information is available at the end of the article
© 2011 Tabuse et al; licensee BioMed Central Ltd. This is an Open Access article distributed under the terms of the Creative Commons Attribution License (http://creativecommons.org/licenses/by/2.0), which permits unrestricted use, distribution, and reproduction in any medium, provided the original work is properly cited.
of axial patterning during embryogenesis. In humans, 39 HOX genes have been identified and partly or fully redundant functions of HOX genes have also been known[13].
HOXgenes have been reported to be misexpressed in many tumors including lung carcinoma, neuroblastoma, ovarian carcinoma, cervical carcinoma, prostate carci-noma, breast carcicarci-noma, and leukaemia[14]. In addition, epigenetic control of HOX genes in development and diseases have been shown in many studies[15]. In a pre-vious study, we performed restriction landmark genomic scanning (RLGS) with a CpG methylation-sensitive enzyme to identify CpG islands of genes that are differ-entially methylated in human glioma cells compared with normal lymphocytes to find epigenetically con-trolled genes in glioma[16], and identified 12 genes that seem to be regulated by epigenetic gene modification. One of the identified genes was HOXD9[16]. HOXD9 is critical for embryonic segmentation[17] and limb bud patterning[18] during development, but its biological function in human adult tissues has been elusive.
Recently, it was reported that HOXD genes were expressed in neoplastic astrocytes[19] and pediatric low-grade gliomas[20]. However much less is known about the function of HOXD genes especially in gliomas. In this study, we analyzed the expression and function of HOXD9in human gliomas and found high expression of HOXD9in GCSCs. HOXD9 contributes to cell prolifera-tion and/or survival in glioma cells and glioma cancer stem-like cells. Thus, HOXD9 may be a new target for the treatment of gliomas based on GCSC population.
Methods
Tissue samples and cell lines
All tumor tissue specimens were obtained from patients with glioma who underwent surgery at the Department of Neurosurgery, Keio University School of Medicine and the Department of Neurosurgery, Sainte Anne Hos-pital, Medical School of Paris Descartes University. Tumors obtained from surgical cases were classified according to the World Health Organization (WHO) criteria[21] as follows: glioblastoma (WHO grade IV), anaplastic astrocytoma (WHO grade III), or diffuse astrocytoma (WHO grade II). Written informed consent was obtained from all patients in the study, which was conducted in accordance with the Institutional Review Board guidelines of Keio University or Paris Descartes University. Human glioma cell lines (U87, SK-MG-1, KNS42, KNS81) were obtained from the American Type Culture Collection (Manassas, VA) and the Japanese Collection of Research Bioresources (Osaka, Japan), and maintained in Dulbecco’s modified Eagle’s medium (Wako, Tokyo, Japan) supplemented with 10% fetal bovine serum (FBS) and antibiotics (50 IU/ml benzyl
penicillin G potassium and 100 μg/ml streptomycin sul-fate; Meiji, Tokyo, Japan). Side population (SP) and non-SP SK-MG-1 cells were isolated using a flow cytometer (EPIC Altra; Beckman Coulter, Tokyo, Japan) as pre-viously described[22]. Human neural stem/progenitor cells (NSPCs) were cultured as neurospheres (NSPs) in neurosphere culture medium consisting of Neurobasal Medium (Invitrogen, Carlsbad, CA) supplemented with human recombinant (hr) EGF (20 ng/mL; Peprotech, Rocky Hills, NY), hrFGF2 (10 ng/mL; Peprotech), hrLIF (10 ng/mL; Millipore-Japan, Tokyo, Japan), heparin (5 μg/ml; Sigma, St. Louis, MO) and B27 (Invitrogen) as previously described[23]. Primary astrocyte cells were purchased from Takara Bio (Tokyo, Japan). GCSC lines were established from human glioma tissue specimens as described in a previous study[10].
RNA extraction and quantitative (q) RT-PCR
Total RNA was isolated from human glioma tissues and cell lines using Trizol (Invitrogen). Total RNA from nor-mal tissues was purchased from Clontech (Palo Alto, CA). Synthesis of cDNA was performed using 1 μg of total RNA using Reverse transcriptase XL (AMV) or Pri-meScript RT Master Mix (Takara Bio). The primers were designed as follows: for HOXD9, forward primer, 5’-GAGGAGGAGAAGCAGCATTC-3’, reverse primer, 5’-TTCTCCAGCTCAAGCGTCTG-3’; for SOX2, for-ward primer, 5’-ATGGACAGTTACGCGCACA-3’, reverse primer, 5’-TGCGAGTAGGACATGCTGTA-3’; for BCL-2, forward primer, 5’-AGGATTGTGGCC-TTCTTTGAGT-3’, reverse primer, GCCGGTTCA-GGTACTCAGTCAT-3’; for TRAIL forward primer, 5’-CGTGTACTTTACCAACGAGCTGA-3’, reverse primer, 5’-ACGGAGTTGCCACTTGACTTG-3’; and for GAPDH, forward primer, 5’-TGAACGGGAAGCT-CACTGG-3’, reverse primer, 5’-TCCACCACCTGTTG-CTGTA-3’. We designed intron-spanning primers to amplify HOXD9 and SOX2. For BCL-2 and TRAIL, respectively, previously tested and optimized primer sets were used as described in Brown (2007)[24] and Wil-liams (2003) [25]. Quantitative RT-PCR analysis was performed with a fluorescent dye, SYBR Green (Applied Biosystems, Foster City, CA), using the ABI prism 7900 HT Sequence Detection System (Applied Biosystems) as previously described[23]. The PCR parameters were as follows: 10 min at 95°C, then 40 cycles of denaturation at 95°C for 1 min, annealing at 60°C for 1 min, and extension at 72°C for 1 min. The relative gene expres-sion level was normalized to that of GAPDH in each sample and calculated as the threshold cycle (CT) value in each sample divided by the CT value in each refer-ence. The CT value is defined as the value obtained in the PCR cycle when the fluorescence signal increases above the background threshold.
Microarray procedure and data processing
Approximately 106 U87 cells were used for total RNA extraction using the RNeasy mini kit (Qiagen, Valencia, CA) according to the manufacturer’s instructions. RNA quality was verified with the Bioanalyzer System (Agilent Technologies, Palo Alto, CA) using RNA Nano Chips. RNA (1.5 μg) was processed for hybridization on the Genechip Human Genome U133 Plus 2.0 Expression array (Affymetrix, Santa Clara, CA), which contains over 54,000 probe sets for analyzing the expression level of over 47,000 transcripts and variants, including 38,500 well-characterized human genes. Processing was done according to the manufacturer’s recommendations. Except when indicated, all genomic and transcript analy-sis was carried out using GeneSpring software 7.3.1 (Agilent Technologies). Microarray data were deposited at the NCBI Gene Expression Omnibus (GEO: GSE28618).
GEO data sets (http://www.ncbi.nlm.nih.gov/gds/) were used to analyze mRNA expression microarray data from several brain tumors and normal brain. The fol-lowing samples were subjected to analysis: normal brain (65 normal human brain tissue samples from ten post-mortem donors, Roth et al., 2006[26], GSE3526); medul-loblastoma (62 samples, Kool et al., 2008[27], GSE10327); oligodendroglioma grade II and III, astrocy-toma grade II and III, and glioblasastrocy-toma grade IV (157 samples, Sun L et al., 2006[28], GDS1962). Comparisons were made using the method of Kool et al[27]. The gene expression level of HOXD9 in brain tumors was compared to the expression in normal brain. Statistical values calculated normalized data from MAS 5 algo-rithm by the Wilcoxon signed rank test.
Bisulfate genomic sequencing
Genomic DNA was purified from each cell line using the Wizard SV Genomic DNA Purification Kit (Pro-mega, Madison, WI). T cells were isolated from periph-eral blood mononuclear cells using magnetic beads conjugated to anti-human CD3 (Miltenyi Biotech, Tokyo, Japan). Bisulfate conversion was performed using 0.5-0.7 μg of genomic DNA and the reagents provided in the Qiagen EpiTect Bisulfate kit (Qiagen). The con-verted DNA was amplified by PCR using the following primers: GAGGGGAGAATAGTTTTTTT-3’ and 5’-CAAACCCAAATCCATATACCC-3’. The PCR products were subcloned into the pGEM-T Easy vector (Promega) and verified by sequencing.
Plasmid construction and transfection
pCMV6-XL5-HOXD9 containing a human full-length cDNA was obtained from Origen Technologies, Inc (Rockville, MD) and subcloned into a pMX-Ig vector (gifted from Dr. T. Kitamura) to generate the
pMX-HOXD9. 293T and U87 cells were transfected with a pMX-HOXD9 plasmid using FuGENE HD transfection regent (Roche) according to the manufacturer’s protocol.
Western blot analysis
Cell lysates were prepared using the RIPA buffer (25 mM Tris-HCl, 150 mM NaCl, 1% NP-40, 1% sodium deoxycholate, and 0.1% SDS; pH 7.6) containing pro-tease inhibitors (Cocktail Tablet; Roche Diagnostics, Japan). Lysates were centrifuged at 14,000×g for 15 min at 4°C, and the protein concentration of each sample was determined with the Bio-Rad protein assay kit (Bio-Rad, Hercules, CA) with bovine serum albumin as a standard. Identical amounts of the proteins were elec-trophoresed in 4-10% SDS-PAGE gels and transferred to a nitrocellulose membrane. Blots were blocked with Blocking One™ (Nacalai, Kyoto, Japan) at RT for 60 min, and incubated with either a goat HOXD9 anti-body (1:500; Santa Cruz Biotechnology. Inc, CA) and a rabbit anti-GAPDH antibody (1:4,000; Santa Cruz Bio-technology, Inc) overnight at 4°C. After being washed three times in TBST (20 mM Tris-HCl, 150 mM NaCl, and 0.02% tween-20; pH 7.4), the blots were incubated with the secondary antibody conjugated with horserad-ish peroxidase (1:4,000, anti-rabbit and anti-mouse; Thermo Scientific, Tokyo) for 1 h at room temperature. Signals were detected with a SuperSignal West Femto Maximum Sensivity Subdstrate (Thermo Scientific) and exposed to Hyperfilm (GE Health Care Biosciences). The specificity of HOXD9 antibody was further con-firmed by a peptide-absorption assay (Additional file 1, Figure S1), in which the antibody was preincubated with the corresponding peptide antigen by 1:5 weight ratio at 4°C and subjected to the analysis.
Small interfering RNA (siRNA) and transient transfection
siRNA duplexes were designed, synthesized, annealed, and purified by RNAi Co., Ltd (Tokyo, Japan). The sequences of the human HOXD9-specific siRNAs were 5’-GAGUUCGCCUCGUGUAGUUUU-3’ (HOXD9 siRNA-1) and 5’- CCACUACGGGAUUAAGCCUGA-3’ (HOXD9 siRNA-2). As a control, we used a non-silencing siRNA with the sequence 5’-GUACCGCACGUCAUUC-GUAUC-3’. U87 or SK-MG-1 SP cells (5-6 × 10⁴cells/ ml) were seeded in triplicate in tissue culture dishes (24-well or 96-(24-well) 24 h prior to siRNA transfection. Control or HOXD9 siRNAs were transfected at a concentration of 50 nM using Lipofectamine RNAiMAX (Invitrogen) according to the manufacturer’s instructions.
Cell proliferation assay
Following siRNA transfection, cells were harvested by trypsinization and the total number of cells was counted by trypan blue exclusion under a phase-contrast
microscope. A cell viability assay was performed using the Cell Titer-Glo Luminescent Cell Viability Assay kit (Promega) according to the manufacturer’s protocol, using a luminometer (Wallac ARVO 1420 multilabel counter; WALLAC OY, Truku, Finland). Cell cycle ana-lysis for live cells was performed using flow cytometry. siRNA-treated cells were stained with Vybrant DyeCycle Violet Stain (Invitrogen) for 30 min at 37°C according to the manufacturer’s protocol and then subjected to flow cytometry (Gallios; Beckman Coulter). Raw data were analyzed using Multicycle for Windows (Beckman Coulter).
Colony formation assay
48 h after siRNA transfection, cells (2 × 10⁴cells) were mixed with 2 ml of culture medium containing 0.4% agar and 10% FCS and then plated on 2 ml of the bot-tom layer containing 0.6% agar with 10% FCS in each well of a 6-well plate. Each experiment was performed in triplicate. After 3 weeks culture, colonies were counted after staining with MTT 3-(4,5-dimethyl-2-thia-zolyl)-2,5-diphenyl-2H-tetrazolium bromide.
Apoptosis assay
Caspase 3/7 activity in siRNA-transfected cells was mea-sured using the Caspase-Glo 3/7 assay kit (Promega) according to the manufacturer’s instructions. U87 cells were plated in 96-well plates at a seeding density of 6 × 10³ cells/well, and caspase activity was assayed 48 h after siRNA transfection. To differentiate between apop-totic and necrotic cell death, siRNA-transfected cells (1 × 10⁵ cells/ml) were stained with 5 μl Annexin-V
anti-body and 5 μl 7-AAD using an Annexin V-FITC/7-AAD-staining kit (Beckman Coulter), placed on ice for 10 min in the dark, and then analyzed by flow cytome-try(EPICS XL; Beckman Coulter).
Time-lapse cell imaging
Cells were transfected with control siRNA, HOXD9 siRNA-1 and HOXD9 siRNA-2. 24 h after transfection, 10,000 cells were plated on 24-well glass plates (IWAKI, Tokyo, Japan) and imaged using a NIKON TE2000-E microscope equipped with ×200 magnification lens (Nikon, Tokyo, Japan). The microscope stage was enclosed by a plastic air curtain and heated to 37°C. Time-lapse recordings were taken every 5 minutes for 96 h and analyzed using the image analysis software MetaMorph (Molecular Devices, Downingtown, PA). The cell division time of cells transfected with siRNAs was determined using the time-lapse images.
Immunohistochemical staining
Paraffin-embedded tissue sections (5 μm) were deparaffi-nized in xylene and rehydrated. The sections were treated
with a heat-based antigen retrieval method using a citrate solution (pH 6.0, 10 mM). Nonspecific binding of antibo-dies was blocked by incubation in 5% rabbit serum in 0.01 M PBS for 30 min. The slides were then incubated with goat anti-human HOXD9 polyclonal antibody (1:100; Santa Cruz Biotechnology, Inc., Santa Cruz, CA) diluted with 0.02% BSA in 0.01 M PBS overnight at 4°C in a humidified box. The slides were then incubated with a secondary antibody (Universal Immuno-peroxidase Polymer, Anti-goat; Histofine Simple Stain MAX PO (G), Nichirei Corporation, Tokyo, Japan) for 30 min at 37°C, and horseradish peroxidase labeling was visualized using 3,3’-diamonobenzidene (DAB). The sections were then lightly counterstained with hematoxylin. Each step was followed by three washes in PBS. To evaluate the prolif-eration of tumor cells, the same sections were stained with the monoclonal antibody MIB-1 (1:200; DAKO Japan, Kyoto, Japan) that recognizes the Ki-67 protein. The proliferating cell indexes were analyzed for >1000 tumor cells in more than three areas expressing the high-est number of immunopositive nuclei. The analysis was performed using a digital camera (DXM-1200) attached to a microscope (Nikon) and ACT-1 software (Nikon). Immunohistochemical staining was performed in 29 glioma cases (5 diffuse astrocytomas, 11 anaplastic astro-cytomas and 13 glioblastomas).
Statistical analysis
The results are presented as mean values ± S.D. Data were analyzed using a Student’s t test with P < 0.05 con-sidered statistically significant.
Results
Analysis of HOXD9 gene expression in gliomas
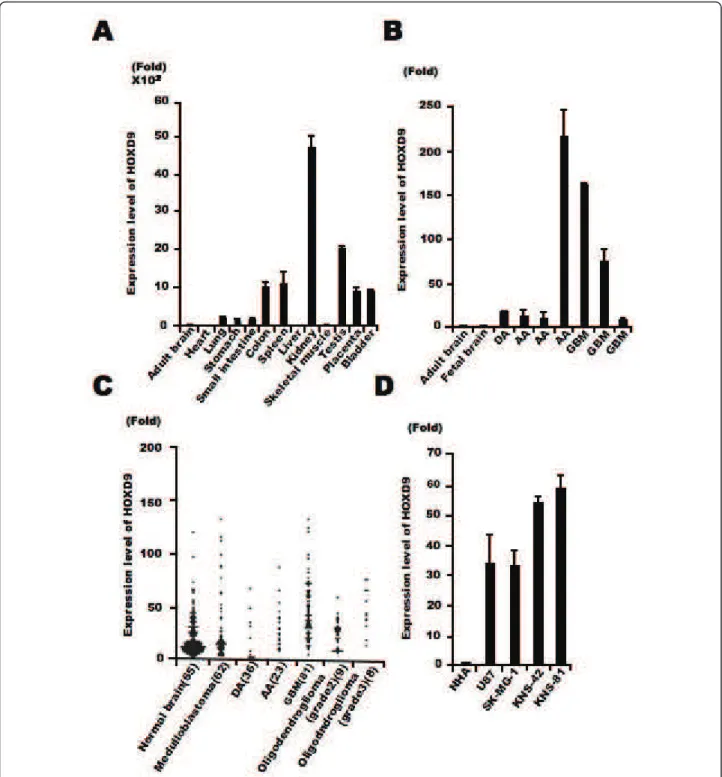
To examine the expression level of HOXD9 mRNA in tis-sues, we firstly performed qRT-PCR analysis in normal human tissues using intron-spanning gene-specific pri-mers. HOXD9 was highly expressed in normal colon, spleen, kidney, testis, placenta, and bladder but poorly in the brain (Figure 1A). Next, we performed qRT-PCR ana-lysis in glioma tissues obtained from our university hos-pital, all seven samples showed a >9-fold higher expression as compared with both normal fetal and adult brain samples (Figure 1B). This led us to investigate HOXD9expression throught the published microarray databases. Bioinformatic analysis of data collected from published transcriptomes suggests an increase of HOXD9 expression in gliomas and more particularly in glioblasto-mas as compared to the normal brain tissues and medul-loblastomas. Considering the heterogeneity of the samples and methods used, a statistical analysis of these differences was not relevant in these data sets (Figure 1C). However, focusing on a given study was more infor-mative. As per the example of Sun et al 2006 we observe
Figure 1 HOXD9 expression in gliomas. (A) Analysis of HOXD9 gene expression in human normal tissues by qRT-PCR. (B) Analysis of HOXD9 gene expression in gliomas (diffuse astrocytoma [DA], anaplastic astrocytoma [AA], and glioblastoma multiform [GBM]) by qRT-PCR. (A), (B), Data were normalized using the results raised with the normal adult brain as reference. The graphs show the average of two independent
experiments. Error bars indicate ± S.D. (C) Expression levels of HOXD9 in normal brain and brain tumors. Data were normalized using the results raised with the normal brain as reference. Gene expression and clinical outcome data were obtained from Gene Expression Omnibus (GEO) data sets at NCBI (GSE3526, GSE10327, GDS1962). (D) Analysis of HOXD9 gene expression in glioma cells and normal human astrocytes (NHA). For the graphs, the data are complied from three independent experiments. Error bars indicate ± S.D.
a 2.6-fold increase (P value = 2.93E-10)[28]. We also examined the expression of HOXD9 mRNA in four glioma cell lines, U87, SK-MG-1, KNS-42 and KNS-81 and found higher expression of HOXD9 mRNA com-pared with that in normal human astrocytes (33-, 32.5-, 52.8-, and 57.5-fold higher, respectively; Figure 1D).
Immunohistochemical analysis of HOXD9 in gliomas
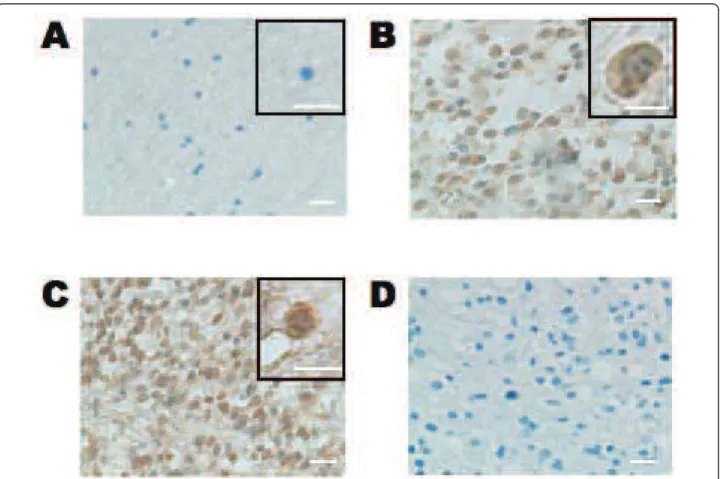
Immunohistochemical analysis showed that the number of HOXD9-positive cells was very low in normal cere-bral cortex tissue surrounding a surgical biopsy, in agreement with our results from qRT-PCR (Figure 1C and 2A). However, HOXD9-positive cells were observed in both anaplastic astrocytoma (Figure 2B) and GBM tissues (Figure 2C). To examine the antibody specificity, no primary antibody staining was performed (Figure 2D). Furthermore, immunizing peptide adsorption experiments by western blot method (Additional file 1, Figure S1) and immunohistochemical method in kidney tissues (data not shown) showed that weak immunor-eactivity, confirming the specificity of the antibody.
In some cells, HOXD9 immunoreactivity was observed in the both cytoplasm and the nucleus (Figure 2B); how-ever, most of the HOXD9 labeling was confined to the nucleus, consistent with its function as a transcription factor (Figure 2C). We also observed no correlation between HOXD9 expression and cell proliferation in gliomas using the MIB-1 index (Table 1).
Gene silencing of HOXD9 decreases cell proliferation of glioma U87 cells
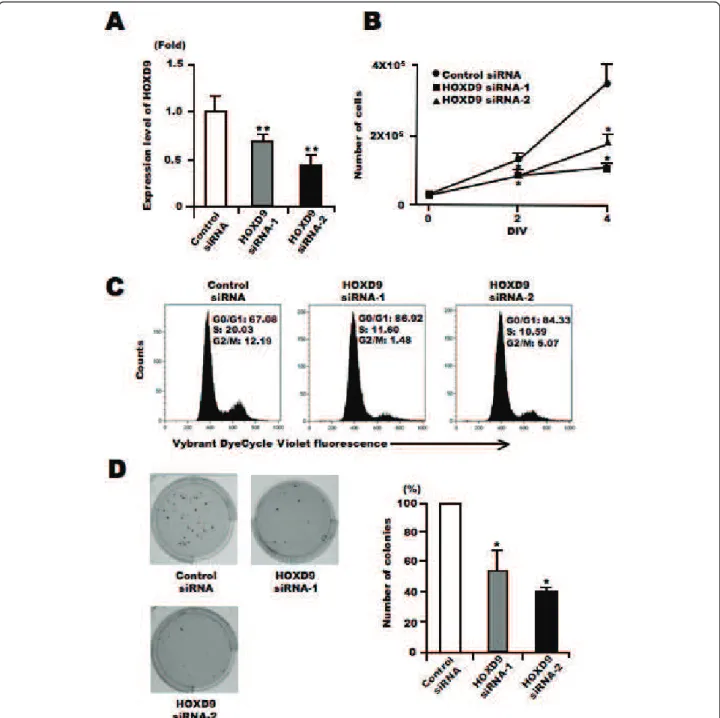
To investigate the role of HOXD9 in tumor cells, we examined changes in U87 glioma cell proliferation in the absence of HOXD9 using siRNA. We designed two different siRNAs to reduce the gene expression of HOXD9(Figure 3A). Cell number was counted 2 and 4 days after siRNA transfection into U87 cells. There were fewer cells present after transfection with either of the two HOXD9 siRNAs compared with the control siRNA transfected cells (Figure 3B). In addition, the decrease of cell proliferation by HOXD9 gene silencing was observed in KNS-42 and KNS-81 glioma cells (Additional file 2,
Figure 2 Immunohistochemical analysis of HOXD9 expression in gliomas and normal brain tissue. Only a few HOXD9 immunopositive cells were detected in normal tissues from the cerebral cortex in an oligodendroglioma (A). In an anaplastic astrocytoma (B, WHO grade III) and a glioblastoma (C, WHO grade IV), HOXD9 immunopositive cells were observed in both the cytoplasm and the nucleus. (D) No primary antibody control. The sections were counterstained with hematoxylin. The boxed area shows higher magnification images. Scale bar = 25 μm.
Figure S2). Cell cycle analysis of live cells using Vybrant DyeCycle Violet dye showed that the S-phase and G2-phase cell populations decreased 3 days after HOXD9 siRNA transfection in U87 cells (Figure 3C). Further-more, gene silencing of HOXD9 reduced the number of colony formation in U87 glioma cells compared to the control (Figure 3D). These results suggest that HOXD9 may be involved in glioma cell proliferation.
Gene silencing of HOXD9 induces apoptosis in U87 glioma cells
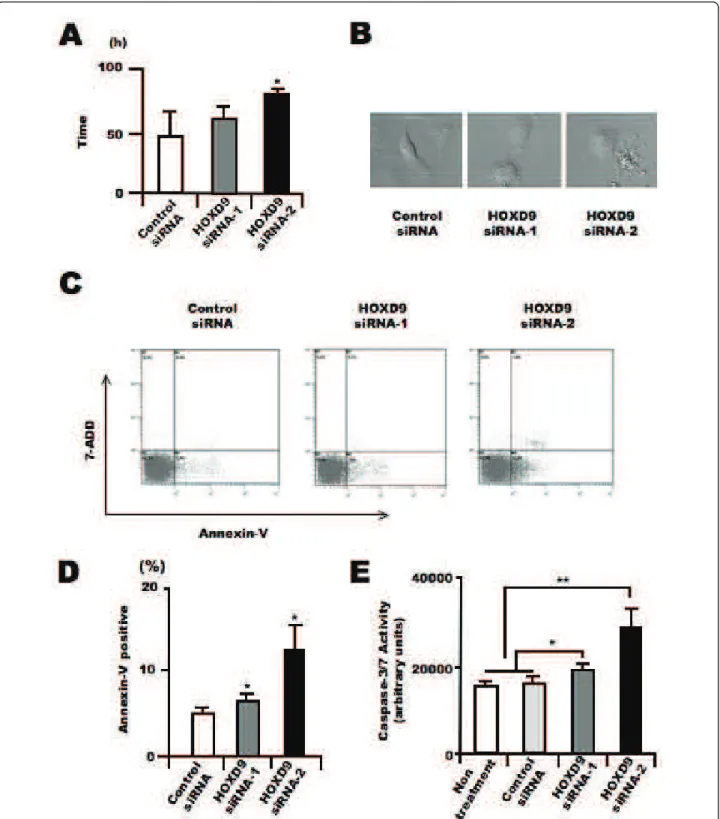
In addition to the analysis of proliferation, we analyzed the effect of HOXD9 gene silencing on apoptosis in U87 cells. We evaluated the cell division time and morphological
changes in U87 glioma cells after HOXD9 siRNA trans-fection using a time-lapse video microscope system according to our previous study[29]. The average cell division time in HOXD9 siRNA-transfected cells was greater than that in the control cells (47.2 ± 18 h for control siRNA vs. 81.1 ± 1.3 h for HOXD9 siRNA-2, p = 0.03; Figure 4A). Furthermore, many HOXD9 cells underwent apoptosis, observed as cell fragmentation (Fig-ure 4B). To confirm whether the morphological changes were the result of apoptotic cell death, we performed flow cytometric analysis using Annexin-V/7-ADD stain-ing. Compared with control cells, the number of Annexin V+/7-ADD- cells was significantly higher after HOXD9 siRNA transfection on Day 3 (Figure 4C). The total
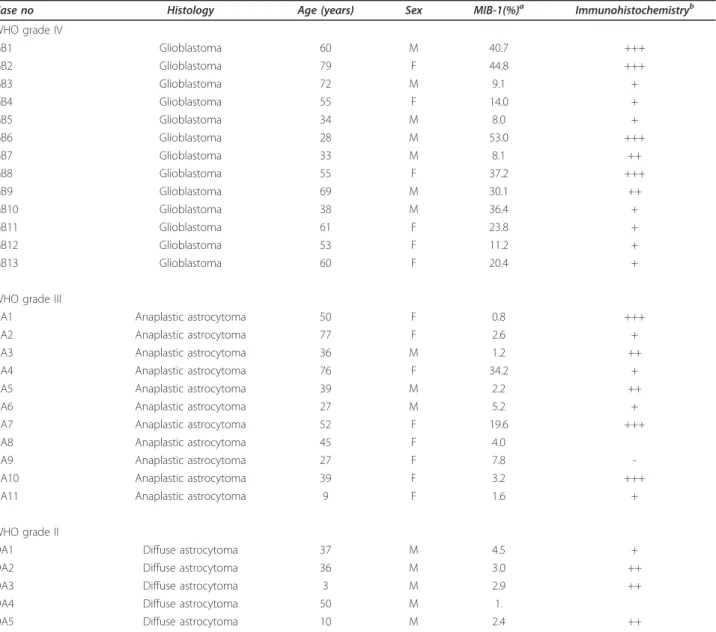
Table 1 Association of HOXD9 expression and MIB-1 index in glioma tissues
Case no Histology Age (years) Sex MIB-1(%)a Immunohistochemistryb WHO grade IV GB1 Glioblastoma 60 M 40.7 +++ GB2 Glioblastoma 79 F 44.8 +++ GB3 Glioblastoma 72 M 9.1 + GB4 Glioblastoma 55 F 14.0 + GB5 Glioblastoma 34 M 8.0 + GB6 Glioblastoma 28 M 53.0 +++ GB7 Glioblastoma 33 M 8.1 ++ GB8 Glioblastoma 55 F 37.2 +++ GB9 Glioblastoma 69 M 30.1 ++ GB10 Glioblastoma 38 M 36.4 + GB11 Glioblastoma 61 F 23.8 + GB12 Glioblastoma 53 F 11.2 + GB13 Glioblastoma 60 F 20.4 +
WHO grade III
AA1 Anaplastic astrocytoma 50 F 0.8 +++
AA2 Anaplastic astrocytoma 77 F 2.6 +
AA3 Anaplastic astrocytoma 36 M 1.2 ++
AA4 Anaplastic astrocytoma 76 F 34.2 +
AA5 Anaplastic astrocytoma 39 M 2.2 ++
AA6 Anaplastic astrocytoma 27 M 5.2 +
AA7 Anaplastic astrocytoma 52 F 19.6 +++
AA8 Anaplastic astrocytoma 45 F 4.0
AA9 Anaplastic astrocytoma 27 F 7.8
-AA10 Anaplastic astrocytoma 39 F 3.2 +++
AA11 Anaplastic astrocytoma 9 F 1.6 +
WHO grade II
DA1 Diffuse astrocytoma 37 M 4.5 +
DA2 Diffuse astrocytoma 36 M 3.0 ++
DA3 Diffuse astrocytoma 3 M 2.9 ++
DA4 Diffuse astrocytoma 50 M 1.
DA5 Diffuse astrocytoma 10 M 2.4 ++
a
The proliferating cell index was analyzed in >1000 tumor cells in more than three areas expressing the highest number of MIB-1-positive nuclei.bThe patterns of HOXD9 staining are described as (-) negative or faint staining; (+) positive in less than 30% of tumor cells; (++) positive in less than 70% of tumor cells; (+++) positive in more than 70% of tumor cells. M, male; F, female.
number of Annexin-V+ cells was higher after HOXD9 siRNA transfection (Figure 4D). We also measured the activity of caspase 3/7, which is known to promote apop-tosis. Two days after HOXD9 siRNA transfection, caspase 3/7 activity was induced (Figure 4E).
To identify the molecules involved in cell death asso-ciated with HOXD9 silencing, we extracted total RNA from control- and HOXD9-siRNA transfected cells on Day 2, and subjected them to DNA microarray analysis. Genes that showed a >2-fold change in expression Figure 3 Silencing of HOXD9 gene decreases proliferation of U87 glioma cells. (A) Analysis of HOXD9 gene expression by qRT-PCR 2 days after siRNA transfection. The graphs show the average of two independent experiments. For the graphs, the data are complied from three independent experiments. * *, P < 0.01. Error bars indicate ± S.D. (B) Growth suppression of U87 glioma cells after HOXD9 siRNA transfection. siRNA-transfected cells were counted by trypan blue exclusion. Data are representative of three independent experiments. *, P < 0.05. Error bars indicate ± S.D. (C) Cell cycle alteration by HOXD9 siRNA-1 in U87 glioma cells 3 days after siRNA treatment. Results of flow cytometry analysis using Vybrant DyeCycle Violet dye are shown. Data are representative of three independent experiments. (D) 3 weeks after siRNA transfection, colonies stained with MTT [3-(4,5-dimethyl-2-thiazolyl)-2,5-diphenyl-2H-tetrazolium bromide] were counted. For the graphs, the data are complied from three independent experiments. *, P < 0.05. Error bars indicate ± S.D.
Figure 4 Silencing of HOXD9 gene induces apoptosis in U87 glioma cells. (A) Average cell division time of siRNA-treated cells was measured for 4 days starting 24 h after transfection (n = 3). *, P < 0.05. Error bars indicate ± S.D. (B) Representative images of U87 glioma cells transfected with control or HOXD9 siRNA in the time-laps cell imaging analysis of three independent experiments (C) Determination of apoptosis by flow cytometry 3 days after siRNA transfection. Early apoptosis (lower right, Annexin V+/7ADD-), late apoptosis (upper right, Annexin V-/7ADD +), necrotic cells (upper left, Annexin V-/7ADD+), and normal cells (lower left, Annexin V-/7-ADD-) from a representative experiment at least three
independent experiments. (D) Average percentage of Annexin V+cells. For the graphs, the data are complied from three independent
experiments. **, P < 0.01. Error bars indicate ± S.D. (E) Analysis of caspase3/7 activity in U87 glioma cells 48 hr after siRNA treatment. For the graphs, the data are complied from three independent experiments. *, P < 0.05, **, P < 0.01. Error bars indicate ± S.D.
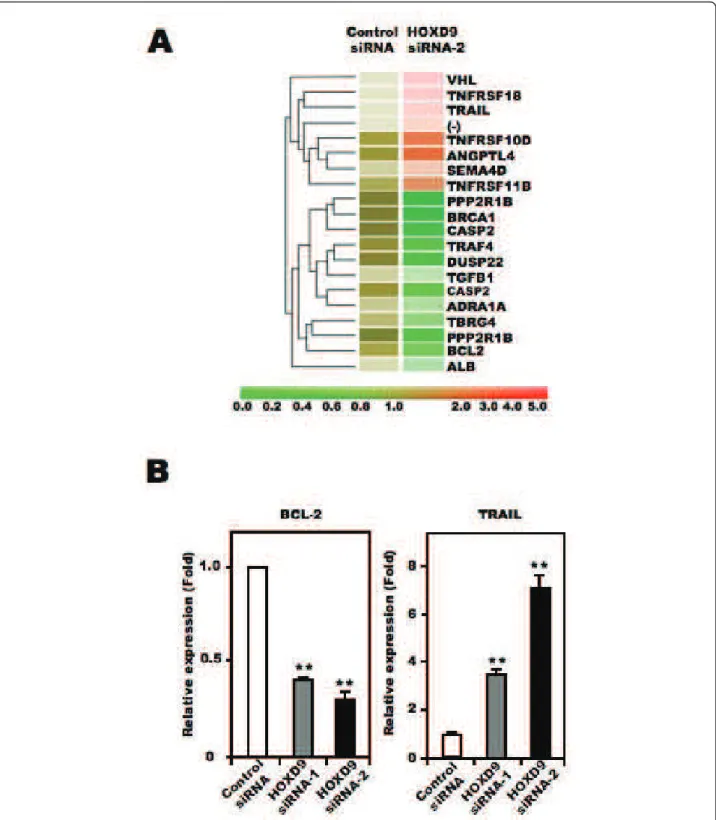
between control siRNA- and HOXD9 siRNA-transfected cells were considered to be significantly changed. Figure 5A shows the cluster analysis of selected genes obtained from the Gene Ontology database under the classifica-tions “apoptosis regulator activity” and “cell growth and/ or maintenance”. Of the listed genes, we focused on BCL-2, a known anti-apoptotic factor, and TRAIL, a member of the tumor necrosis factor family of cell death-inducing ligands, as candidate apoptosis-related genes in this study. It has been reported that TRAIL can induce apoptosis in U87 cells[30]. To confirm the results from the microarray analysis, we performed qRT-PCR analysis to quantify the mRNA level of these two genes. Compared with control siRNA-transfected U87 cells, BCL-2 mRNA was lower and TRAIL mRNA was higher in HOXD9 siRNA treated cells, consistent with the results from the microarray analysis (Figure 5B). Collectively, these results suggest that HOXD9 silencing promotes cell death in U87 cells.
HOXD9 is involved in the proliferation of SK-MG-1 SP cells
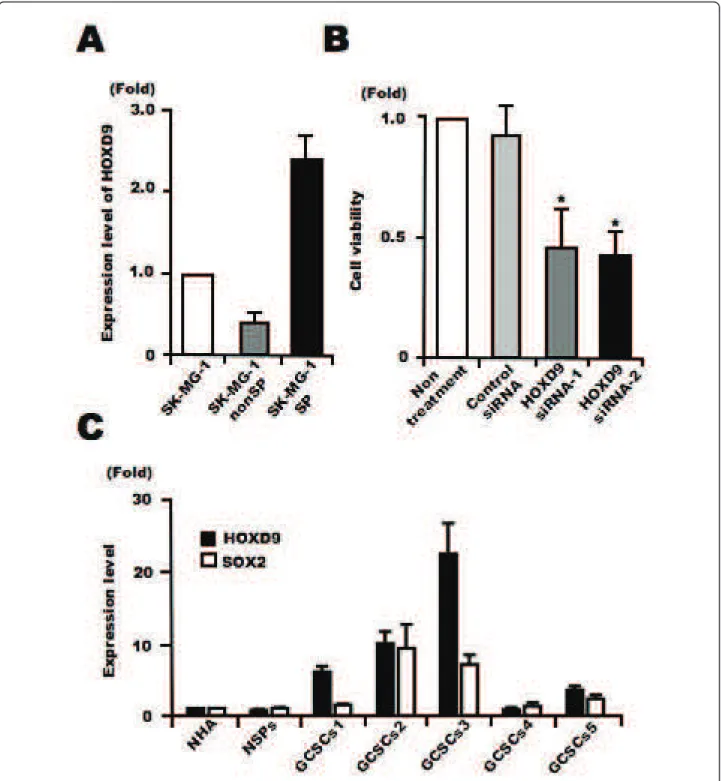
Recently, we found that a side population (SP) of cells in a glioma cell line, SK-MG-1, possesses the properties of glioma stem-like cells[22]. We analyzed the expression levels of HOXD9 in SP and non-SP SK-MG-1 cells using qRT-PCR, and found higher expression of HOXD9 mRNA in SP cells compared with non-SP cells (Figure 6A). We performed a cell proliferation assay using SP cells transfected with either control or HOXD9 siRNA. QRT-PCR confirmed efficient gene silencing of HOXD9in SK-MG-1 SP cells transfected with HOXD9 siRNA (data not shown). The viability of SK-MG-1 SP cells was significantly attenuated by HOXD9 siRNA compared with control siRNA 48 h after transfection (Figure 6B).
HOXD9 expression in human GCSCs
We cultured human GCSCs as glioma spheres from glioma surgical specimens and established five cell lines as described in our previous study[10]. SOX2, a known neural stem/progenitor cell (NSPC) marker, is also expressed in gliomas and GCSCs[31]. We performed qRT-PCR to examine the expression of HOXD9 and SOX2in GCSCs compared with normal primary astro-cytes and NSPCs derived from fetal brain and cultured as neurospheres[32]. The expression of SOX2 and HOXD9 in GCSCs was higher than that in normal astrocytes and NSPCs. Also, HOXD9 expression was higher than SOX2 expression in some GCSCs (Figure 6C).
Discussion
This is the first study examining the function of HOXD9 in gliomas. We found that HOXD9 was more highly expressed in gliomas and GCSCs and that gene silencing
of HOXD9 reduced the proliferation of both glioma cells and glioma cancer stem-like cell population.
The expression of homeobox family genes is generally restricted during embryogenesis. Recently, it was reported that HOXD9 is expressed in murine neural tubes and neural crest cells during development[33]. In this study, we observed the high expression of HOXD9 in normal adult human kidney and testis. The misexpression of homeobox transcription factor genes has also been reported in cancer tissues; for example, HOXA1 and Six1 transform mammary epithelial cells[34,35], and Msx1 and Cdxtransform myoblasts[36] and intestinal epithelial cells [37], respectively. Although the mechanisms underlying the misexpression of homeobox transcription factor genes in cancer remain elusive, the deregulation of non-coding RNA expression and/or changes in the methylation status of the promoters may be involved. Recently, it has been reported that non-coding RNA residing in the HOXC locus could act in trans to regulate transcription of the HOXDlocus with the Polycomb-repressive complex 2 (PRC2)[38]. HOXD11 and HOXD12 are regulated by the Polycomb group proteins during embryonic stem cell dif-ferentiation[39]. We performed bisulfate sequencing to compare the methylation status of the HOXD9 promoter in U87 cells compared with normal human T cells and NSPCs. Hypermethylation of CpG islands was observed in the HOXD9 promoter region in U87 cells compared to T cells and NSPCs when HOXD9 gene expression was high (Additional file 3, Figure S3). This relationship between gene expression and methylation status has also been observed in HOXB family genes in small-cell lung cancer [40]. Hypermethylation of CpG islands in promoter regions has been reported for many genes, including the HOXCand HOXD cluster genes associated with HOXD9 in human astrocytomas[39,41]. It is difficult to understand why hypermethylation correlates with increased rather than decreased gene expression. In the future, it may be important to evaluate the methylation status of HOXD9 in the whole genome, as well as histone modification in glio-mas and GCSCs compared with normal brain and NSPCs using the tiling array system and/or a next-generation sequencer. Thus, the analyses of epigenetic regulation of HOXD9gene expression in gliomas and GCSCs related to Polycomb proteins and non-coding RNA will be an impor-tant issue in the near future.
We showed that gene knockdown of HOXD9 reduces the proliferation of U87, KNS-42, and KNS-81 glioma cells and glioma cancer stem-like cells; SK-MG-1 SP cells. So far, HOXD9 is reported to be involved in the regulation of cell proliferation in rheumatoid arthritis [42] and carcinogenesis[43], indicating that HOXD9 may contribute to cell proliferation in HOXD9-expressing cells in gliomas including GCSCs In our preliminary experiment, transiently over-expressed HOXD9
Figure 5 Effect of HOXD9 gene knockdown on the expression of apoptosis- and cell proliferation-related factors. (A) Gene expression in U87 glioma cells transfected with HOXD9 siRNA or control siRNA was determined by microarray analysis. A gene list generated by a Gene Ontology search against “Apoptosis regulator activity” and “Cell growth and/or maintenance” was clustered using a hierarchical method. The red, green, and brown scale represents the expression level of a gene above, below, or equal to the mean expression level for that gene across all samples, respectively. (-) indicates that the gene was not annotated in the NCBI gene bank list. (B) Analysis of BCL-2 and TRAIL gene expression in U87 glioma cells by qRT-PCR 2 days (BCL-2) or 3 days (TRAIL) after siRNAs transfection. Each mRNA was normalized against GAPDH mRNA and expressed relative to the normalized value for control siRNA-treated cells. For the graphs, the data are complied from three independent experiments. **, P < 0.01. Error bars indicate ± S.D.
Figure 6 Analysis of the expression and function of HOXD9 in glioma cancer stem cells. (A) Analysis of HOXD9 gene expression in SK-MG-1 SP cells, SK-MG-SK-MG-1 non-SP cells, and total SK-MG-SK-MG-1 glioma cells. The abundance of HOXD9 mRNA was normalized to that of GAPDH mRNA and expressed relative to the normalized value for SK-MG-1 cells. For the graphs, the data are complied from three independent experiments. Error bar indicates mean ± S.D. (B) Gene knockdown of HOXD9 in SK-MG-1 SP cells attenuated cell proliferation. Cell viability was determined 2 days after siRNA treatment. The experiment was repeated twice, with similar results. *, P < 0.05. Error bars indicate ± S.D. (C) Expression of the HOXD9 and SOX2 genes was examined by qRT-PCR in normal human astrocytes (NHA), human NSPCs, and GCSCs cultured from glioma surgical biopsy specimens. The abundance of HOXD9 and SOX2 mRNA was normalized to that of GAPDH and expressed relative to the normalized value for NHA. Data shown are the mean ± S.D. from two independent experiments.
increased the S-phase cell population of U87 cells in cell cycle analysis (data not shown). In this study, gene silen-cing of HOXD9 induced apoptosis and reduced the expression of BCL-2 in glioma cells, indicating that HOXD9 may support the cell survival. Furthermore, immunohistochemical studies showed no apparent cor-relation between HOXD9 expression level and WHO grade or MIB-1 index, suggesting that HOXD9 may be expressed in primitive cancer cell populations, including GCSCs in vivo. As for the upstream factors of HOXD9, it has been reported that HOXD9 expression is induced by Wnt signaling[33], which is a maintenance factor for neural stem cells[44] and neural crest cells[45], suggest-ing that HOXD9 may act as a maintenance or survival factor for GCSCs undercontrol of Wnt signaling. HOXB1also supports the maintenance and expansion of neural progenitor cells[46], and HOXB4 may expand hematopoietic stem cells[47]. Taken together, these results indicate that some homeobox proteins including HOXD9may contribute to cancer stem cell maintenance in addition to the cell proliferation and/or survival.
In the present study, we demonstrated that HOXD9 was highly expressed in glioma cells and GCSCs cultured from patient specimens compared with human NSPCs and astrocytes. To date, drug development for targeting cancer stem cells is an important issue in cancer therapy [48]. Therefore, it is very important for this purpose to find targets expressed in cancer stem cells with a high specificity. In this point, HOXD9 may be an ideal thera-peutic target for the treatment of gliomas because the expression in NSPCs and astrocytes is lower than GCSCs, suggesting that HOXD9 targeted therapy may have a therapeutic index. In fact, knockdown of HOXD9 decreased the proliferation of glioma cancer stem-like cells in vitro, supporting the idea. Recently, it has been reported that HOXA9 decreases apoptosis and increases cell proliferation in glioma cells by epigenetic control[49] and the expression of HOXA10 in GBM-derived spheres [50]. Thus, it may be intriguing to study the detailed ana-lysis of HOX families in GCSCs in the future for the development of drug discovery targeted for GCSCs.
Conclusions
HOXD9 may be useful as a marker for glioma and GCSCs, and therapies targeting HOXD9 should be con-sidered for further development.
Additional material
Additional file 1: Figure S1. Peptide pre-absorption analysis of Western blot. The anti-HOXD9 antibody was pre-incubated with blocking peptide (antigen) by 1:5 Weight ratio at 4°C overnight. Immunizing peptide adsorption showed weak immunoreactivity towards over-expressed HOXD9 in 293T cells.
Additional file 2: Figure S2. Silencing of HOXD9 gene decreases proliferation of KNS-42 and KNS-81 glioma cells. (A) Analysis of HOXD9gene expression by qRT-PCR analysis 2 days after siRNA transfection in KNS-42 and KNS-81 glioma cells. (B) Gene knockdown of HOXD9in in KNS-42 and KNS-81cells attenuated cell proliferation. Cell viability was determined 2 days after siRNA treatment. For the graphs, the data are complied from three independent experiments. *, P < 0.05, **, P < 0.01. Error bars indicate ± S.D.
Additional file 3: Figure S3. Analysis of CpG methylation. (A) A schematic representation of the previously described restriction landmark genomic scanning (RLGS) clone[16] and the position of the CpG islands within the promoter region of the HOXD9 gene. (B) Methylation maps derived from bisulfate sequencing analysis of human T cells, NSPCs, and U87 glioma cells. ●, methylated; ○, unmethylated.
Acknowledgements
We thank the Collaborative Research Resources, Keio University School of Medicine (Keio-Med Open Access Facility) for technical assistance. We also thank Ms. Sayaka Teramoto, Ms. Reiko Kuwahara, and Mr. K. Morii (Keio University School of Medicine) for technical assistance, Dr. T. Kitamura (Tokyo University) for the gift of plasmid pMX-Ig, and Dr. Marcel Kool (Department of Human Genetics, Academic Medical Center, Amsterdam) for microarray data mining.
The authors would also like to acknowledge Dr. Kesari Santosh (University of California, San Diego) for critical reading of the manuscript. HC: equipe labelisee La Ligue 2007.
Author details
1Neuroimmunology Research Group, Keio University School of Medicine, 35
Shinanomachi, Shinjuku-ku, Tokyo 160-8582, Japan.2Department of Neurosurgery, Keio University School of Medicine, 35 Shinanomachi, Shinjuku-ku, Tokyo 160-8582, Japan.3Division of Cellular Signaling, Institute for Advanced Medical Research, Keio University School of Medicine, 35 Shinanomachi, Shinjuku-ku, Tokyo 160-8582, Japan.4Division of Gene Regulation, Institute for Advanced Medical Research of Keio University School of Medicine, 35 Shinanomachi, Shinjuku-ku, Tokyo 160-8582, Japan.
5Team Glial Plasticity Inserm UMR 894, University Paris Descartes, 75014 Paris,
France.6Division of Physiology, Keio University School of Medicine, 35
Shinanomachi, Shinjuku-ku, Tokyo 160-8582, Japan. Authors’ contributions
Conceived and designed the experiments: MT1SO MT2. Performed the
experiments: MT1SO YO RF AM CT. Analyzed the data: MT1SO. Contributed reagents/materials/analysis tools: KY TK HS HC YM HO YK. Wrote the paper: MT1SO HC MT2(MT1, M. Tabuse; MT2, M. Toda). All authors read and approved the final manuscript.
Competing interests
The authors declare that they have no competing interests. Received: 3 December 2010 Accepted: 22 May 2011 Published: 22 May 2011
References
1. Benjamin R, Capparella J, Brown A: Classification of glioblastoma multiforme in adults by molecular genetics. Cancer J 2003, 9:82-90. 2. Stupp R, Mason WP, van den Bent MJ, Weller M, Fisher B, Taphoorn MJ,
Belanger K, Brandes AA, Marosi C, Bogdahn U, et al: Radiotherapy plus concomitant and adjuvant temozolomide for glioblastoma. N Engl J Med 2005, 352:987-996.
3. Reya T, Morrison SJ, Clarke MF, Weissman IL: Stem cells, cancer, and cancer stem cells. Nature 2001, 414:105-111.
4. Vescovi AL, Galli R, Reynolds BA: Brain tumour stem cells. Nat Rev Cancer 2006, 6:425-436.
5. Stiles CD, Rowitch DH: Glioma stem cells: a midterm exam. Neuron 2008, 58:832-846.
6. Gangemi RM, Griffero F, Marubbi D, Perera M, Capra MC, Malatesta P, Ravetti GL, Zona GL, Daga A, Corte G: SOX2 silencing in glioblastoma
tumor-initiating cells causes stop of proliferation and loss of tumorigenicity. Stem Cells 2009, 27:40-48.
7. Thon N, Damianoff K, Hegermann J, Grau S, Krebs B, Schnell O, Tonn JC, Goldbrunner R: Presence of pluripotent CD133(+) cells correlates with malignancy of gliomas. Mol Cell Neurosci 2010, 43:51-59.
8. Singh SK, Clarke ID, Terasaki M, Bonn VE, Hawkins C, Squire J, Dirks PB: Identification of a cancer stem cell in human brain tumors. Cancer Res 2003, 63:5821-5828.
9. Son MJ, Woolard K, Nam DH, Lee J, Fine HA: SSEA-1 is an enrichment marker for tumor-initiating cells in human glioblastoma. Cell Stem Cell 2009, 4:440-452.
10. Patru C, Romao L, Varlet P, Coulombel L, Raponi E, Cadusseau J, Renault-Mihara F, Thirant C, Leonard N, Bernheim A, et al: CD133, CD15/SSEA-1, CD34 or side populations do not resume tumor-initiating properties of long-term cultured cancer stem cells from human malignant glio-neuronal tumors. BMC Cancer 2010, 10:66.
11. Prestegarden L, Enger PO: Cancer Stem Cells in the Central Nervous System - A Critical Review. Cancer Res 2010, 70:8255-8258. 12. Doboule D: Guidebook to the Homeobox Genes New York: Oxford Univ.
Press; 1994.
13. Carroll SB: Homeotic genes and the evolution of arthropods and chordates. Nature 1995, 376:479-485.
14. Shah N, Sukumar S: The Hox genes and their roles in oncogenesis. Nat Rev Cancer2010, 10:361-371.
15. Barber BA, Rastegar M: Epigenetic control of Hox genes during neurogenesis, development, and disease. Ann Anat 2010, 192:261-274. 16. Ohashi Y, Ueda M, Kawase T, Kawakami Y, Toda M: Identification of an
epigenetically silenced gene, RFX1, in human glioma cells using restriction landmark genomic scanning. Oncogene 2004, 23:7772-7779. 17. Fromental-Ramain C, Warot X, Lakkaraju S, Favier B, Haack H, Birling C,
Dierich A, Dollé P, Chambon P: Specific and redundant functions of the paralogous Hoxa-9 and Hoxd-9 genes in forelimb and axial skeleton patterning. Development 1996, 122:461-472.
18. Morgan BA, Tabin C: Hox genes and growth: early and late roles in limb bud morphogenesis. Dev Suppl 1994, 181-186.
19. Abdel-Fattah R, Xiao A, Bomgardner D, Pease CS, Lopes MB, Hussaini IM: Differential expression of HOX genes in neoplastic and non-neoplastic human astrocytes. J Pathol 2006, 209:15-24.
20. Buccoliero AM, Castiglione F, Degl’Innocenti DR, Ammanati F, Giordano F, Sanzo M, Mussa F, Genitori L, Taddei GL: Hox-D genes expression in pediatric low-grade gliomas: real-time-PCR study. Cell Mol Neurobiol 2009, 29:1-6. 21. Kleihues P, Louis DN, Scheithauer BW, Rorke LB, Reifenberger G, Burger PC,
Cavenee WK: The WHO classification of tumors of the nervous system. J Neuropathol Exp Neurol2002, 61:215-225, discussion 226-219. 22. Fukaya R, Ohta S, Yamaguchi M, Fujii H, Kawakami Y, Kawase T, Toda M:
Isolation of cancer stem-like cells from a side population of a human glioblastoma cell line, SK-MG-1. Cancer Lett 2009, 291(2):150-7. 23. Hattori Y, Ohta S, Hamada K, Yamada-Okabe H, Kanemura Y, Matsuzaki Y,
Okano H, Kawakami Y, Toda M: Identification of a neuron-specific human gene, KIAA1110, that is a guanine nucleotide exchange factor for ARF1. Biochem Biophys Res Commun2007, 364:737-742.
24. Brown JE, Dunmore SJ: Leptin decreases apoptosis and alters BCL-2: Bax ratio in clonal rodent pancreatic beta-cells. Diabetes Metab Res Rev 2007, 23:497-502.
25. Williams NS, Gaynor RB, Scoggin S, Verma U, Gokaslan T, Simmang C, Fleming J, Tavana D, Frenkel E, Becerra C: Identification and validation of genes involved in the pathogenesis of colorectal cancer using cDNA microarrays and RNA interference. Clin Cancer Res 2003, 9:931-946. 26. Roth RB, Hevezi P, Lee J, Willhite D, Lechner SM, Foster AC, Zlotnik A: Gene
expression analyses reveal molecular relationships among 20 regions of the human CNS. Neurogenetics 2006, 7:67-80.
27. Kool M, Koster J, Bunt J, Hasselt NE, Lakeman A, van Sluis P, Troost D, Meeteren NS, Caron HN, Cloos J, et al: Integrated genomics identifies five medulloblastoma subtypes with distinct genetic profiles, pathway signatures and clinicopathological features. PLoS One 2008, 3:e3088. 28. Sun L, Hui AM, Su Q, Vortmeyer A, Kotliarov Y, Pastorino S, Passaniti A,
Menon J, Walling J, Bailey R, et al: Neuronal and glioma-derived stem cell factor induces angiogenesis within the brain. Cancer Cell 2006, 9:287-300. 29. Nitta M, Kobayashi O, Honda S, Hirota T, Kuninaka S, Marumoto T, Ushio Y, Saya H: Spindle checkpoint function is required for mitotic catastrophe induced by DNA-damaging agents. Oncogene 2004, 23:6548-6558.
30. Hetschko H, Voss V, Horn S, Seifert V, Prehn JH, Kogel D: Pharmacological inhibition of Bcl-2 family members reactivates TRAIL-induced apoptosis in malignant glioma. J Neurooncol 2008, 86:265-272.
31. Ikushima H, Todo T, Ino Y, Takahashi M, Miyazawa K, Miyazono K: Autocrine TGF-beta signaling maintains tumorigenicity of glioma-initiating cells through Sry-related HMG-box factors. Cell Stem Cell 2009, 5:504-514. 32. Kanemura Y, Mori H, Kobayashi S, Islam O, Kodama E, Yamamoto A,
Nakanishi Y, Arita N, Yamasaki M, Okano H, et al: Evaluation of in vitro proliferative activity of human fetal neural stem/progenitor cells using indirect measurements of viable cells based on cellular metabolic activity. J Neurosci Res 2002, 69:869-879.
33. Ishikawa S, Ito K: Plasticity and regulatory mechanisms of Hox gene expression in mouse neural crest cells. Cell Tissue Res 2009, 337:381-391. 34. Radisky DC: Defining a role for the homeoprotein Six1 in EMT and
mammary tumorigenesis. J Clin Invest 2009, 119:2528-2531.
35. Mohankumar KM, Perry JK, Kannan N, Kohno K, Gluckman PD, Emerald BS, Lobie PE: Transcriptional activation of signal transducer and activator of transcription (STAT) 3 and STAT5B partially mediate homeobox A1-stimulated oncogenic transformation of the immortalized human mammary epithelial cell. Endocrinology 2008, 149:2219-2229.
36. Bendall AJ, Ding J, Hu G, Shen MM, Abate-Shen C: Msx1 antagonizes the myogenic activity of Pax3 in migrating limb muscle precursors. Development1999, 126:4965-4976.
37. Gao N, White P, Kaestner KH: Establishment of intestinal identity and epithelial-mesenchymal signaling by Cdx2. Dev Cell 2009, 16:588-599. 38. Rinn JL, Kertesz M, Wang JK, Squazzo SL, Xu X, Brugmann SA,
Goodnough LH, Helms JA, Farnham PJ, Segal E, Chang HY: Functional demarcation of active and silent chromatin domains in human HOX loci by noncoding RNAs. Cell 2007, 129:1311-1323.
39. Woo CJ, Kharchenko PV, Daheron L, Park PJ, Kingston RE: A region of the human HOXD cluster that confers polycomb-group responsiveness. Cell 2010, 140:99-110.
40. Flagiello D, Poupon MF, Cillo C, Dutrillaux B, Malfoy B: Relationship between DNA methylation and gene expression of the HOXB gene cluster in small cell lung cancers. FEBS Lett 1996, 380:103-107. 41. Wu X, Rauch TA, Zhong X, Bennett WP, Latif F, Krex D, Pfeifer GP: CpG
island hypermethylation in human astrocytomas. Cancer Res 2010, 70:2718-2727.
42. Nguyen NC, Hirose T, Nakazawa M, Kobata T, Nakamura H, Nishioka K, Nakajima T: Expression of HOXD9 in fibroblast-like synoviocytes from rheumatoid arthritis patients. Int J Mol Med 2002, 10:41-48. 43. Liu DB, Gu ZD, Cao XZ, Liu H, Li JY: Immunocytochemical detection of
HoxD9 and Pbx1 homeodomain protein expression in Chinese esophageal squamous cell carcinomas. World J Gastroenterol 2005, 11:1562-1566. 44. Willert K, Brown JD, Danenberg E, Duncan AW, Weissman IL, Reya T,
Yates JR, Nusse R: Wnt proteins are lipid-modified and can act as stem cell growth factors. Nature 2003, 423:448-452.
45. Garcia-Castro MI, Marcelle C, Bronner-Fraser M: Ectodermal Wnt function as a neural crest inducer. Science 2002, 297:848-851.
46. Gouti M, Gavalas A: Hoxb1 controls cell fate specification and proliferative capacity of neural stem and progenitor cells. Stem Cells 2008, 26:1985-1997.
47. Lu SJ, Feng Q, Ivanova Y, Luo C, Li T, Li F, Honig GR, Lanza R: Recombinant HoxB4 fusion proteins enhance hematopoietic differentiation of human embryonic stem cells. Stem Cells Dev 2007, 16:547-559.
48. Zhou BB, Zhang H, Damelin M, Geles KG, Grindley JC, Dirks PB: Tumour-initiating cells: challenges and opportunities for anticancer drug discovery. Nat Rev Drug Discov 2009, 8:806-823.
49. Costa BM, Smith JS, Chen Y, Chen J, Phillips HS, Aldape KD, Zardo G, Nigro J, James CD, Fridlyand J, et al: Reversing HOXA9 oncogene activation by PI3K inhibition: epigenetic mechanism and prognostic significance in human glioblastoma. Cancer Res 2010, 70:453-462. 50. Murat A, Migliavacca E, Gorlia T, Lambiv WL, Shay T, Hamou MF, de
Tribolet N, Regli L, Wick W, Kouwenhoven MC, et al: Stem cell-related “self-renewal” signature and high epidermal growth factor receptor expression associated with resistance to concomitant
chemoradiotherapy in glioblastoma. J Clin Oncol 2008, 26:3015-3024.
doi:10.1186/1476-4598-10-60
Cite this article as: Tabuse et al.: Functional analysis of HOXD9 in human gliomas and glioma cancer stem cells. Molecular Cancer 2011 10:60.