HAL Id: hal-03202668
https://hal.inrae.fr/hal-03202668
Submitted on 20 Apr 2021HAL is a multi-disciplinary open access
archive for the deposit and dissemination of sci-entific research documents, whether they are pub-lished or not. The documents may come from teaching and research institutions in France or abroad, or from public or private research centers.
L’archive ouverte pluridisciplinaire HAL, est destinée au dépôt et à la diffusion de documents scientifiques de niveau recherche, publiés ou non, émanant des établissements d’enseignement et de recherche français ou étrangers, des laboratoires publics ou privés.
intestinal ceramide and sphingomyelin species in
postmenopausal women
Mélanie Le Barz, Cécile Vors, Emmanuel Combe, Laurie Joumard-Cubizolles,
Manon Lecomte, Florent Joffre, Michèle Trauchessec, Sandra Pesenti,
Emmanuelle Loizon, Anne-Esther Breyton, et al.
To cite this version:
Mélanie Le Barz, Cécile Vors, Emmanuel Combe, Laurie Joumard-Cubizolles, Manon Lecomte, et al.. Milk polar lipids favorably alter circulating and intestinal ceramide and sphingomyelin species in postmenopausal women. JCI Insight, American Society for Clinical Investigation, 2021, �10.1172/jci.insight.146161�. �hal-03202668�
ceramide and sphingomyelin species in postmenopausal
women
Mélanie Le Barz, … , David Cheillan, Marie-Caroline Michalski
JCI Insight. 2021. https://doi.org/10.1172/jci.insight.146161.
In-Press Preview
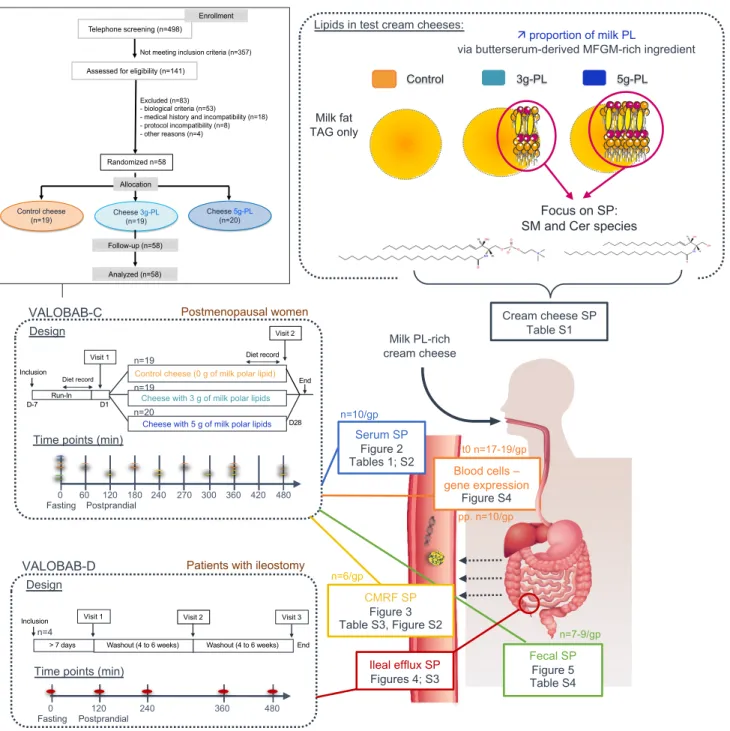
Graphical abstract
Clinical Medicine Clinical trials Metabolism
ceramide and sphingomyelin species in postmenopausal women
2 3
Mélanie Le Barz1,#, Cécile Vors1,2,#, Emmanuel Combe1, Laurie Joumard-Cubizolles3, Manon 4
Lecomte1,2, Florent Joffre4, Michèle Trauchessec5,6, Sandra Pesenti1, Emmanuelle Loizon1, Anne-5
Esther Breyton1,2, Emmanuelle Meugnier1, Karène Bertrand4, Jocelyne Drai1,5,7, Chloé Robert1,2, 6
Annie Durand1, Charlotte Cuerq1,5,7, Patrice Gaborit8,9, Nadine Leconte10, Annick Bernalier-7
Donadille11, Eddy Cotte5,12,13, Martine Laville1,2,5,13, Stéphanie Lambert-Porcheron2,5, Lemlih 8
Ouchchane14,15, Hubert Vidal1, Corinne Malpuech-Brugère3, David Cheillan1,5,6, Marie-Caroline 9
Michalski*,1,2 10
11
1 Univ Lyon, CarMeN laboratory, INSERM, INRAE, INSA Lyon, Université Claude Bernard Lyon 1,
12
Charles Mérieux Medical School, 69310, Pierre-Bénite, France. 13
2 Centre de Recherche en Nutrition Humaine Rhône-Alpes, Univ-Lyon, CarMeN Laboratory, 14
Université Claude Bernard Lyon1, Hospices Civils de Lyon, CENS, FCRIN/FORCE Network, 69310, 15
Pierre-Bénite, France. 16
3 Université Clermont Auvergne, INRAE, UNH, Unité de Nutrition Humaine, CRNH Auvergne, 17
63000, Clermont-Ferrand, France. 18
4 ITERG, ZA Pessac-Canéjan, 11 Rue Gaspard Monge, 33610, Canéjan, France. 19
5 Hospices Civils de Lyon, 69000, Lyon, France. 20
6 Unité Maladies Héréditaires du Métabolisme, Service de Biochimie et Biologie Moléculaire Grand 21
Est, Centre de Biologie et de Pathologie Est, Hospices Civils de Lyon, 69677, Bron, France. 22
7 Unité de Nutrition Endocrinologie Métabolisme, Service de Biochimie, Centre de Biologie et de 23
Pathologie Sud, Hospices Civils de Lyon, 69495, Pierre-Bénite, France. 24
8 ACTALIA Dairy Products and Technologies, Avenue François Mitterrand, BP49, 17700, Surgères, 25
France. 26
9 ENILIA ENSMIC, Avenue François Mitterrand, 17700, Surgères, France. 27
10INRAE, Institut Agro, STLO (Science et Technologie du Lait et de l’Œuf), F-35042, Rennes, 28
France. 29
11 Université Clermont Auvergne, INRAE, UMR 454, MEDIS, 63000, Clermont-Ferrand, France. 30
12 Hospices Civils de Lyon, Centre Hospitalier Lyon-Sud, Service de chirurgie digestive, 69310, 31
Pierre-Bénite, France. 32
13 Université Claude Bernard Lyon 1, Faculté de médecine Lyon-Sud-Charles Mérieux, EMR 3738, 33
69600, Oullins, France. 34
14 Université Clermont Auvergne, CNRS, SIGMA Clermont, Institut Pascal, 63000, Clermont-35
Ferrand, France. 36
15 CHU Clermont-Ferrand, Unité de Biostatistique-Informatique Médicale, 63000, Clermont-Ferrand, 37
France. 38
# MLB and CV contributed equally and are co-first authors. 39 40 * Corresponding author: 41 Michalski Marie-Caroline 42
INRAE UMR1397 - INSERM U1060 - CarMeN laboratory (Laboratoire de Recherche en 43
Cardiovasculaire Métabolisme Diabétologie et Nutrition) 44
Bâtiment CENS-ELI 2D, Hôpitaux Lyon Sud, Secteur 2, 45
165, chemin du Grand Revoyet, 46
69310 Pierre-Bénite, France 47
E-mail: marie-caroline.michalski@inrae.fr, 48
Phone: +33 4 26 23 61 71; Twitter: @Michalski_MC 49
50
Conflict of interest: This work was supported in part by a grant from the French Dairy Interbranch
51
Organisation (CNIEL). M-CM has received research funding for other research projects from CNIEL, 52
Danone-Nutricia Research, Sodiaal-Candia R&D. M-CM has consultancy activities for food, fats and 53
oils and dairy companies. M-CM is a member of the scientific advisory board of ITERG, the Industrial 54
Technical Centre for the oils and fats business sector. These activities had no link with the present 55
study. FJ was, and KB is, an employee of ITERG. PG is an employee of ACTALIA Produits Laitiers, 56
an Agri-Food Technical Institute, with a strong specialization in dairy research and development, and 57
food safety. MLa had research collaborations with Mondelez and Bridor without link with the present 58
study. HV has research collaborations with PiLeJe and Roquette without link with the present study. 59
Other authors declared no conflict of interest. 60
ABSTRACT
61
BACKGROUND. High circulating levels of ceramides (Cer) and sphingomyelins (SM) have been
62
associated with cardiometabolic diseases. The consumption of whole-fat dairy products, which 63
naturally contain such polar lipids (PL), is associated with health benefits, but the impact on 64
sphingolipidome remains unknown. We investigated how milk PL supplementation impacts 65
circulating and intestinal SM and Cer composition in association with improvement of cardiovascular 66
markers. 67
METHODS. In a 4 week-randomized double-blind controlled study, 58 postmenopausal women
68
consumed daily a cream cheese containing 0, 3 or 5 g of milk PL. Postprandial metabolic explorations 69
were performed before and after the supplementation. SM and Cer species were analyzed in serum, 70
intestine-derived chylomicrons and feces. The ileal content of 4 ileostomy patients was also explored 71
after milk PL intake in a crossover double-blind study. 72
RESULTS. Milk PL consumption decreased serum atherogenic C24:1 Cer (Pgroup = 0.033), C16:1 73
(Pgroup = 0.007) and C18:1 (Pgroup = 0.003) SM species. Changes in serum C16+18 SM species were 74
positively correlated with the reduction of total cholesterol (r = 0.706, P < 0.001), LDL-C (r = 0.666, 75
P < 0.001) and ApoB (r = 0.705, P < 0.001). Milk PL decreased the concentration in chylomicrons of
76
total SM (Pgroup < 0.0001) and of C24:1 Cer (Pgroup = 0.001). Saturated SM and Cer species, which are 77
also the major species found in milk PL-enriched cheeses, increased in ileal efflux and feces. There 78
was a marked increase in total fecal Cer after milk PL supplementation (Pgroup = 0.0002). Milk PL also 79
modulated the abundance of some specific SM and Cer species in ileal efflux and feces, suggesting 80
differential absorption and metabolization processes in the gut. 81
CONCLUSION. These data demonstrate that milk PL supplementation decreases atherogenic SM
82
and Cer species associated with an improvement of cardiovascular risk markers. Our findings bring 83
new insights on sphingolipid metabolism in the gastrointestinal tract, especially Cer as such signaling 84
molecules potentially participating in the beneficial effect of milk PL. ClinicalTrials.gov, 85
NCT02099032, NCT02146339. 86
FUNDINGS. Agence Nationale de la Recherche, ANR-11-ALID-007-01; Regional Hospital Clinical
87
Research Program (PHRCI-2014: VALOBAB, n°14-007); French Dairy Interbranch Organization 88
(CNIEL); Groupe Lipides et Nutrition (GLN 2018-11-07), Hospices Civils de Lyon as sponsor. 89
INTRODUCTION
90
Sphingolipids (SP) represent a large class of bioactive polar lipids (PL) that play a pivotal role in 91
structural and metabolic functions in the regulation of cardiometabolic homeostasis, intestinal health 92
and inflammatory signaling pathways (1–3). SP metabolism represents a vast and complex network 93
(4), including a plethora of metabolically relevant species regulated by several key enzymes and 94
metabolite fluxes in mammals (5). Dysregulated SP metabolism is related to negative health outcomes 95
(6–8), and an increase in circulating ceramide (Cer) species (particularly C24:1 Cer), which are key 96
precursors of the biosynthesis of several other SP molecules, correlates with markers of 97
cardiometabolic complications (9–11). Sphingomyelins (SM) represent one of the most abundant SP 98
families. High serum SM concentrations correlate with coronary heart diseases in obese patients (13) 99
and high-fat diet increases specifically C16+C18 SM species (i.e., C16:0, C16:1, C18:0 and C18:1 100
species) in rodents (14). 101
There is growing evidence showing that several factors may affect circulating SM and Cer 102
concentrations such as drugs and lifestyle modifications, including exercise and dietary changes (15, 103
16). SP being found in plant and animal cell membranes, the daily SP intake represents approximately 104
0.3-0.4 g / day in humans (17), but the impact of such consumption on the endogenous 105
sphingolipidome remains largely unknown. Cow milk has recently attracted more attention because it 106
naturally contains SM and Cer (~25% of PL in the milk fat globule membrane, MFGM), including 107
C20+22 species (i.e., C20:0, C20:1, C22:0 and C22:1 species) that are found in higher amounts in milk 108
fat than in human blood. Recent meta-analysis and research papers highlighted the beneficial 109
cardiometabolic effects of the consumption of whole fat dairy product, which contain sizeable amounts 110
of milk PL (18, 19). Given that milk PL also contain C16+18 SM and C24:1 Cer species with potential 111
deleterious effects, understanding the impact of milk SP on circulating levels and endogenous SP 112
metabolism is of uttermost importance. 113
Preclinical studies revealed that milk SM supplementation prevents hyperlipemia, 114
hypercholesterolemia, low-grade inflammation, and improves intestinal health related to gut 115
microbiota modulations (2, 20–26). Buttermilk, a by-product of butter industry, represents a natural 116
source of SM-rich MFGM (1-10 g of milk PL / L) (27, 28). In the VALOBAB-C trial, we demonstrated 117
recently that the 4-week consumption of milk PL-enriched test cheese decreases circulating total 118
cholesterol (C) (primary outcome), triacylglycerols (TAG), LDL-C and ApoB, at both fasting and 119
postprandial states, (Supplemental Figure 1) in postmenopausal women at risk of cardiovascular 120
disease (29). However, there are still open questions regarding the potential involvement of the 121
endogenous metabolism and intestinal fate of milk SP species in these benefits. We thus explored the 122
prespecified secondary outcomes of the VALOBAB clinical trial by analyzing SM and Cer molecular 123
species of particular interest in several biological compartments. We aimed to determine how the 4-124
week supplementation with milk PL impacts the circulating and fecal SM and Cer species at fasting 125
state, and their amount in intestine-derived chylomicrons during the postprandial period, in 126
postmenopausal women at cardiovascular risk. We then verified whether this contributes to the 127
beneficial effects of milk PL on lipid cardiovascular markers. In a complementary study conducted in 128
ileostomy patients, we further aimed to identify the digestive fate of milk SP in the upper 129
gastrointestinal tract after acute consumption of milk PL-rich meals. 130
RESULTS
131
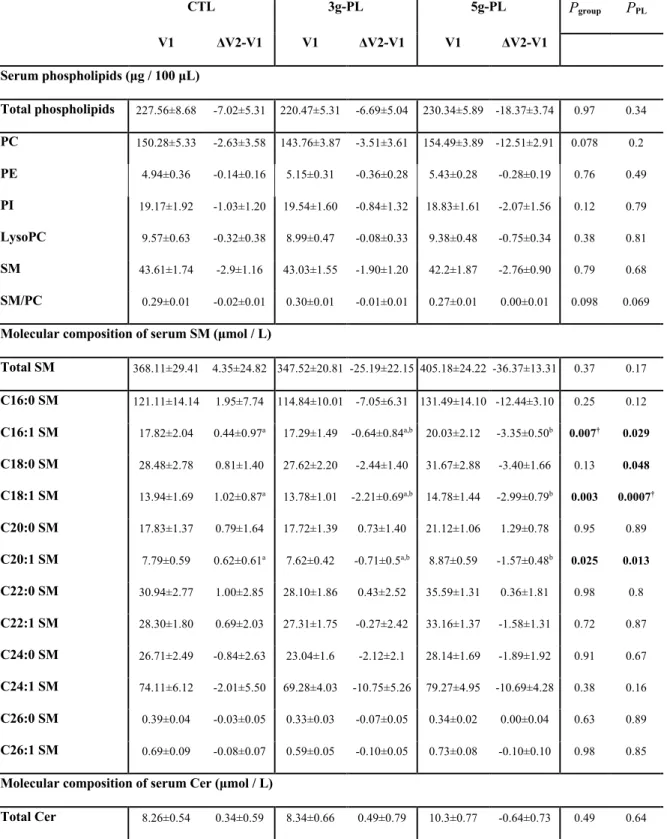
Sphingolipidome of serum SM and Cer molecular species is modified by milk PL
132
The dietary intervention with milk PL significantly modified the amount of several molecular SP 133
species in fasting serum. In the 5g-PL group, the serum concentrations of the following species 134
decreased between the first (V1) and second (V2) exploration visit: C16:1 SM (DV2-V1 CTL: +0.44 135
± 0.97 µM; 3g-PL: -0.64 ± 0.84 µM; 5g-PL: -3.35 ± 0.50 µM; Pgroup = 0.007; post hoc analysis: P CTL-136
5gPL = 0.006), C18:1 SM (DV2-V1 CTL: +1.02 ± 0.87 µM; 3g-PL: -2.21 ± 0.69 µM; 5g-PL: -2.99 ± 137
0.79 µM; Pgroup = 0.003; PCTL-5gPL = 0.003) and C20:1 SM (DV2V1 CTL: +0.62 ± 0.61 µM; 3gPL: -138
0.71 ± 0.50 µM; 5g-PL: -1.57 ± 0.48 µM; Pgroup = 0.025; PCTL-5gPL = 0.019) (Table 1). A decrease in 139
serum C24:1 Cer species was also observed in milk PL groups regardless of dose (DV2-V1 CTL: +0.11 140
± 0.08 µM; 3g-PL: -0.19 ± 0.08 µM; 5g-PL: -0.37 ± 0.18 µM; PPL=0.016), without any effect on the 141
other identified Cer species. No difference between groups was observed in the circulating fasting 142
concentrations of total SM and Cer and of phospholipids (Table 1). Parallel to their amount, changes 143
in the relative abundance of fasting SM and Cer species after intervention, i.e., the proportion of each 144
SM or Cer species in total serum SM or Cer respectively, revealed decreased proportions of C18:1 SM 145
species (Pgroup = 0.002) and C24:1 Cer species (DV2-V1 CTL: +0.65 ± 0.76%; 3g-PL: -2.67 ± 0.96%; 146
5g-PL: -2.65 ± 0.71%; Pgroup = 0.010, PPL = 0.002; PCTL-5g = 0.021, PCTL-3g = 0.020; Supplemental Table 147
2). These beneficial effects were associated with the increase of the relative proportions of specific 148
SM and Cer species usually poorly represented in human blood: C20:0 SM (DV2-V1 CTL: +0.14 ± 149
0.14%; 3g-PL: +0.62 ± 0.08%; 5g-PL: +0.95 ± 0.09%; Pgroup = 0.00005; PCTL-5g = 0.00003, PCTL-3g = 150
0.010), C22:1 SM (DV2-V1 CTL: -0.02 ± 0.10%; 3g-PL: +0.65 ± 0.27%; 5g-PL: +0.56 ± 0.23%; Pgroup 151
= 0.07; PPL = 0.021) and C20:0 Cer species (DV2-V1 CTL: -1.44 ± 0.65%; 3g-PL: +0.38 ± 0.56%; 5g-152
PL: +0.47 ± 0.60%; Pgroup = 0.057, PPL = 0.016) (Supplemental Table 2). 153
154
Milk PL-induced modulations of serum SM and Cer profiles are correlated with the decrease of
155
CVD risk markers
156
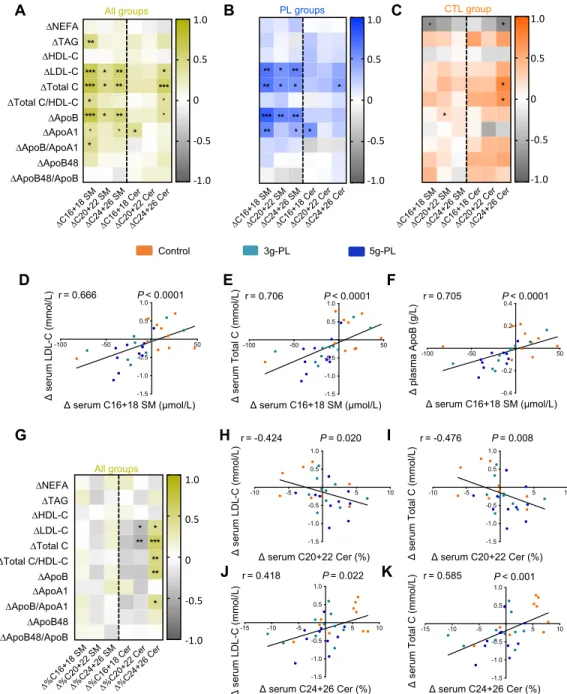
Results demonstrated a significant correlation between change in serum SM (particularly C16+18 SM 157
species) and DLDL-C, Dtotal C and DApoB (Figure 2A, P < 0.001). These correlations were mainly 158
mediated by the dietary intervention regardless of milk PL dose (Figure 2B; versus no correlation in 159
control group, Figure 2C), as also illustrated in Figure 2D-F by the specific correlations between 160
DC16+18 SM species and DLDL-C (r = 0.666, P < 0.0001), Dtotal C (r = 0.706, P < 0.0001), and 161
DApoB (r = 0.705, P < 0.0001). Fewer correlations were observed between changes in Cer 162
concentrations and those of blood lipids. Because results revealed changes in the SP species 163
proportions (Supplemental Table 2), we analyzed potential correlations with blood lipid concentrations 164
(Figure 2G). Changes in C24+26 Cer species proportions positively correlated with DLDL-C (r = 165
0.418, P = 0.022), Dtotal C (r = 0.585, P < 0.001) (Figure 2, G and J-K) and DApoB (r = 0.492, P = 166
0.006). Conversely, variations in C20+22 Cer species proportions negatively correlated with DLDL-C 167
(r = -0.424, P = 0.020) and Dtotal C (r = -0.476, P = 0.008) (Figure 2, H-I). In parallel, we determined 168
the magnitude effect of DC16+18 SM, D%C20+22 and D%C24+26 Cer species on Total C, LDL-C 169
and ApoB by estimating the regression coefficient associated to each variable in a general linear mixed 170
model. This shows that each variation of 1 µM of DC16+18 SM species would result in a variation of 171
0.0074 mM of LDL-C (P = 0.0065), 0.0088 mM of total C (P = 0.0042), 0.0017 g / L of ApoB (P = 172
0.017). The magnitude effect of D%C20+22 species on cardiovascular lipid markers was not 173
significant, while each variation of 1% of DC24+26 Cer species proportions would result in a variation 174
of 0.039 mM of LDL-C (P = 0.040), 0.054 mM of total C (P = 0.010) and 0.010 g / L of ApoB (P = 175
0.041). 176
177
Milk PL decrease SM content in intestine-derived chylomicrons and impact their SM and Cer
178
molecular profiles
179
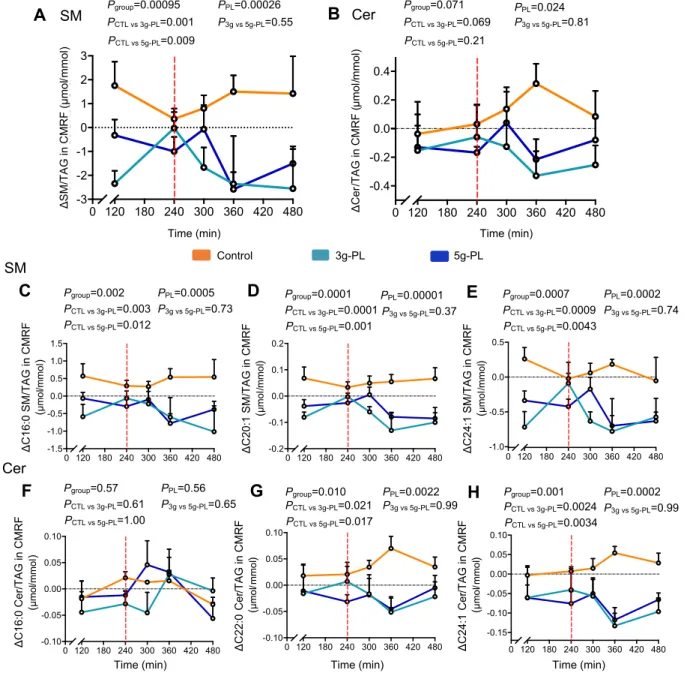
The variations of plasma concentrations of CMRF-bound SM (CMRF-SM) decreased in the 5g-PL 180
group during all the postprandial period (Pgroup = 0.015; PCTL-5g = 0.013), and the variation of plasma 181
CMRF-Cer concentration also tended to decrease (Pgroup = 0.053, PPL = 0.051) (Supplemental Table 182
3). To focus on potential modifications of chylomicron lipid composition regardless of their circulating 183
concentration, we also determined their enrichment in SP by analyzing the SM/TAG and Cer/TAG 184
ratios in CMRF particles. Milk PL reduced significantly CMRF-SM/TAG ratio (Figure 3A, Pgroup = 185
0.00095, PPL = 0.001; PCTL-3g = 0.001; PCTL-5g = 0.009), notably after lunch that contained the test cream 186
cheese (240-480 min). CMRF-Cer/TAG ratio also significantly decreased in milk PL-treated groups, 187
regardless of dose (Pgroup = 0.071, PPL = 0.024) (Figure 3B). Milk PL effects on SM molecular 188
composition in intestine-derived chylomicrons were mainly mediated by a significant decrease in 189
several CMRF-SM species content relative to CMRF-TAG including C16:0, C16:1, C18:0, C18:1, 190
C20:1, C24:0 and C24:1 SM species (Figure 3, C-E; Supplemental Figure 2). Changes in CMRF-Cer 191
molecular composition was mainly driven by a decrease of C22:0 and C24:1 Cer species content 192
relative to CMRF-TAG (Figure 3, F-H; Supplemental Figure 2). 193
194
Ileostomy model reveals an important increase of saturated SM and Cer species in ileal efflux
195
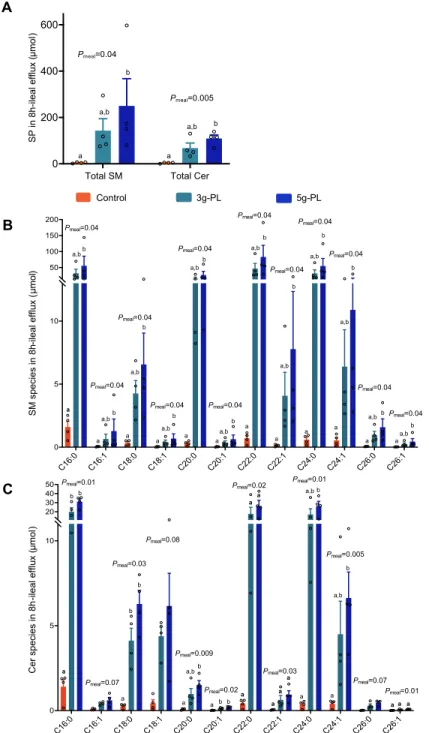
We performed a complementary mechanistic study in ileostomy patients to determine whether the 196
digestive fate of milk PL in the upper gastrointestinal tract may contribute to the above results, notably 197
before absorption and enterocyte metabolism (29). Each milk PL-enriched meal resulted in higher 8h-198
cumulative ileal efflux of total SM and Cer (CTL: 4.4 ± 1.3 µmol; 3g-PL: 143.2 ± 51.4 µmol; 5g-PL: 199
250.2 ± 117.3 µmol, Pmeal = 0.04; CTL: 3.5 ± 1.0 µmol; 3g-PL: 67.9 ± 21.5 µmol; 5g-PL: 109.1 ± 15.0 200
µmol, Pmeal = 0.005 respectively, Figure 4A). Detailed molecular composition analysis showed a 201
significant increase in C16:0 SM (CTL: 1.6 ± 0.4 µmol; 3g-PL: 32.2 ± 12.7 µmol; 5g-PL: 55.7 ± 29.9 202
µmol, Pmeal = 0.04), C20:0 SM (CTL: 0.3 ± 0.1 µmol; 3g-PL: 15.2 ± 4.8 µmol; 5g-PL: 26.7 ± 11.6 203
µmol, Pmeal = 0.04), C22:0 SM (CTL: 0.7 ± 0.2 µmol; 3g-PL: 46.9 ± 15.8 µmol; 5g-PL: 83.3 ± 36.3 204
µmol, Pmeal = 0.04) and C16:0 Cer (CTL: 1.4 ± 0.4 µmol; 3g-PL: 20.0 ± 4.4 µmol; 5g-PL: 31.1 ± 3.1 205
µmol, Pmeal = 0.01), C20:0 Cer (CTL: 0.1 ± 0.0 µmol; 3g-PL: 1.0 ± 0.3 µmol; 5g-PL: 1.5 ± 0.3 µmol, 206
Pmeal = 0.009), C22:0 Cer species (CTL: 0.4 ± 0.1 µmol; 3g-PL: 17.7 ± 7.2 µmol; 5g-PL: 26.4 ± 6.3 207
µmol, Pmeal = 0.02) (Figure 4, B and C). However, the analysis of SP species relative abundance 208
revealed a reduction in the proportions of atherogenic C16:0, C18:0 SM and C24:1 Cer species (Pmeal 209
= 0.02, Pmeal = 0.04 and Pmeal = 0.04 respectively), and an increase in the proportions of C22:0 and 210
C24:0 SM species (Pmeal = 0.005 and Pmeal < 0.001) and Cer species (Pmeal = 0.02 and Pmeal = 0.04, 211
respectively; Supplemental Figure 3, A and B). Considering that such lipids cannot be absorbed 212
directly as such by enterocytes and that SM digestion is incomplete in the gastrointestinal tract (30), 213
we explored the molecular composition of SM and Cer species in fecal samples collected by the 214
postmenopausal women included in the VALOBAB-C trial. 215
216
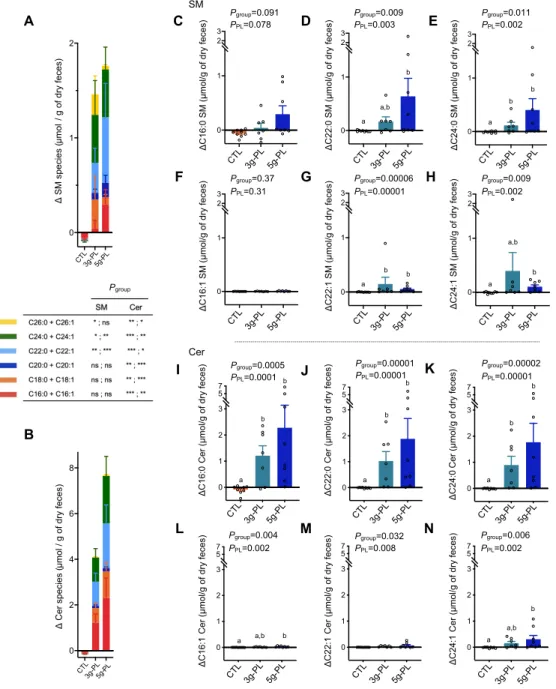
Fecal sphingolipidome is largely enriched in Cer after milk PL supplementation
217
The 4-week nutritional intervention significantly increased total fecal SM and Cer in milk PL 218
supplemented groups compared to control (Figure 5, A and B) (DSM: CTL -0.09 ± 0.04 µmol; 3g-PL 219
+1.46 ± 0.95 µmol; 5g-PL +1.76 ± 0.83 µmol / g of dry feces, Pgroup = 0.006, PPL = 0.001; DCer: CTL 220
-0.15 ± 0.08 µmol; 3g-PL +4.09 ± 1.38 µmol; 5g-PL +7.69 ± 2.95 µmol / g of dry feces, Pgroup = 0.0002, 221
PPL = 0.00006). Altogether, this increase of total fecal Cer was higher than that of SM (P = 0.015, DCer 222
versus DSM in milk PL groups). The detailed molecular analysis revealed a major impact of 223
intervention on saturated SP species, notably an increase of C22:0 SM (Pgroup = 0.009, PPL = 0.003), 224
C24:0 SM (Pgroup = 0.011, PPL = 0.002), C16:0 Cer (Pgroup = 0.0005, PPL = 0.0001), C22:0 Cer (Pgroup = 225
0.00001, PPL = 0.00001) and C24:0 Cer species (Pgroup = 0.00002, PPL = 0.006) (Figure 5, C-E and I-226
K, Supplemental Table 4). To a lower extent, the milk PL supplementation also increased the fecal 227
amount of some unsaturated SP species (Figure 5, F-H and L-N, Supplemental Table 4). 228
DISCUSSION
229 230
This study is the first to report how the daily consumption of a significant amount of dietary SP present 231
in milk PL impacts the endogenous sphingolipidome in the bloodstream and along the gastrointestinal 232
tract in humans. Firstly, we reveal that the increased intake of milk SM and Cer did not increase their 233
total amount in serum, but the molecular composition of SM and Cer species was markedly improved 234
by the 4-week intervention with milk PL. Notably, the atherogenic C16+18 SM and C24:1 Cer species 235
decreased significantly despite their increased intake from the provided supplementation. These 236
variations even correlated with the beneficial impacts of milk PL on lipid cardiovascular markers 237
reported previously (29). In addition, the Mayo Clinic published the reference values for circulating 238
level of C24:1 Cer species (i.e., 0.65-1.65μM, https://www.mayocliniclabs.com). Here, we found that 239
serum C24:1 Cer species concentration returned within the normal range after the intervention in the 240
5g-PL group only (V1: 1.96 ± 0.17 μM, V2: 1.59 ± 0.16 μM, Pgroup = 0.033). Our results demonstrate 241
that milk PL supplementation positively impacts the endogenous sphingolipidome, with the specific 242
decrease of serum SM and Cer species known for being associated with inflammation and metabolic 243
disorders (31, 32). Previous studies reported that high concentrations of serum C18:0, C20:0, and 244
C24:1 Cer species are associated with type 2 diabetes, while high serum levels of C16:0 Cer and C18:0 245
SM species correlate with insulin resistance (33). Regardless of milk PL dose, the analysis of the 246
relative abundance of each SM and Cer species in the bloodstream revealed a significant increase in 247
the proportions of C20:0 SM, C22:1 SM and C20:0 Cer species that are normally poorly detected in 248
human blood but found in non-negligible amount in MFGM. We also estimated to what extent the
249
changes in major SM or Cer species could explain the relationships between milk PL consumption and
250
enhanced lipid cardiometabolic risk factors. According to the estimated regression coefficients, 251
assuming a mean variation of C16+18 SM species of about -22 µM as observed in the 5g-PL group,
its mean effect is expected to be (i) -0.16 mM on LDL-C (with a global effect of -0.34 mM observed
253
in this group) (29), and (ii) -0.19 mM on total C (with an observed effect of -0.4 mM). Moreover,
254
assuming a mean variation of the relative proportions of C24+26 Cer of about -0.83% as observed in
255
the 5g-PL group, its mean effect is expected to be (i) -0.032 mM on LDL-C and (ii) -0.045 mM on
256
total C. These results show that changes in serum total C and LDL-C are significantly associated with
257
changes in serum C16+18 SM species, and to a lower extent with the modulation of the relative
258
proportions of C24+26 Cer species (here mainly driven by the variation of C24:1 Cer species).
259 260
To investigate underlying mechanisms involved in the effects of milk PL consumption on circulating 261
SP species, we first estimated the contribution of intestine-derived chylomicrons, which are the dietary 262
lipid carriers secreted by the small intestine during the postprandial phase. Chylomicrons represent a 263
major source of circulating SM, although the mechanisms by which SM is inserted into these 264
lipoproteins have not been established (34). Dietary SM and Cer are not absorbed as such; their 265
lipolysis products released in the small intestine can be absorbed and a small proportion of their 266
sphingoid bases contribute to the newly formed SP ultimately found in chylomicrons (34). Herein, the 267
4-week milk PL supplementation decreased chylomicron total SM and Cer, especially during the 268
second part of the postprandial period (after test cheese consumption), without change in particle size 269
(i.e., no change in the surface-to-TAG core ratio) (29). These modifications were also observed at 270
species level for almost all SM and Cer species, including those whose concentrations in total serum 271
decreased, namely C16:1 SM, C20:1 SM and C24:1 Cer. Because SP are located at the surface of 272
lipoproteins, this reveals a lower SP amount in the chylomicron composition. Whether this is due to 273
decreased SM synthesis in enterocytes after intervention with dietary SP remains to be elucidated. 274
Milk PL also modified SM molecular profile in chylomicrons with an increase in the proportions of 275
C20 SM species and a decrease in the proportions of C24:1 SM species, possible precursor of C24:1 276
Cer via acid SMase (35). These results suggest that these modifications may originate from the gut or 277
from enterocyte metabolism during the intestinal digestion and absorption processes. 278
279
To determine the contribution of SM and Cer in the intestine, we analyzed their molecular profiles in 280
the gut lumen of ileostomy patients after the acute intake of milk PL, as well as in feces of the 281
postmenopausal women after 4-week milk PL supplementation. These analyses revealed an increase 282
of both total SM and Cer in gut contents in milk PL supplemented groups. At a molecular level, the 283
amounts of most detected SP species of interest were significantly increased by milk PL consumption, 284
especially C16:0, C22:0, C24:0 SM and Cer, and also C20:0 SM species. Altogether, SM and Cer 285
species whose amounts increased in gut contents reflect species that are present in milk PL-enriched 286
cheeses. These results are consistent with the fact that SM digestion is incomplete, as only 75-80% of 287
milk SM was reported to be digested and absorbed in humans (36). It has been previously reported that 288
ileal efflux of C16:0 SM was only ~10% of ingested dose versus ~20% for C24:0 SM after intake of 289
lower doses of SM, i.e., 50-200 mg (36), suggesting that longer-chain saturated species of SM and Cer 290
are less efficiently digested and absorbed. In addition, the digestion of SM being slow and incomplete, 291
it may induce an important increase of non-digested SM and non-absorbed Cer in the lumen content 292
(3, 30), which may explain the present results. Moreover, fecal metabolites, including the various lipid 293
species normally found in feces, may originate directly from food, but also from host cells, bacterial 294
cell components or indirectly from the molecular conversion of SP by gut microorganisms or host 295
enzymes (37). In a recent study performed in healthy patients, plasma and fecal lipidomic analyses 296
demonstrated that the lipid fraction of fecal samples contains significant amounts of Cer species with 297
only two SM species detected, while plasma samples commonly contain significant amounts of several 298
SM species and lower quantities of Cer (37, 38). Herein, we chose to determine the concentration of 299
12 SM and Cer species of interest in serum and we were also able to quantify all these species in feces. 300
In ileostomy patients, we report higher total SM amount in ileal content compared to total Cer, while 301
total Cer was largely more abundant in the fecal samples compared to total SM. The latter could be 302
the result of several metabolic pathways such as the conversion of dietary SM species in Cer species 303
by host enzymes present in the lumen and in enterocytes. At a molecular level, monounsaturated SM 304
and Cer species increased in both ileal efflux and fecal samples, despite being found in minority in test 305
cheeses compared to saturated species. A potential differential absorption process between 306
monounsaturated and saturated species would thus deserve to be investigated. Interestingly, the major 307
changes reported in the serum after the dietary intervention with milk PL mainly concern 308
monounsaturated SM and Cer species. It may suggest that some modifications of serum and 309
chylomicron SP profiles occur in response to changes in the SP fate in the small intestine. 310
The increased amount of total Cer reported in the fecal samples of milk PL supplemented volunteers 311
could also be the result of gut bacteria metabolism, because several bacteria, including those belonging 312
to the Bacteroides genus, were reported to be able to produce SP (39, 40). Very recently, Lee et al. 313
demonstrated in female mice that sphinganine, which is the main sphingoid base of SM and Cer present 314
in MFGM, is assimilated by gut bacteria (41). In this study, 99% of gavaged fluorescent sphinganine 315
was assimilated by Bacteroides spp.; the remaining 1% by Prevotella spp., Lactobacillus spp. and 316
Bifidobacterium genus (41). Also, Bifidobacterium spp., which are known to be increased after milk
317
SM consumption in rodents (42, 43), can release free milk Cer by hydrolyzing milk gangliosides (44). 318
In this context, the contribution of the gut microbiota SP metabolism in the effects of milk PL 319
consumption on the intestinal and circulating SM and Cer profiles cannot be ruled out. 320
321
To further explore potential endogenous mechanisms, we analyzed whole blood cells gene expression 322
of some key enzymes involved in SM synthesis (SM synthase 1 and 2, SGMS1 and SGMS2) and 323
hydrolysis (an acid sphingomyelinase – SMase, also called SM phosphodiesterase 1, SMPD1). We 324
found only slight effects on SGMS1 and SGMS2 expression (Supplemental Figure 4), while SMPD1 325
expression decreased in milk PL-treated groups compared to control (Pgroup = 0.052, PPL = 0.030). As 326
previously described, acid SMase activity in plasma is increased in acute coronary syndromes (45). 327
However, these results were not likely to explain the changes observed in the circulating 328
sphingolipidome. It would be also relevant to consider the possible contribution of intestinal enzymes 329
given that the small intestine is rich in enzymes known to contribute to SP metabolism, such as alkaline 330
SMase that converts SM in Cer (35). Unfortunately, we could not collect intestinal biopsies from the 331
healthy postmenopausal women in the present study. However, in an 8-week milk PL supplementation 332
performed (0.9 wt%) in high-fat diet fed mice (22), we observed a significant increase of jejunal 333
expression of Enpp7, coding for the alkaline SMase, compared to the high-fat control group (1.7-fold 334
change). Interestingly, previous preclinical studies reported opposite impacts of Cer production 335
depending on SMase activity: Cer generated from neutral or acid intestinal SMases are more prompted 336
to exert pro-inflammatory effects while Cer generated from alkaline SMase promote anti-inflammatory 337
pathways (46, 47). The conversion of exogenous SM in Cer by the alkaline SMase could also play a 338
role in the inhibition of cholesterol absorption (47, 48), which is concordant with the present findings 339
and supports the role of SM metabolism in cholesterol absorption. Previous preclinical studies 340
demonstrated that dietary SM are able to play a beneficial role on cholesterol levels and more largely 341
in the prevention of cardiometabolic disorders (25, 26, 49, 50). In mice fed high-fat diets, 342
supplementation with egg SM lowered intestinal absorption of cholesterol and lipids with a reduction 343
of hepatic cholesterol (51). In vitro, both SM and Cer inhibit cholesterol absorption in Caco-2 intestinal 344
epithelial cells (47). However, it has been suggested that small SM catabolites, such as Cer and 345
sphingosine, might be the effectors of the beneficial impact of milk SM (2). The present findings 346
consolidate our previous clinical results given that the observed reductions in circulating total 347
cholesterol, LDL-C and ApoB (29) significantly correlate with the reduction of serum pro-348
inflammatory C16+18 SM in the milk PL-treated groups. In accordance with above mentioned studies, 349
our findings also bring new information and insights on Cer in the gastrointestinal tract as signaling 350
molecules potentially participating in the beneficial effect of milk PL consumption on cholesterol 351
metabolism. 352
353
The present study has several strengths but also some limitations that need to be outlined. The clinical 354
trials were performed in real-life in a targeted population (i.e., overweight postmenopausal women) 355
known to present an important risk of cardiovascular diseases, but results cannot be extrapolated to 356
other populations. We took care to include 4-day dietary records before and after the nutritional 357
intervention to show that volunteers of the three groups did not differentially modify their energy and 358
dietary intakes (Supplemental Table 5). Many parameters of the present study were measured in a 359
limited number of subjects. Nevertheless, we performed for the first time a broad sphingolipidomic 360
analysis, including a large scale of measurements of SM and Cer species at both fasting and 361
postprandial states in various biological compartments: serum, chylomicron fractions, and feces, but 362
also in 8 h-cumulative ileal efflux from ileostomy patients. The sphingolipidome is a complex and 363
dynamic system that encompasses several important SP families, including dihydroceramides, 364
gangliosides or cerebrosides (17). Considering the variations in the sphingoid bases, FA and 365
headgroups of SP molecules, the number of species exceeds thousands. SP are localized in cellular 366
membranes (lipid rafts) and are carried by albumin, lipoprotein particles, blood cells and platelets in 367
the bloodstream (52, 53). Based on the present findings, future studies should thus explore the 368
sphingolipidome in other blood compartments and potentially epithelial cells to better understand the 369
fate of milk SM and Cer species. Furthermore, we cannot exclude the potential contribution of other 370
components of the PL fraction/MFGM from buttermilk concentrate and/or the lower milk TAG content 371
in the PL-enriched cheeses in the reported metabolic effects in both trials. Putting aside these 372
limitations, this is to the best of our knowledge the first time that such a wide sphingolipidomic analysis 373
is performed in humans in response to a controlled dietary intervention in the context of 374
cardiometabolic disorders. The present study clearly responds to the need to identify relevant dietary 375
strategies to improve the endogenous SP metabolism, which was highlighted in recent reviews (2, 54). 376
377
The present findings uncover that milk PL supplementation providing particular SP species markedly 378
improved the endogenous sphingolipidome by reducing serum atherogenic C16+18 SM and C24:1 Cer 379
species in overweight postmenopausal women at risk of cardiovascular disease. These reductions in 380
SP were (i) correlated with, and (ii) significantly involved in the decrease of lipid cardiovascular risk 381
markers induced by milk PL intervention. We further demonstrate that despite a significant ingestion 382
of SP provided by milk PL, SM and Cer concentrations decreased in intestine-derived chylomicrons 383
while their concentration increased in gut contents. The related differences in SM and Cer profiles 384
between gut contents and circulating compartments suggest that small intestinal mechanisms occurred 385
during digestion and absorption processes of milk SM and Cer, and that a contribution of the gut 386
microbiota may be possible. Considering that milk PL are naturally found in large amounts in 387
buttermilk, which is still poorly valued in human food, such bioactive lipids could be envisioned as 388
promising ingredients for the development of new functional foods providing health effects in the 389
frame of chronic diseases. 390
METHODS
391 392
VALOBAB-C trial. Details of the VALOBAB-C study have been published previously (29). Briefly,
393
the multicenter study used a double-blind randomized placebo-controlled parallel design and was 394
conducted in 58 overweight postmenopausal women, without metabolic syndrome but at risk of CVD. 395
The eligibility criteria and sample size calculation have been described previously (29). Volunteers 396
were randomly divided into 3 groups. Randomization was performed electronically using random 397
number generator and supervised by the biostatistician (29). Both volunteers and investigators were 398
kept blind regarding group allocation. Volunteers were subjected to the daily consumption of either 399
control or milk PL-enriched cream cheese (100 g of cream cheese containing 13 g of total fat including 400
0 (control), 3 or 5g-milk PL during 28 days (n = 19; 19 and 20, respectively). The strategic approach 401
was to formulate cheeses with identical total lipid content with partial substitution of TAG by milk PL 402
to avoid increased energy intake. The 3g- and 5g-PL cream cheeses were based on a butterserum 403
concentrate rich in milk PL prepared according to Gassi et al. (55) representing a 3- to 5-fold increased 404
daily consumption of milk SM and Cer compared to an estimated intake of dairy SP in Western 405
countries) (Supplemental Table 1) (17). After the “run-in” period, volunteers were subjected to a first 406
exploratory visit (V1), followed by 28 days of intervention and ended by a second exploratory visit 407
(V2). During each visit, overnight fasted-participants received a breakfast meal rich in fat and 408
carbohydrates and 4 h later, they consumed a standardized lunch containing the corresponding test 409
cream cheese, thus dividing the exploratory visit in two specific postprandial periods (0-240 min and 410
240-480 min, as detailed previously) (29). Volunteers were asked to continue their usual diet and 411
physical activity all along the study. Participants were told to avoid the consumption of cheeses other 412
than the test cream cheese, and listed foods that may influence the gut microbiota composition. 413
Particular attention was drawn to standardize the meal consumed the evening before each postprandial 414
exploratory visit. Subjects recorded their food consumption for 4 days before and after the nutritional 415
intervention. No difference in changes in energy and macronutrient intakes, fibers, alcohol, cholesterol
416
and FA intakes was observed between groups (29). The primary outcome was the impact of the
4-417
week milk PL consumption on fasting serum concentration of total C (29). The predefined secondary 418
outcomes tested in the present study were related to the impact of the dietary intervention on serum, 419
chylomicron and fecal SM and Cer profiles. Considering available samples and practical/technical 420
aspects, some analyses were performed on a subgroup of individuals only (Figure 1). 421
422
VALOBAB-D trial. The double-blind RCT was performed in 4 ileostomy patients following a
423
crossover design, as previously described (29) (Supplemental Figure 5). An ileostomy is a surgical 424
opening in the abdomen in which a piece of the ileum is brought outside the abdominal wall to create 425
a stoma through which digestive contents leave the body and are collected in a pouch (ileal efflux). 426
Selected patients according to eligibility criteria were invited to participate to 3 distinct exploratory 427
visits separated by a 4 to 6-week washout period (29). During each visit, overnight fasted patients 428
consumed one of the test cream cheese containing 0, 3- or 5g-milk PL and their ileal efflux was 429
collected over 8 h. Sequences of meal allocation were based on random number generator (29). Both 430
patients and investigators were kept blind regarding meal allocation. 431
432
Isolation of chylomicron-rich fractions (CMRF). Isolation of intestine-derived CMRF was
433
performed by ultracentrifugation from plasma collected at different time points as previously described 434
(29, 56). 435
436
Analysis of serum phospholipids. Total lipids were extracted from 300 µL of serum with 437
chloroform:methanol (2:1, v/v) according to the method of Folch (57). After drying under nitrogen, 438
total lipids were determined gravimetrically and were dissolved precisely with 1 mL of 439
chloroform:methanol (2:1, v/v). This stock solution of total lipids was stored at -20 °C. Phospholipid 440
classes were then separated by high-performance liquid-chromatography coupled to an evaporative 441
light-scattering detector (SEDEX LT-ELSD SOLT, HPLC DDL SEDERE, ThermoFisher) (58, 59), 442
using a silica normal-phase column (Lichrospher Si 60, 3 µm, 100 x 4.6 mm, Waters). The 443
chromatographic separation was carried out using a linear binary gradient according to the following 444
scheme: t0 min: 90%A, 10%B 0%C, t20 min 42%A 52%B 6%C, t30 min 32%A 52%B 16%C, t55 445
min 30%A 70%B 0%C, t60 min 90%A 10%B 0%C. Total chromatographic run time was 75 min per 446
sample, which consisted of a 60 min analysis and 15 min to restore initial conditions and re-447
equilibration. Eluent A consisted of hexane:tetrahydrofuran (99:1, v/v), eluent B of 448
isopropanol:chloroform (80:20, v/v/v) and eluent C of isopropanol:water (50:50, v/v/v). The flow rate 449
of the eluent was 1mL/min. Identification of phospholipids and lysophospholipids was carried out by 450
comparison with the retention time of pure standards (Avanti polar Lipids, USA). Calibration curves 451
for each compound were calculated from the area values of stock solution of pure standards between 452
0.1 to 1 mg / mL. Results were analyzed using Chromeleon software (Thermofisher) and expressed as 453
µg / 100 µL of serum. 454
455
Analysis of SM and Cer molecular profiles. Concentrations of SM and Cer molecular species of
456
interest were determined in serum, CMRF, ileal efflux, fecal samples and also in test cream cheese 457
according to the method by Kyrklund (60) which was optimized as previously described (27). Ileal 458
content from patients with ileostomy and fecal samples obtained from VALOBAB-C trial’s volunteers 459
were freeze-dried and approximately 15-40 mg of lyophilized matter, accurately weighted, were 460
dissolved in 1mL of apyrogen water prior to lipid extraction. Briefly, for each sample, total lipids were 461
extracted using 2.5 mL of chloroform:methanol (1:2 v/v) in the presence of two deuterium-labelled 462
internal standards (N-heptadecanoyl-D-erythro-sphingosine (C17:0-Ceramide); N-palmitoyl(d31)-D-463
erythro-sphingosylphosphorylcholine (C16:0D31SM) from Avanti Polar Lipids, Alabama, USA). 464
After 2 h of shaking and centrifugation (10 min, 1900 g), samples were evaporated with liquid nitrogen. 465
The dry samples were dissolved in 1.5mL of chloroform:methanol (1:2 v/v) and sonicated 30 sec on 466
ice. SP were then isolated by saponification with potassium hydroxide during 2 h at 37 °C and then 467
fractionated and desalted using reverse-phase Bond Elut C18 columns. The final elutions were done 468
with 2x1mL of chloroform:methanol (12:1 v/v) and 2x1mL of chloroform:methanol (1:2 v/v) prior to 469
the evaporation of samples with liquid nitrogen. The dry extracts were kept at -20 °C until tandem 470
mass spectrometry analysis (MS/MS). Samples were homogenized in 1mL of chloroform:methanol 471
(1:2 v/v) and analyzed by direct flow injection on a triple-quadrupole mass spectrometer (API 4500 472
QTRAP MS/MS; Sciex Applied Biosystems, Toronto, Canada) in the positive ionization mode using 473
the multiple reaction monitoring (MRM) method. Cer and SM species were measured separately, with 474
two different methods with a flow rate of 200 μl / min (analysis time of 3 min). We quantified 12 SM 475
and Cer species of particular interest regarding cardiovascular risk, being the most abundant in human 476
and also found in bovine milk in different proportions (Table 1). The concentration of each molecular 477
species was calculated from the ratio of its signal to that of the corresponding internal standard. Total 478
Cer and SM concentrations were the sum of the concentrations of the various species. Results are 479
presented based on the assumption of sphingosine d18:1 as the major sphingoid base for determined 480
SM and Cer species. These analyses were performed on a MS/MS platform accredited following EN 481
NF ISO 15189 requirements. The coefficient of variation (CV) for total SM and Cer was 4.4% and 482
5.4% respectively. For the most abundant isoforms (C16:0, C22:0, C24:0, C24:1 SM/Cer), the average 483
CV was 7 ± 4%. The CV for the less abundant isoforms is slightly higher: 17 ± 5% for Cer and 9 ± 6% 484
for SM species. These elements are in agreement with the Methods and Protocols section of 485
LIPIDMAPS for the analysis of SP (61). 486
487
Gene expression analysis in whole blood cells. The PAXgene™ Fresh Whole Blood RNA samples
488
were processed using the PAXgene™ Blood RNA Kit based on column purification of nucleic acids 489
(PreAnalytiX, QIAGEN) as previously described (29). After reverse transcription, real-time PCR 490
assays of SGMS1 (F-CCTGGTATGCATTTCAACTG; R-TGGCCGCTGTACAGATAGTC), SGMS2 491
CAATAGTGGGACGCAGATTC and R-GGACAATCCACCACCAGAAA) SMPD1 (F-492
CATCCTGCCAGGTTACATCG; R-CACACCTCCACCATGTCATC) were assessed using a Rotor-493
Gene 6000 (QIAGEN) and obtained values were normalized to the expression of the housekeeping 494
gene PGK1 (phosphoglycerate kinase 1, F-CCATGGTAGGAGTCAATCTG; R-495
AGCTGGATCTTGTCTGCAAC). 496
497
Statistics. VALOBAB-C: Continuous variables are described as mean ± SEM. The 4-week intervention
498
impact was determined by comparing the variation of each variable between exploratory visits (i.e., 499
ΔV2-V1) between groups (Pgroup) (i.e., control versus 3g-PL versus 5g-PL group; Figure 1). Single 500
time point parameters were analyzed through a general linear model and a subsequent Tukey’s post 501
hoc test. Pposthoc corresponds altogether to PCTL vs 3g-PL; PCTL vs 5g-PL and P3g vs 5g-PL as mentioned in the 502
text and figures. For parameters analyzed along the postprandial period, a mixed linear modelling 503
(MIXED procedure) was performed to account for within-subject repeated measures, seeking for main 504
effects, at least “group” or time effect and interaction. Post hoc analyses were performed following 505
Tukey-Kramer’s test to both detail main effects and control for familywise type I error. In case of 506
residual distribution departing from normality, the analyses were performed on ranks. Global “milk 507
PL” effect was also considered as binary factor, and statistical analysis was performed by lumping 508
together milk PL doses in one group versus control. Spearman’s correlation analyses were also 509
performed between blood lipid markers of cardiovascular risk and serum SM and Cer species grouped 510
in 3 subclasses (i.e., C16+C18; C20+C22 and C24+C26 SM or Cer species). In order to check for any 511
confounding effect, these analyses were also carried-out adjusting for center, age and waist 512
circumference quartiles. Analyses were performed on SAS v9.4 (SAS Institute Inc. Cary, NC, USA) 513
with a two-sided type I error set at 0.05. In order to determine to what extent the changes in SM and 514
Cer species could explain their relationship with lipid markers of cardiometabolic risk, we performed 515
additional analyses. We aimed to adjust the analysis of DLDL-C, Dtotal C and DApoB variables with 516
DC16+18 SM, D%C20+22 and D%C24+26 Cer species variables. We first transformed each covariate 517
as a 4 classes ordinal variable, and then checked for a linear relationship between each covariate and 518
each response variable, seeking for almost constant effect from an ordinal class to its neighbor. Since 519
we found merely monotonic relationship, it allowed us to include these covariates in their original 520
continuous form, associated with a unique and relevant regression coefficient, thereby simplifying 521
interpretation. We then reported the magnitude of the effect of DC16+18 SM, D%C20+22 and 522
D%C24+26 Cer species on Dtotal C, DLDL-C and DApoB by estimating the coefficient of regression 523
associated to each variable in the mixed linear general model. VALOBAB-D: Data are presented as 524
mean ± SEM and were analyzed with GraphPad Prism 8.3. For normally distributed data (Shapiro-525
Wilk’s test), repeated measures one-way ANOVA were performed followed by Tukey’s post hoc test. 526
For non-normally distributed data, a Friedman’s test was performed followed by Dunn’s post hoc test. 527
The variation between groups was reported using Pmeal values and post hoc analyses were added 528
directly on corresponding figures using a, b letters. Graphs: All graphs and heat maps were created 529
using GraphPad Prism 8.3 (San Diego, CA, USA). 530
531
Study approval. Both clinical trials were approved by the Scientific Ethics Committee of Lyon
Sud-532
Est-IV and ANSM (French Agency for the Safety of Health Products) and registered at Clinical Trials 533
(NCT02099032, NCT02146339). The clinical trials were conducted at the Human Nutrition Research 534
Centre Rhône-Alpes (CRNH-RA; Lyon, France) and at the Human Nutrition Research Centre 535
Auvergne (CRNH-A; Clermont-Ferrand, France) according to the Second Declaration of Helsinki and 536
the French Huriet-Serusclat law. All data reported in the current article were obtained from samples 537
stored in the biobank during the clinical studies, for which participants gave a written consent in order 538
prior to inclusion in the study to use the samples for further metabolic analyses. All authors had access
539
to the study data and reviewed and approved the final manuscript.
540 541
Author Contributions
542
MLB: conceptualization, validation, formal analysis, investigation, data curation, writing - original 543
draft, visualization; CV: conceptualization, methodology, validation, formal analysis, investigation, 544
data curation, writing - original draft, visualization; ECom and LJ-C: methodology, formal analysis, 545
investigation, data curation; MLe: conceptualization, validation, formal analysis, investigation, data 546
curation; FJ: methodology, validation, formal analysis, investigation; MT, SP, EL, A-EB, KB, JD, AD 547
and CC: investigation; EM: methodology, validation, investigation; CR: formal analysis, data curation; 548
PG, NL and ECot: provided essential resources; AB-D: validation, formal analysis, investigation; 549
MLa: conceptualization; SL-P: conceptualization, methodology, validation, investigation; LO: 550
methodology, formal analysis, data curation; HV: contributed to results interpretation and revised 551
manuscript; CM-B: conceptualization, methodology; DC: conceptualization, methodology, validation, 552
formal analysis, investigation, writing - original draft, data visualization; M-CM: conceptualization, 553
methodology, writing - original draft, data visualization, project administration, supervision and 554
primary responsibility for final article content. All authors read, revised and approved the final 555
manuscript. 556
558
Acknowledgements
559
The authors would like to thank the volunteers of VALOBAB-C and VALOBAB-D trials, Dr N 560
Feugier (CRNH-RA) and A Prulière (CRNH-A) for volunteer recruitment/follow-up; C Maitrepierre, 561
J Peyrat, E Bain (CRNH-RA), Carla Domingues-Faria, Adeline Blot (CRNH-A), D Provenchère, H 562
Parrot, and N Meunier (CRNH-A) for clinical and technical help; M Sothier (CRNH-RA), A Caille, N 563
Lyon-Belgy (CRNH-A) for help in dietary analysis; A Faure, M Cervantes and S Gonin (HCL CBS), 564
P Calmard and J Rivière (UNH) for help in lipid analyses, E Blond (HCL CBS) for stool collection 565
and storage management; C Buisson (CarMeN) for technical assistance in stool lipid extraction; C 566
Jouve (UNH) for technical assistance in blood lipid analysis; A Wauquier for technical assistance on 567
microbiota analysis; K Raynal (ACTALIA Produits Laitiers) and JP Bodin (ENILIA-ENSMIC) for 568
their respective work on test cheese elaboration, analysis and related management; D Kalnin (Philolao) 569
for help in the management of cream cheese randomization; Professor Y François (HCL Lyon Sud), 570
Professor D Pezet and B Gillet and F Morel-Laporte (Clermont Hospital) for screening ileostomy 571
patients list; G Gesan-Guiziou, JY Gassi and F Gaucheron (STLO, Plateforme Lait) for butterserum 572
process setup and assistance in transferring this PL enrichment process to ENILIA; C Bourlieu (STLO) 573
for contribution in buttermilk PL analysis; V Plattner (HCL) and the clinical research department for 574
trials’ monitoring; C Oudin for her skillful assistance in ANR VALOBAB project coordination. 575
Members of the steering committee of ANR VALOBAB project (partners CarMeN/INRA, 576
UNH/UCA, STLO/INRA, ENILIA-ENSMIC, ITERG, MEDIS, CNIEL) are acknowledged for useful 577
discussions. F Laugerette and A Penhoat are acknowledged for their contribution to the high-fat diet 578
study in mice. The authors would like to thank CNIEL (French Dairy Interbranch Organization) for 579
financial support. M Le Barz acknowledges a postdoctoral grant from Société Francophone du Diabète. 580
C Vors and L Joumard-Cubizolles acknowledge ANR for postdoctoral fellowship. M Lecomte thanks 581
Région Rhône-Alpes ARC1 for PhD grant. MC Michalski acknowledges a grant from Groupe Lipides 582
et Nutrition. Part of the artwork in the graphical abstract and Figure 1 has been designed using 583
resources from Flaticon.com, Servier Medical Art and FreePik. We thank Antoine Serafin for 584
elaborating human gut physiology artwork for the Figure 1 and the graphical abstract. 585
586
Data sharing statement. According to French law on the publication of biomedical research/clinical
587
trials, we are not allowed to make the clinical database publicly available on the web, nor send it to 588
third parties, nor to make visible the location of the study associated with the database. 589
REFERENCES
590 591
1. Iqbal J, Walsh MT, Hammad SM, Hussain MM. Sphingolipids and lipoproteins in health and 592
metabolic disorders.. Trends Endocrinol Metab 2017;28(7):506–518. 593
2. Norris GH, Blesso CN. Dietary and Endogenous Sphingolipid Metabolism in Chronic 594
Inflammation.. Nutrients 2017;9(11). doi:10.3390/nu9111180 595
3. Duan R-D. Physiological functions and clinical implications of sphingolipids in the gut. Journal of 596
Digestive Diseases 2011;12(2):60–70.
597
4. Gault CR, Obeid LM, Hannun YA. An overview of sphingolipid metabolism: from synthesis to 598
breakdown. Adv. Exp. Med. Biol. 2010;688:1–23. 599
5. Hannun YA, Obeid LM. Sphingolipids and their metabolism in physiology and disease.. Nat Rev 600
Mol Cell Biol 2018;19(3):175–191.
601
6. Meikle PJ, Summers SA. Sphingolipids and phospholipids in insulin resistance and related 602
metabolic disorders.. Nat Rev Endocrinol 2017;13(2):79–91. 603
7. Gorden DL et al. Biomarkers of NAFLD progression: a lipidomics approach to an epidemic.. J 604
Lipid Res 2015;56(3):722–736.
605
8. Borodzicz S, Czarzasta K, Kuch M, Cudnoch-Jedrzejewska A. Sphingolipids in cardiovascular 606
diseases and metabolic disorders.. Lipids Health Dis 2015;14:55. 607
9. Mantovani A, Dugo C. Ceramides and risk of major adverse cardiovascular events: A meta-608
analysis of longitudinal studies. Journal of Clinical Lipidology 2020;14(2):176–185. 609
10. de Carvalho LP et al. Plasma Ceramides as Prognostic Biomarkers and Their Arterial and 610
Myocardial Tissue Correlates in Acute Myocardial Infarction.. JACC Basic Transl Sci 611
2018;3(2):163–175. 612
11. Wang DD et al. Plasma Ceramides, Mediterranean Diet, and Incident Cardiovascular Disease in 613
the PREDIMED Trial (Prevención con Dieta Mediterránea).. Circulation 2017;135(21):2028–2040. 614
12. Laaksonen R. Identifying new Risk Markers and Potential Targets for Coronary Artery Disease: 615
The Value of the Lipidome and Metabolome.. Cardiovasc Drugs Ther 2016;30(1):19–32. 616
13. Jiang XC et al. Plasma sphingomyelin level as a risk factor for coronary artery disease.. 617
Arterioscler Thromb Vasc Biol 2000;20(12):2614–2618.
618
14. Choi S, Snider AJ. Sphingolipids in High Fat Diet and Obesity-Related Diseases.. Mediators 619
Inflamm 2015;2015:520618.
620
15. Hilvo M, Vasile VC, Donato LJ, Hurme R, Laaksonen R. Ceramides and Ceramide Scores: 621
Clinical Applications for Cardiometabolic Risk Stratification. Front. Endocrinol. 2020;11:570628. 622
16. Le Barz M, Boulet MM, Calzada C, Cheillan D, Michalski M-C. Alterations of endogenous 623
sphingolipid metabolism in cardiometabolic diseases: Towards novel therapeutic approaches. 624
Biochimie 2020;169:133–143.
625
17. Vesper H et al. Sphingolipids in food and the emerging importance of sphingolipids to nutrition.. 626
J Nutr 1999;129(7):1239–1250.
627
18. Drouin-Chartier J-P et al. Comprehensive Review of the Impact of Dairy Foods and Dairy Fat on 628
Cardiometabolic Risk123. Adv Nutr 2016;7(6):1041–1051. 629
19. Thorning TK et al. Whole dairy matrix or single nutrients in assessment of health effects: current 630
evidence and knowledge gaps [Internet]. The American Journal of Clinical Nutrition [published 631
online ahead of print: April 12, 2017]; doi:10.3945/ajcn.116.151548 632
20. Norris GH, Jiang C, Ryan J, Porter CM, Blesso CN. Milk sphingomyelin improves lipid 633
metabolism and alters gut microbiota in high fat diet-fed mice.. J Nutr Biochem 2016;30:93–101. 634
21. Lecomte M et al. Milk polar lipids affect in vitro digestive lipolysis and postprandial lipid 635
metabolism in mice.. J Nutr 2015;145(8):1770–1777. 636
22. Lecomte M et al. Dietary emulsifiers from milk and soybean differently impact adiposity and 637
inflammation in association with modulation of colonic goblet cells in high-fat fed mice.. Mol Nutr 638
Food Res 2016;60(3):609–620.
639
23. Eckhardt ERM, Wang DQ –H., Donovan JM, Carey MC. Dietary sphingomyelin suppresses 640
intestinal cholesterol absorption by decreasing thermodynamic activity of cholesterol monomers. 641
Gastroenterology 2002;122(4):948–956.
642
24. Wat E et al. Dietary phospholipid-rich dairy milk extract reduces hepatomegaly, hepatic steatosis 643
and hyperlipidemia in mice fed a high-fat diet.. Atherosclerosis 2009;205(1):144–150. 644
25. Milard M et al. Acute effects of milk polar lipids on intestinal tight junction expression: towards 645
an impact of sphingomyelin through the regulation of IL-8 secretion?. J. Nutr. Biochem. 646
2019;65:128–138. 647
26. Milard M et al. Milk Polar Lipids in a High-Fat Diet Can Prevent Body Weight Gain: Modulated 648
Abundance of Gut Bacteria in Relation with Fecal Loss of Specific Fatty Acids. Mol Nutr Food Res 649
2019;63(4):e1801078. 650
27. Bourlieu-Lacanal C et al. Polar lipid composition of bioactive dairy co-products buttermilk and 651
butterserums: emphasis on sphingolipid and ceramide isoforms. Food Chemistry 2018;240:67–74. 652
28. Conway V, Gauthier SF, Pouliot Y. Buttermilk: Much more than a source of milk phospholipids. 653
Animal Frontiers 2014;4(2):44–51.
654
29. Vors C et al. Milk polar lipids reduce lipid cardiovascular risk factors in overweight 655
postmenopausal women: towards a gut sphingomyelin-cholesterol interplay. Gut 2020;69(3):487. 656
30. Nyberg L, Nilsson Å, Lundgren P, Duan R-D. Localization and capacity of sphingomyelin 657
digestion in the rat intestinal tract. The Journal of Nutritional Biochemistry 1997;8(3):112–118. 658
31. Chaurasia B, Summers SA. Ceramides - lipotoxic inducers of metabolic disorders.. Trends 659
Endocrinol Metab 2015;26(10):538–550.
660
32. Galadari S, Rahman A, Pallichankandy S, Galadari A, Thayyullathil F. Role of ceramide in 661
diabetes mellitus: evidence and mechanisms.. Lipids Health Dis 2013;12:98. 662
33. Bergman BC et al. Serum sphingolipids: relationships to insulin sensitivity and changes with 663
exercise in humans.. Am J Physiol Endocrinol Metab 2015;309(4):E398-408. 664
34. Nilsson A, Duan R-D. Absorption and lipoprotein transport of sphingomyelin.. J Lipid Res 665
2006;47(1):154–171. 666
35. Nilsson A, Duan RD. Alkaline sphingomyelinases and ceramidases of the gastrointestinal tract.. 667
Chem Phys Lipids 1999;102(1–2):97–105.
668
36. Ohlsson L et al. Sphingolipids in human ileostomy content after meals containing milk 669
sphingomyelin. The American Journal of Clinical Nutrition 2010;91(3):672–678. 670
37. Trošt K et al. Describing the fecal metabolome in cryogenically collected samples from healthy 671
participants. Scientific Reports 2020;10(1):885. 672
38. Bowden J et al. Harmonizing Lipidomics: NIST Interlaboratory Comparison Exercise for 673
Lipidomics Using SRM 1950-metabolites in Frozen Human Plasma. Journal of Lipid Research 674
2017;58(12):2275–2288. 675
39. Olsen I, Jantzen E. Sphingolipids in Bacteria and Fungi. Anaerobe 2001;7(2):103–112. 676
40. Geiger O, Padilla-Gómez J, López-Lara IM. Bacterial Sphingolipids and Sulfonolipids [Internet]. 677
In: Geiger O ed. Biogenesis of Fatty Acids, Lipids and Membranes. Cham: Springer International 678
Publishing; 2019:123–137 679
41. Lee M-T, Le HH, Johnson EL. Dietary sphinganine is selectively assimilated by members of the 680
mammalian gut microbiome. J Lipid Res [published online ahead of print: July 9, 2020]; 681
doi:10.1194/jlr.RA120000950 682
42. Milard M et al. Milk Polar Lipids in a High-Fat Diet Can Prevent Body Weight Gain: Modulated 683
Abundance of Gut Bacteria in Relation with Fecal Loss of Specific Fatty Acids. Mol Nutr Food Res 684
2019;63(4):e1801078. 685
43. Norris GH, Jiang C, Ryan J, Porter CM, Blesso CN. Milk sphingomyelin improves lipid 686
metabolism and alters gut microbiota in high fat diet-fed mice. J Nutr Biochem 2016;30:93–101. 687
44. Heaver SL, Johnson EL, Ley RE. Sphingolipids in host-microbial interactions. Curr Opin 688
Microbiol 2018;43:92–99.
689
45. Pan W et al. Elevation of ceramide and activation of secretory acid sphingomyelinase in patients 690
with acute coronary syndromes.. Coron Artery Dis 2014;25(3):230–235. 691
46. Abdel Hadi L, Di Vito C, Riboni L. Fostering Inflammatory Bowel Disease: Sphingolipid 692
Strategies to Join Forces. Mediators of Inflammation 2016;2016:13. 693
47. Feng D, Ohlsson L, Ling W, Nilsson A, Duan R-D. Generating ceramide from sphingomyelin by 694
alkaline sphingomyelinase in the gut enhances sphingomyelin-induced inhibition of cholesterol 695
uptake in Caco-2 cells.. Dig Dis Sci 2010;55(12):3377–3383. 696
48. Zhang P et al. Alkaline sphingomyelinase (NPP7) promotes cholesterol absorption by affecting 697
sphingomyelin levels in the gut: A study with NPP7 knockout mice. American Journal of 698
Physiology-Gastrointestinal and Liver Physiology 2014;306(10):G903–G908.
699
49. Norris GH, Blesso CN. Dietary sphingolipids: potential for management of dyslipidemia and 700
nonalcoholic fatty liver disease.. Nutr Rev 2017;75(4):274–285. 701
50. Norris GH, Porter CM, Jiang C, Millar CL, Blesso CN. Dietary sphingomyelin attenuates hepatic 702
steatosis and adipose tissue inflammation in high-fat-diet-induced obese mice.. J Nutr Biochem 703
2017;40:36–43. 704
51. Chung RWS et al. Dietary sphingomyelin lowers hepatic lipid levels and inhibits intestinal 705
cholesterol absorption in high-fat-fed mice. PLoS One 2013;8(2):e55949–e55949. 706
52. Hammad SM et al. Blood sphingolipidomics in healthy humans: impact of sample collection 707
methodology.. J Lipid Res 2010;51(10):3074–3087. 708
53. Eich C et al. Changes in membrane sphingolipid composition modulate dynamics and adhesion 709