HAL Id: hal-01168641
https://hal.archives-ouvertes.fr/hal-01168641
Submitted on 26 Jun 2015
HAL is a multi-disciplinary open access
archive for the deposit and dissemination of
sci-entific research documents, whether they are
pub-lished or not. The documents may come from
teaching and research institutions in France or
abroad, or from public or private research centers.
L’archive ouverte pluridisciplinaire HAL, est
destinée au dépôt et à la diffusion de documents
scientifiques de niveau recherche, publiés ou non,
émanant des établissements d’enseignement et de
recherche français ou étrangers, des laboratoires
publics ou privés.
A Comparison of Some Morphological Filters for
Improving OCR Performance
Laurent Mennillo, Jean Cousty, Laurent Najman
To cite this version:
Laurent Mennillo, Jean Cousty, Laurent Najman. A Comparison of Some Morphological Filters for
Improving OCR Performance. Mathematical Morphology and Its Applications to Signal and Image
Processing, Benediktsson, J.A.; Chanussot, J.; Najman, L.; Talbot, H., May 2015, Reykjavik, Iceland.
�10.1007/978-3-319-18720-4_12�. �hal-01168641�
A comparison of some morphological filters for
improving OCR performance
Laurent Mennillo1 and Jean Cousty2 and Laurent Najman2
1
Institut Pascal - UMR6602 - UBP/CNRS/IFMA
2
Universit´e Paris-Est, LIGM, ´Equipe A3SI, ESIEE, France
Abstract. Studying discrete space representations has recently lead to the development of novel morphological operators. To date, there has been no study evaluating the performances of those novel operators with respect to a specific application. This article compares the capability of several morphological operators, both old and new, to improve OCR per-formance when used as preprocessing filters. We design an experiment using the Tesseract OCR engine on binary images degraded with a realis-tic document-dedicated noise model. We assess the performances of some morphological filters acting in complex, graph and vertex spaces, includ-ing the area filters. This experiment reveals the good overall performance of complex and graph filters. MSE measures have also been performed to evaluate the denoising capability of these filters, which again confirms the performances of both complex and graph filtering on this aspect.
Keywords: Character recognition, Morphological filtering, Vertex, Graphs, Sim-plicial complexes
1
Introduction
Mathematical Morphology offers powerful tools that are widely recognized for their utilities for applicative purposes, in particular for filtering out many image defects. The old opening and closing based on structuring elements are still widely used and are described in most image analysis textbooks, although their combination at various scales, namely the granulometries [16], are not as well known. Their main implementation is on the usual 4, 6 or 8 connected grids. However, there exist several recent variations of these operators, depending on the space on which they are defined: we are especially interested in this paper in graphs, first by considering only the vertices (corresponding to the pixels) [18,7] and then, by considering edges (between pixels) and vertices [4,12]. The incentive for using more evolved space representations is to enhance the performance by getting “subpixelic” accuracy. Such an idea has been pushed a step further by considering simplicial complexes [6] (see [5] for a different point of view), a generalization of graphs. Although these new frameworks look promising from a theoretical point of view, to the best of our knowledge, to date, a systematic comparison of these old and novel operators for a dedicated application has not
yet been performed. The goal of this paper is to fill that gap, focusing on Optical Character Recognition, or OCR. As it is well known that connected filters, and especially area opening and closing [19] are well adapted to document image analysis, we include them in the present study.
The filtering step is generally just one step in the many ones composing the full application chain. Linear filters can be evaluated by their response to some model of noise. It is more difficult to apply the same evaluation process to the non-linear morphological filters. This is why we choose to assess the performance of an OCR against some model of noise/degradation dedicated to documents. In-deed, OCR is the process of converting a scanned document to machine-encoded text [15]. Such an operation is generally impacted by the quality of the origi-nal document and by the introduction of artefacts during the scanning process. Our performance evaluation is hence a measure of the ability of the aforemen-tioned morphological operators to improve OCR performance when used as a preprocessing step on degraded binary document images.
The paper is organized as follows. Section 2 presents the document degra-dation model used to alter the documents. Section 3 presents the compared morphological filters. Section 4 describes the thorough test protocols of this experiment. Results of the experiments are detailed in Section 5, before, in Sec-tion 6, discussing them and concluding the paper.
2
Document degradation model
The quality of the document images to be processed is a key point in any doc-ument recognition application. Indeed, the accuracy of the results often depend on this quality, and drastic failure can be expected if the quality is too low. For this reason, researchers in the domain have developed models of document image degradation. A state of the art of this research can be found in [3]. Document degradation models are designed to simulate local distortions that are introduced during the processes of document scanning, printing and photocopying. That in-cludes global (perspective and non-linear illumination) and local (speckle, blur, jitter and threshold) effects. Applications of these degradation models are nu-merous, see [8] for a survey. In this paper, we are using these models to carry out a systematic study of the performance of some morphological filters.
There exist two types of degradation models. As their name implies, physics-based ones [1,2] model the physics of the printing and imaging apparatus, with as much detail as possible. While they lead to accurate models, they might be unnecessary complicated for our purpose. On the other hand, statistics-based models [10] are much simpler, both from an implementation and usage point of views. We thus choose to use this class of models. Relying on statistics of image distributions, they propose a model of real document imaging defects. In the context of this experiment, some of these models have the ability to generate realistic degradations that are appropriate for an OCR performance evaluation. Besides, increasing levels of such degradations can also be produced by adjusting the models parameters, thus allowing for a proper level of comparison.
The binary document degradation model used in this experiment has been presented by Kanungo et al. in [9]. This local model, which only applies to binary images, accounts for two types of document degradation, which are pixel inversion and blurring.
Pixel inversion simulates image noise usually generated by light intensity variations, sensor sensitivity and image thresholding, while blurring simulates the point-spread function of the scanner optical system. The pixel inversion probability of a background (resp. foreground) pixel is modelled following an ex-ponential function of its distance from the nearest foreground (resp. background) pixel as: p(0|1, d, α0, α) = α0e−αd 2 + η, (1) p(1|0, d, β0, β) = β0e−βd 2 + η, (2)
where parameter d represents the 4-neighbour distance of each background (resp. foreground) pixel from its nearest foreground (resp. background) pixel, param-eter α0 (resp. β0) is the amount of generated noise on background (resp.
fore-ground) pixels, parameter α (resp. β) is the decay speed, relatively to distance d, of the background (resp. foreground) pixels flipping probability and parameter η represents the lowest flipping probability accounted for all the pixels.
Blurring in document images is due to the point-spread function of the scan-ner optical system. It is simulated here by a (simple) morphological closing operation using a disk structuring element of diameter k, that accounts for the correlation introduced by the point-spread function.
To summarize, this model with parameters
Θ = (η, α0, α, β0, β, k) (3)
is used to degrade binary documents by computing the distance map of each pixel, then independently flipping them following their respective probability and finally performing a morphological closing operation.
3
Morphological filtering
Morphological filters are commonly used to restore or improve the image qual-ity of digitally converted documents. Thus, they can increase OCR performance when used as a preprocessing step. This section roughly presents the four mor-phological filters that are assessed in our experiment on OCR preprocessing. Due to space restriction, the precise definitions of the operators is not made available in this article but can be found in [11].
3.1 Morphological operators on vertices with structuring element Morphological operators defined in vertex spaces act directly on subsets of image pixels through the use of structuring elements. For our experiments, structuring
elements corresponding to the 4- and 6-adjacency relations are considered in the 2D grid. In order to actually filter an image, alternate sequential filters are known to be efficient. An alternate sequential filter (ASF) of size λ, denoted by ASFλ, is a sequence of intermixed morphological openings and closings by
balls of increasing size, where the unit ball is the given structuring element and where the balls of larger size are obtained by up to λ dilations of the unit ball with the structuring element. An opening of a set X of white pixels by a ball of radius λ is the union of all balls of radius λ which are included in X. On the other hand, the closing of X is the dual of the opening of X, that is, roughly speaking, an opening of the black-pixels set. Thus, an ASF smooths the object and its complementary in a balanced way while preserving the “most significant balls” of both object and background. In practice, the openings and closings by a ball are obtained by composition of the erosion and the dilation where the given ball is considered as structuring element.
3.2 Morphological operators on graph spaces
Morphological operators on graph spaces have been studied notably in [12,4]. Acting as subpixelic filters with the introduction of edges between each connected vertices, they extend the operators defined in vertex spaces. In order to reach such subpixelic resolution, the basic dilations and erosions involved in the graph based ASFs act from sets of graph vertices to sets of graph edges, and, conversely, from sets of graph edges to sets of graph vertices. More precisely, the filter used in this experiment is the alternate sequential filter denoted by ASFλ/2 in
[4] (Definition 25), which is defined from a combination of these edge/vertex dilations and erosions. Filtering in graph spaces are performed in the graph corresponding the 4- and 6-adjacency relations, as for the operators defined in vertex spaces. It is worth noting that the openings/closings corresponding to the even values of the parameter λ are the same as the openings/closings by balls of size r = λ/2 involved in the operators on vertex spaces. Therefore, we can roughly say that the subpixelic resolution of graph operators is reached by considering the odd values of λ which in turn implies, two times more iterations of openings/closings for reaching the same filtering size.
3.3 Morphological operators on simplicial complexes
Morphological operators on simplicial complex spaces have been developed in [6] (see also [5]). Simplicial complexes extend graphs to higher dimensions in the sense that a graph is a 1-D simplicial complex made of points and edges consid-ered as 0-D and 1-D elements respectively. For instance, in 2-D, apart from points and edges, a simplicial complex also contains elementary triangles. Considering simplicial complex spaces allows for the design of dimensional morphological op-erators that can make the distinction between a 0-D element (a point), a 1-D element (an edge) and a 2-D element (a triangle). For application to image pro-cessing the well known 6-adjacency relation naturally leads to a 2-D simplicial
complex seen as the image domain (see [11]). The filters considered for our ex-periment with this 2-D simplicial complex space are the ones denoted by ASFλ/3
in [6] (Definition 9). Note that, in this case the subpixelic resolution is reached to the cost of a multiplication by three of the number of iterations compared to the ASFs in vertex spaces. Cubical complexes (2-D and 3-D basic elements are unit squares and cubes respectively) could be used in order to consider dimensional operators related to the 4-adjacency relation, but operators in this framework are yet to be defined and thus are not yet available for applications.
3.4 Morphological area opening and closing filters
Morphological area opening γλa and closing φaλ filters for binary and greyscale images have been presented by Vincent in [19]. These operators respectively remove light and dark regions of the image whose area is superior to a parameter λ ∈ N. The 4-adjacency relation was used for these filters in this experiment.
4
Test protocols
4.1 First test protocol
The Tesseract OCR engine, presented in [17], has been used to perform optical character recognition in this experiment. This powerful system has been evalu-ated by UNLV-ISRI in 1995 (refer to [13]) along with other commercial OCR engines and proved its top-tier performance at the time. Since then, it has been improved extensively by Google. In order to get OCR performance results from this engine on preprocessed documents, the test data and software tools from UNLV-ISRI presented in [14] have been used. More precisely, we have used on a random selection of 100 instances of 300 DPI binary document images. The test procedure is basically the iteration of degradation, filtering, OCR analysis and MSE measure of each document, repeated for each pair (d, λ) of degradation and filtering parameters. Note, however, that the used binary documents are scanned versions of real documents, meaning that they are imperfect and consequently contain noise. Degradation performed on these documents simply allows for a better comparison of the filters efficiency in critical conditions.
Degradation Degradation levels are specified with parameter d ∈ N, which acts on the binary document degradation model parameters Θ = (η, α0, α, β0, β, k)
as follows:
Θ(d) = (d ∗ 0.02, d ∗ 0.1, 1, d ∗ 0.1, 1, 0). (4)
Filtering The filters used in this experiment are the ASF filters defined in vertices, graphs and simplicial complexes, as well as a combination of area closing and area opening filters. The tests have been conducted on both regular and inverse versions of each document. Furthermore, ASF filters on graph and vertex
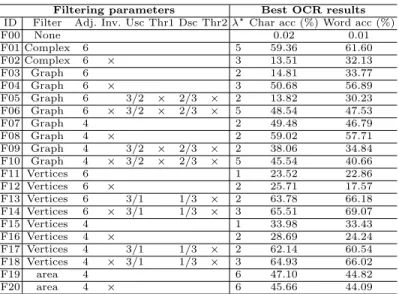
Filtering parameters Best OCR results ID Filter Adj. Inv. Usc Thr1 Dsc Thr2 λ?Char acc (%) Word acc (%)
F00 None 0.02 0.01 F01 Complex 6 5 59.36 61.60 F02 Complex 6 × 3 13.51 32.13 F03 Graph 6 2 14.81 33.77 F04 Graph 6 × 3 50.68 56.89 F05 Graph 6 3/2 × 2/3 × 2 13.82 30.23 F06 Graph 6 × 3/2 × 2/3 × 5 48.54 47.53 F07 Graph 4 2 49.48 46.79 F08 Graph 4 × 2 59.02 57.71 F09 Graph 4 3/2 × 2/3 × 2 38.06 34.84 F10 Graph 4 × 3/2 × 2/3 × 5 45.54 40.66 F11 Vertices 6 1 23.52 22.86 F12 Vertices 6 × 2 25.71 17.57 F13 Vertices 6 3/1 1/3 × 2 63.78 66.18 F14 Vertices 6 × 3/1 1/3 × 3 65.51 69.07 F15 Vertices 4 1 33.98 33.43 F16 Vertices 4 × 2 28.69 24.24 F17 Vertices 4 3/1 1/3 × 2 62.14 60.54 F18 Vertices 4 × 3/1 1/3 × 3 64.93 66.02 F19 area 4 6 47.10 44.82 F20 area 4 × 6 45.66 44.09
Table 1: Experimental set up and results (the degradation level is set up to d = 4). For each method, we only display the results obtained with the best filtering level, denoted by λ?. See text for details.
spaces have also been evaluated with document resolution scaling of respectively 3/1 and 3/2 (Usc), in order to preserve the same number of iterations between each filter. For instance, the results produced by the ASF3 on the vertex space
whose resolution was upscaled by 3 are comparable (with respect to the size of the removed noise) to the results of ASF3/3 where the simplicial complex
space is build from the image at the original resolution. Moreover, in both cases, the filters require the same number of iterations (i.e., each one of them needs three opening/closing iterations) for producing the result. In the case of binary document filtering, the corresponding upscaled documents were then binarized with a threshold value of 128 (Thr1), downscaled to their original size after filtering (Dsc) and binarized again with a threshold value of 128 (Thr2) in order to preserve the characters size for OCR processing, since the OCR engine that is used only accepts 300 DPI resolution. Filtering levels were specified for each morphological filter with parameter λ ∈ N. Detailed settings are described in table 1. One can note that binarization after upscaling (Thr1) is not performed in the case of vertex filtering. This is simply due to the fact that these documents are already in binary form after an exact upscaling of 3/1.
OCR analysis OCR analysis has been performed by the Tesseract OCR engine in its latest version (3.02). Character and word accuracy obtained from OCR processing of each document, as well as 95% confidence intervals of the obtained accuracy for each set of documents processed with every pair (d, λ) of
degrada-tion and filtering levels were then computed with the accuracy, wordacc, accci and wordaccci tools provided in [14].
MSE measure Mean squared error has been measured for each processed image I of dimensions w ∗ h with respect to its unprocessed counterpart O considered as the ground truth:
M SE = 1 w ∗ h h−1 X i=0 w−1 X j=0 [I(i, j) − O(i, j)]2 (5)
4.2 Second test protocol
Some observations can be stated about the first test protocol. One can note that MSE measures performed with binary documents that already contain noise as ground truths cannot be considered as a proper evaluation of the filters denois-ing ability. In addition, OCR analysis and MSE measures are also affected by document scaling, which produce a slight smoothing effect that can impact the results in this situation. This second test protocol has been performed to address these two problems. As the characters size is a crucial factor of OCR analysis, this second test protocol is only focused on MSE performance and has thus been performed on a noise-free binary document that was not downscaled at all. The test procedure is the iteration of degradation, filtering and MSE measure of each document, repeated for each pair (d, λ) of degradation and filtering parameters.
5
Results
5.1 First test protocol
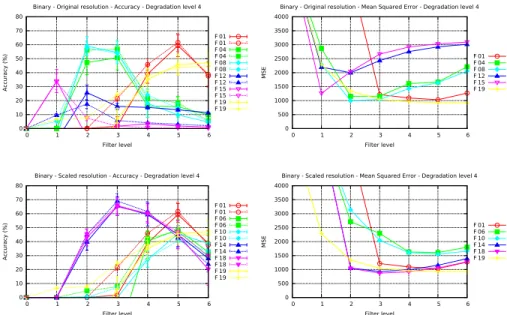
In this section, we present the results of the first test protocol in the most critical tested conditions (d = 4), to better compare the efficiency of each filtering setting. In figure 3, only the best performing setting is shown for each filter among regular and inverted document filtering and Table 1 presents the results obtained by each method for the parameter λ?that maximizes the quality of its
results.
As can be observed in figure 1, complex filtering on non inverted documents produces better accuracy results than any other filter at original resolution, with graph filtering closely behind.
One can note that 4-connected and 6-connected vertex filtering at scaled resolution on inverted documents outperforms complex filtering. However, it is at the expense of higher computational time and memory. Indeed, filtering at triple resolution requires to handle a number of pixels multiplied by 9 compared to the original resolution, whereas the size of a simplicial complex space is roughly 6 times the number of pixels. With our implementation, filtering in vertex spaces at triple resolution takes twice the time for filtering in the complex space.
0 10 20 30 40 50 60 70 80 0 1 2 3 4 5 6 Ac cur ac y (%) Filter level
Binary - Original resolution - Accuracy - Degradation level 4
F 01 F 01 F 04 F 04 F 08 F 08 F 12 F 12 F 15 F 15 F 19 F 19 0 500 1000 1500 2000 2500 3000 3500 4000 0 1 2 3 4 5 6 M S E Filter level
Binary - Original resolution - Mean Squared Error - Degradation level 4
F 01 F 04 F 08 F 12 F 15 F 19 0 10 20 30 40 50 60 70 80 0 1 2 3 4 5 6 Ac cur ac y (%) Filter level
Binary - Scaled resolution - Accuracy - Degradation level 4
F 01 F 01 F 06 F 06 F 10 F 10 F 14 F 14 F 18 F 18 F 19 F 19 0 500 1000 1500 2000 2500 3000 3500 4000 0 1 2 3 4 5 6 M S E Filter level
Binary - Scaled resolution - Mean Squared Error - Degradation level 4
F 01 F 06 F 10 F 14 F 18 F 19
Fig. 1: OCR accuracy and MSE measured in the first test after filtering of 100 binary documents at original and scaled resolution. Dashed lines represent word accuracy while solid lines represent character accuracy.
Finally, MSE results of this first test protocol clearly show that complex filtering, graph filtering and area filtering are very close at original resolution. On the other hand, vertex filtering performs best at scaled resolution while graph filtering at scaled resolution is significantly outperformed in this scenario.
A summary of OCR results obtained in this experiment is presented in Ta-ble 1 (along with the filtering parameters).
5.2 Second test protocol
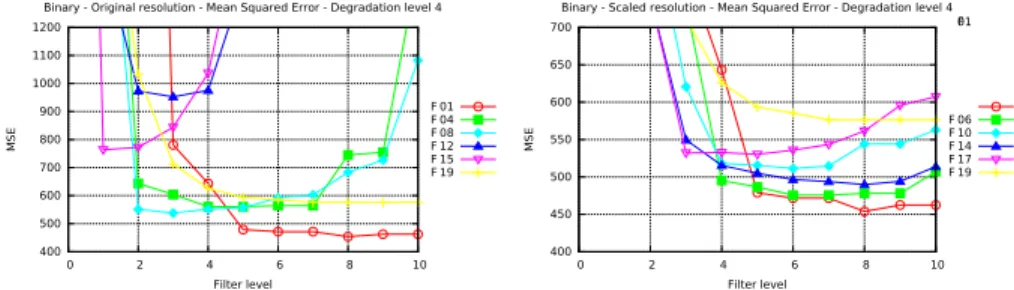
In this section we present the results of the second test protocol in the most critical tested conditions, to better compare the efficiency of each filtering setting. As shown in figure 2, where only the best performing setting is shown for each filter among regular and inverted document filtering, complex filtering of the binary image shown in figure 4b produces better MSE results than any other filter tested in these conditions.
Note also the good performance of graph filtering at original and scaled resolution in second test protocol, a result contrasting with the first test protocol, where graph filtering at scaled resolution was clearly outperformed.
Additionally, one can notice that 6-connected graph filtering performs better than 4-connected graph filtering at scaled resolution and that vertex filtering is outperformed at original resolution but close at scaled resolution.
400 500 600 700 800 900 1000 1100 1200 0 2 4 6 8 10 M S E Filter level
Binary - Original resolution - Mean Squared Error - Degradation level 4
F 01 F 04 F 08 F 12 F 15 F 19 400 450 500 550 600 650 700 0 2 4 6 8 10 M S E Filter level
Binary - Scaled resolution - Mean Squared Error - Degradation level 4 F01 F 06 F 10 F 14 F 17 F 19
Fig. 2: MSE measured in second test after filtering of the binary image shown in Fig. 4b.
6
Discussion and conclusion
It is clear following this experiment that morphological filtering can greatly im-prove OCR accuracy when used as a preprocessing step. The different results shown in this experiment are potent indicators of the efficiency of several mor-phological filters in the context of OCR. Indeed, preprocessing using such filters leads to an increase of respectively up to 65.49% and up to 69.06% in character and word accuracy on binary documents.
However, a few remarks can be stated to further explain the results obtained in this experiment. First, regarding the impact of inverted documents filtering, one can note that a general trend emerges from the results of the first test proto-col. Indeed, complex and area filters perform better on non inverted documents, while graph and vertex filters perform better on inverted documents.
Second, what can also be remarked is the impact of the thresholding op-erations done in the first test protocol on upscaled documents. It is clear, for instance, that graph filtering on such documents is severely impacted by these thresholds, as it is the only situation where this filter has a lower performance at a higher resolution.
Third, a notable improvement can be observed at scaled resolution on the lower performing filters such as vertex filters, but at the expense of computa-tional costs. Fourth, the difference of performance between 4-connectivity and 6-connectivity used for graph and vertex filtering seems to be thin. 4-6-connectivity may then be preferred for its easier implementation and lower computational cost.
Finally, as a concluding remark and following the previous statements, com-plex filtering and graph filtering both seem to be good choices when preprocess-ing binary documents for OCR.
This evaluation is dedicated to the performances of some morphological filters for OCR, and used a data-set of binary images. It remains to see if the conclusions of the study extend to other types of applications, including of course greyscale image applications. This will be the topic for further researches.
(a) Crop (b) d = 4 (c) F01 : 5 (d) F04 : 3
(e) F06 : 5 (f) F08 : 2 (g) F10 : 5 (h) F12 : 2
(i) F14 : 3 (j) F15 : 1 (k) F18 : 3 (l) F19 : 6
Fig. 3: First test protocol sample on binary documents. Original and degraded images with binary degradation model, along with best filtering results obtained on image 3b, under the form [ID : f ].
(a) Crop (b) d = 4 (c) F01 : 8 : 453 (d) F04 : 4 : 560
(e) F06 : 6 : 475 (f) F08 : 4 : 551 (g) F10 : 6 : 511 (h) F12 : 3 : 952
(i) F14 : 8 : 489 (j) F15 : 1 : 763 (k) F17 : 5 : 530 (l) F19 : 7 : 576
Fig. 4: Second test protocol sample on a binary document. Original and degraded images with binary degradation model, along with best filtering results obtained on image 4b (d = 4), under the form [ID : f : MSE].
References
[1] Baird, H.S.: Document image defect models. In: Structured Document Im-age Analysis, pp. 546–556. Springer (1992)
[2] Baird, H.S.: Calibration of document image defect models. In: Annual Symp. on Doc. Anal. and Inf. Retr. pp. 1–16 (1993)
[3] Baird, H.S.: The state of the art of document image degradation modelling. In: Digital Document Processing, pp. 261–279. Springer (2007)
[4] Cousty, J., Najman, L., Dias, F., Serra, J.: Morphological filtering on graphs. Computer Vision and Image Understanding 117(4), 370–385 (2013) [5] Dias, F., Cousty, J., Najman, L.: Dimensional operators for mathematical
morphology on simplicial complexes. PRL 47, 111––119 (2014)
[6] Dias, F., Cousty, J., Najman, L.: Some morphological operators on simplicial complex spaces. In: DGCI 2011. LNCS, vol. 6607, pp. 441–452 (2011) [7] Heijmans, H., Nacken, P., Toet, A., Vincent, L.: Graph morphology. Journal
of Visual Communication and Image Representation 3(1), 24–38 (1992) [8] Ho, T.K., Baird, H.S.: Evaluation of ocr accuracy using synthetic data. In:
Annual Symp. on Doc. Anal. and Inf. Retr. (1995)
[9] Kanungo, T., Haralick, R.M., Baird, H.S., Stuezle, W., Madigan, D.: A statistical, nonparametric methodology for document degradation model validation. PAMI 22(11), 1209–1223 (2000)
[10] Kanungo, T., Haralick, R.M., Phillips, I.: Global and local document degra-dation models. In: Document Analysis and Recognition, 1993., Proceedings of the Second International Conference on. pp. 730–734. IEEE (1993) [11] Mennillo, L., Cousty, J., Najman, L.: Morphological filters for ocr:
a performance comparison. Tech. rep. (dec 2012), http://hal.archives-ouvertes.fr/hal-00762631
[12] Meyer, F., Angulo, J.: Micro-viscous morphological operators. In: ISMM 2007. pp. 165–176. INPE (oct 2007)
[13] Nartker, T.A., Rice, S.V., Jenkins, F.R.: OCR accuracy: UNLV’s fourth annual test. Inform 9(7), 38–46 (jul 1995)
[14] Nartker, T.A., Rice, S.V., Lumos, S.E.: Software tools and test data for research and testing of page-reading ocr systems. In: Document Recognition and Retrieval XII. vol. 5676, pp. 37–47. SPIE (2005)
[15] Rice, S.V., Nagy, G., Nartker, T.A.: Optical character recognition: An il-lustrated guide to the frontier. Springer (1999)
[16] Serra, J.: Image analysis and mathematical morphology. Academic press (1982)
[17] Smith, R.: An overview of the tesseract ocr engine. In: ICDAR 2007. vol. 2, pp. 629–633 (2007)
[18] Vincent, L.: Graphs and mathematical morphology. Signal Processing 16(4), 365–388 (1989)
[19] Vincent, L.: Morphological area openings and closings for greyscale images. In: Shape in Picture. Nato ASI Series, vol. 126, pp. 197–208. Springer Berlin / Heidelberg, Driebergen, The Netherlands (sep 1992)