Publisher’s version / Version de l'éditeur: Brain Research, 1387, pp. 116-124, 2011-04-28
READ THESE TERMS AND CONDITIONS CAREFULLY BEFORE USING THIS WEBSITE.
https://nrc-publications.canada.ca/eng/copyright
Vous avez des questions? Nous pouvons vous aider. Pour communiquer directement avec un auteur, consultez la
première page de la revue dans laquelle son article a été publié afin de trouver ses coordonnées. Si vous n’arrivez pas à les repérer, communiquez avec nous à [email protected].
Questions? Contact the NRC Publications Archive team at
[email protected]. If you wish to email the authors directly, please see the first page of the publication for their contact information.
NRC Publications Archive
Archives des publications du CNRC
This publication could be one of several versions: author’s original, accepted manuscript or the publisher’s version. / La version de cette publication peut être l’une des suivantes : la version prépublication de l’auteur, la version acceptée du manuscrit ou la version de l’éditeur.
For the publisher’s version, please access the DOI link below./ Pour consulter la version de l’éditeur, utilisez le lien DOI ci-dessous.
https://doi.org/10.1016/j.brainres.2011.02.062
Access and use of this website and the material on it are subject to the Terms and Conditions set forth at Neural generators underlying concurrent sound segregation
Arnott, Stephen R.; Bardouille, Tim; Ross, Bernhard; Alain, Claude
https://publications-cnrc.canada.ca/fra/droits
L’accès à ce site Web et l’utilisation de son contenu sont assujettis aux conditions présentées dans le site LISEZ CES CONDITIONS ATTENTIVEMENT AVANT D’UTILISER CE SITE WEB.
NRC Publications Record / Notice d'Archives des publications de CNRC: https://nrc-publications.canada.ca/eng/view/object/?id=35df8cf6-4a4d-43fd-9010-3a13ae58ed1d https://publications-cnrc.canada.ca/fra/voir/objet/?id=35df8cf6-4a4d-43fd-9010-3a13ae58ed1d
Neural generators underlying concurrent sound segregation
Stephen R. Arnotta, Tim Bardouilleb, Bernhard Rossa, c, d, Claude Alaina, e
a Rotman Research Institute, Baycrest Centre, Toronto, Ontario, Canada M6A
2E1
b Institute for Biodiagnostics (Atlantic), Halifax, Nova Scotia, Canada B3H 3A7
c Institute of Medical Sciences, University of Toronto, Ontario, Canada M8V 2S4
d Department for Medical Biophysics, University of Toronto, Ontario, Canada
e Department of Psychology, University of Toronto, Ontario, Canada M8V 2S4 Accepted 19 February 2011. Available online 26 February 2011.
http://dx.doi.org/10.1016/j.brainres.2011.02.062, How to Cite or Link Using DOI Permissions & Reprints
Abstract
Although an object-based account of auditory attention has become an increasingly popular model for understanding how temporally overlapping sounds are segregated, relatively little is known about the cortical circuit that supports such ability. In the present study, we applied a beamformer spatial filter to magnetoencephalography (MEG) data recorded during an auditory paradigm that used inharmonicity to promote the formation of multiple auditory objects. Using this unconstrained, data-driven approach, the evoked field component linked with the perception of multiple auditory objects (i.e., the object-related negativity; ORNm), was found to be associated with bilateral auditory cortex sources that were distinct from those coinciding with the P1m, N1m, and P2m
responses elicited by sound onset. The right hemispheric ORNm source in particular was consistently positioned anterior to the other sources across two experiments. These findings are consistent with earlier proposals of multiple auditory object detection being associated with generators in the auditory cortex and further suggest that these neural populations are distinct from the long latency evoked responses reflecting the detection of sound onset.
Research highlights
The ORN is an evoked response that indexes perceptual parsing of concurrent sounds. Using ER-SAM source imaging, the ORN generator was localized. The ORN generator in the right hemisphere was spatially distinct (anterior) from the P1m, N1m, and P2m sources. Distinct neural events index sound onset and concurrent sound segregation.
Keywords
Concurrent sound segregation; ORN;
MEG;
Multiple auditory objects; Evoked field
1. Introduction
A major goal of hearing research is to understand how listeners extract a particular event or sequence amid the temporally-overlapping mixture of acoustic information arriving at their ears (i.e., auditory scene analysis; [Alain and Bernstein,
2008] and [Bregman, 1990]). In recent years, the matter of auditory scene analysis has taken on renewed interest with advances in neuroimaging technologies and the desire to understand aged and diseased auditory systems.
One account of auditory scene analysis that has grown in popularity over the past decade is the object-based model ( [Alain and Arnott, 2000], [Griffiths and Warren, 2004], [Scholl, 2001] and [Shinn-Cunningham, 2008]). Object-based models generally hold that auditory attention is governed by gestalt-like grouping principles (Koffka, 1935) that enable a listener to (actively or passively) group the auditory features that surround them. Although much of the object-based attention literature is largely theoretical, often drawing upon analogies from vision ( [Scholl, 2001] and [Shinn-Cunningham, 2008]), attempts have been made to find objective measures of auditory object formation (e.g., [Alain and Woods, 1997], [Alain et al., 2001], [Arnott and Alain, 2002] and [Bidet-Caulet et al., 2007]).
A stimulus that has been particularly amenable to auditory object research is the mistuned harmonic sound ( [Moore et al., 1985] and [Moore et al., 1986]). Typically, a complex tone comprised of integer harmonics of its fundamental frequency (f0) is
perceived as a single sound. However, when one of the lower harmonics is mistuned by a certain degree (usually 10–16% of its original frequency), listeners report hearing two sounds, a pure tone ―standing out‖ from a complex tone background. With increasing amounts of mistuning, listeners are more likely to report hearing two sounds. Because the phenomenon involves temporally synchronous sounds with very similar acoustical structures, the mistuned harmonic paradigm is well suited for studying the neural
correlates of concurrent sound segregation since the perception of multiple auditory objects can be dissociated from most sensory components simply by examining the difference between the tuned and mistuned stimuli. In fact, when the evoked responses associated with a non-mistuned harmonic complex are subtracted from those
associated with a mistuned one, a neural marker known as the object-related negativity (ORN) is revealed as a negative deflection 160–200 ms after sound onset (Alain et al., 2001). The ORN (and its magnetic counterpart, the ORNm) can be elicited whether listeners actively or passively listen to the sounds (Alain et al., 2001), is found in both young and old listeners (Alain and McDonald, 2007), and seems to be little affected by task difficulty or visual attention load (Dyson et al., 2005).
Attempts to localize the neural generator(s) of the ORN using equivalent current dipole (ECD) source have suggested that the ORN is generated in or near the auditory cortex (Alain et al., 2001), consistent with that area's role in auditory stream segregation and object perception ( [Alain et al., 2005], [Alain and Bernstein, 2008], [Bee and Klump, 2004], [Deike et al., 2010], [Itatani and Klump, 2009], [Micheyl et al., 2005],
[Schadwinkel and Gutschalk, 2010], [Snyder et al., 2006] and [Sussman et al., 1999]). Exactly what aspect of object perception the ORN is indexing remains an open
question, however a reasonable hypothesis is that it relates to the detection of the second object's presence (i.e., its onset). Given that the mistuned and tuned harmonics of the ORN stimulus onset at the same time, one might expect that the detection of the second ―object‖ would be somewhat delayed (relative to the detection of the overall stimulus) since a certain degree of sound sampling would be needed before the inharmonicity could be realized. It is well known in the field of event-related potentials that the onset of a sound is associated with an obligatory ―P1–N1–P2‖ long-latency response beginning around 50 ms after the sound has been perceived ( [Knight et al., 1980] and [Näätänen and Picton, 1987]). Accordingly, it is possible that the ORN component may itself be a manifestation of a temporally delayed P1, N1, and/or P2 in response to the detection of the mistuned harmonic ( [Alain et al., 2001], [Alain and McDonald, 2007] and [Alain et al., 2009]). The plausibility of this ―delayed onset‖ hypothesis is bolstered by dipole source localization studies that place the neural generators of these P1, N1 and P2 responses in regions (Hari et al., 1987) proximal to where the ORN is believed to occur (i.e., the Sylvian fissure). However, due to the limitations of ECD modeling, including its reliance on user imposed constraints (see [Fender, 1987] and [Scherg and Von Cramon, 1985]), it remains unclear whether ORN generators really are independent from N1 generators.
In the present study, we sought to localize generators of the ORN as well as the obligatory onset response by applying event-related synthetic aperture magnetometry (ER-SAM; [Cheyne et al., 2006] and [Robinson and Vrba, 2004]) to two mistuned harmonic MEG data sets ( [Alain and McDonald, 2007] and [Alain et al., 2009]). Unlike ECD source modeling, the ER-SAM algorithm does not require a priori assumptions about the number or location of sources (e.g., basing the ORN model on an N1 source). Rather, ER-SAM uses a minimum variance beamformer algorithm as a spatial filter to estimate neuronal activity from any location in the brain. Compared to other analytic techniques such as the minimum norm estimate [MNE] approach (Hämäläinen and
Ilmoniemi, 1994), beamforming employs two innovations that potentially result in increased spatial resolution. First, in addition to physical sensitivity properties of the sensor, signal properties (i.e., temporal covariances between magnetic field signals) are incorporated in the algorithm to increase the spatial resolution (Van Veen et al., 1997). Second, normalization based on a noise estimate results in almost uniform sensitivity across the brain volume, allowing for imaging of deep source activity (Vrba and Robinson, 2001).
Using information from all MEG sensors, the SAM approach involves dividing the entire brain volume into a grid of nodes, and then using the beamformer to enhance the signal at each node while also suppressing the signals from the other nodes (Huang et al., 2004). The time course of current source activity at each node/voxel of the brain is then estimated as a weighted linear combination of the magnetic field measured at all MEG sensor positions and plotted as a pseudo-Z value. Voxels showing maximum pseudo-Z values can then be selected as representatives of the center of gravity of neural
sources. Unlike in functional magnetic resonance imaging where the spatial distribution of activation maps reflects (in first order approximation) the extent of cortical activation, the spatial distribution of the ER-SAM MEG map relates more to limited spatial
resolution. To date, ER-SAM analyses have been successfully used to analyze mid and long latency auditory evoked transient responses ( [Du et al., 2011] and [Steinsträter et al., 2007]).
If the ORN is in fact indexing a delayed onset response, then one might expect ER-SAM analyses to provide ORNm source locations that are the same as those attained for P1m, N1m or P2m sources, but simply delayed in time. Alternatively, the ORN may be indexing something different from what those responses reflect, thereby activating different neural generators. For example, auditory object analysis is also known to invoke activity in brain regions anterior to the primary auditory cortex during sound categorization tasks ( [Alain et al., 2001], [Alain and Bernstein, 2008], [Arnott et al., 2004] and [Tian et al., 2001]), with more anterior regions being activated as sounds become increasingly complex (Scott, 2005). Similarly, brain regions posterior to the auditory cortex may play a role in auditory object formation by participating in complex acoustic analysis required for sound segmentation (Harms et al., 2005), disambiguating co-occurring environmental sounds that originate from the same region of space
(Zatorre et al., 2002), and/or localizing sounds (Arnott et al., 2004). Accordingly, the present study was carried out to compare ER-SAM source positions between the ORNm and the obligatory, long latency onset responses.
2. Results
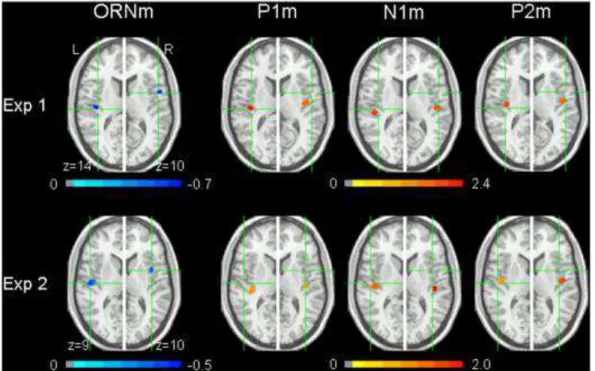
Source imaging of the P1m, N1m, P2m and ORNm components was successfully and easily identified in the source images of almost all participants (note: local maxima for a right P1m source could not be identified in one participant from Experiment 1, nor could a right ORNm component be identified in another). See Fig. 1 (top panel) and Table 1 for a summary of Experiment 1 results, and Fig. 1 (bottom panel) and Table 2 for a summary of Experiment 2. Although a 10 voxel (i.e., 50 mm) search radius was
permitted, in practice individual participant source locations did not vary from the grand mean location more than 4 voxels in either the x, y, or z direction for Experiment 1 (with overall standard deviations of 1.06, 1.16, and 1.04 voxels, respectively) and 6 voxels in Experiment 2 (with overall standard deviations of 1.15, 2.22, and 1.32, respectively).
Fig. 1. ER-SAM pseudo-Z value maps (group image results) overlaid on a brain image conforming to Talairach space. Results from Experiments 1 (N = 16) and 2 (N = 12) are displayed in the top and bottom rows, respectively. Green cross hairs highlight the location of the peak maxima for the ORNm sources (blue) derived from subtracting the ER-SAM results for the 0% mistuned stimulus from that of the 16% mistuned stimulus. For comparison, ER-SAM source maps at the time interval of the peak P1m, N1m and P2m responses (red) are plotted at the same ORNm axial (z-plane) level.
View high quality image (236K)
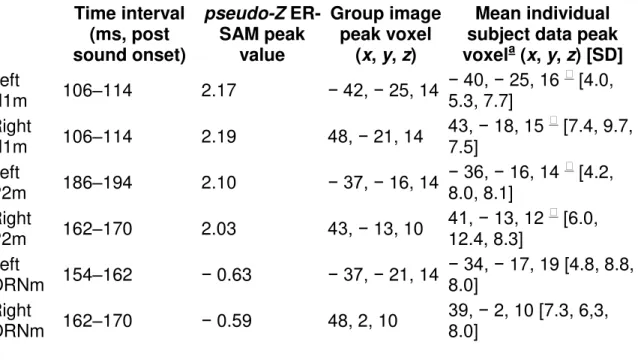
Table 1. Locations of peak ER-SAM maxima (group image data and mean individual subject data; image resolution 5 mm) for Experiment 1. Data are reported in Talairach space.
Time interval (ms, post sound onset) pseudo-Z ER-SAM peak value Group image peak voxel (x, y, z) Mean individual subject data peak voxela (x, y, z) [SD] Left P1m 66–74 2.37 − 37, − 21, 14 − 37, − 21, 18 [5.6, 6.3, 7.2] Right P1m 74–82 1.70 39, − 12, 10 41, − 16, 14 [7.5, 10.9, 9.4]
Time interval (ms, post sound onset) pseudo-Z ER-SAM peak value Group image peak voxel (x, y, z) Mean individual subject data peak voxela (x, y, z) [SD] Left N1m 106–114 2.17 − 42, − 25, 14 − 40, − 25, 16 [4.0, 5.3, 7.7] Right N1m 106–114 2.19 48, − 21, 14 43, − 18, 15 [7.4, 9.7, 7.5] Left P2m 186–194 2.10 − 37, − 16, 14 − 36, − 16, 14 [4.2, 8.0, 8.1] Right P2m 162–170 2.03 43, − 13, 10 41, − 13, 12 [6.0, 12.4, 8.3] Left ORNm 154–162 − 0.63 − 37, − 21, 14 − 34, − 17, 19 [4.8, 8.8, 8.0] Right ORNm 162–170 − 0.59 48, 2, 10 39, − 2, 10 [7.3, 6,3, 8.0] a
Rounded to nearest voxel; [SD] = standard deviation for the x, y, and z average.
Significantly different (p < 0.05) from the x, y, and/or z position (see Results for details) of the ORNm (mean individual peak voxel) in the corresponding
hemisphere.
Table 2. Locations of peak ER-SAM maxima (group image data and mean of individual subject data; image resolution 5 mm) for Experiment 2. Data are reported in Talairach space.
Time interval (ms, post sound onset) Pseudo-Z ER-SAM peak value Group image peak voxel (x, y, z) Mean individual subject data peak voxela (x, y, z) [SD] Left P1m 58–66 1.45 − 38, − 29, 10 − 43, − 16, 14 [6.4, 10.5, 9.8] Right P1m 74–82 1.22 43, − 21, 17 42, − 11, 17 [6.0, 12.9, 11.0] Left N1m 106–114 1.76 − 43, − 20, 12 − 43, − 18, 14 [4.3, 13.2, 6.4] Right N1m 106–114 2.15 43, − 12, 15 43, − 16, 14 [4.5, 10.1, 9.5] 1.87 43, − 24, 11 Left P2m 186–194 1.50 − 43, − 11, 10 − 41, − 14, 14 [8.7, 9.1, 6.9]
Time interval (ms, post sound onset) Pseudo-Z ER-SAM peak value Group image peak voxel (x, y, z) Mean individual subject data peak voxela (x, y, z) [SD] Right P2m 186–194 1.68 43, − 11, 10 39, − 8, 16 [7.8, 14.5, 9.2] Left ORNm 146–154 − 0.50 − 48, − 15, 9 − 38, − 18, 14 [7.2, 11.6, 8.0] Right ORNm 178–186 − 0.44 39, 3, 10 38, 2, 10 [8.7, 15.2, 9.5] a
Rounded to nearest voxel; [SD] = standard deviation for the x, y, and z average. Significantly different (p < 0.05) from the x, y, and/or z position (see Results
for details) of the ORNm (mean individual peak voxel) in the corresponding hemisphere.
2.1. Experiment 1
2.1.1. P1m
The ER-SAM analysis revealed P1m components occurring at 66–74 ms peak latency in the approximate location of the left auditory cortex (− 37, − 21, 14) and at 74–82 ms in the right auditory cortex (39, − 12, 10). The right source was positioned more
anteriorly than the left P1m source [t(14) = 2.36, p < 0.05; note that one participant was omitted from this analysis because the ER-SAM analysis did not generate a clear right P1m source].
2.1.2. N1m
The peak latencies of bilateral N1m sources were 106–114 ms. The N1m sources in the right hemisphere (48, − 21, 14) were located anterior to the left N1m source (− 42, − 25, 14; t(15) = 2.71, p < 0.05).
2.1.3. P2m
Similar ER-SAM analysis at the P2m interval indicated that the source peaked earlier in the right (162–170 ms) than in the left (186–194 ms) hemisphere. The P2m response showed no anterior–posterior difference across hemispheres [t(15) = 1.27, p > 0.05]. Relative to the N1m sources, both the right and left P2m sources were located approximately 8 mm anterior [t(15) = 3.58 and 4.69, respectively, both p < 0.01].
Bilateral ORNm sources were found with peak activity in the 135 to 175 ms latency interval previously reported for this data set (Alain et al., 2009). For the left source the peak amplitude during the 154–162 ms post-sound onset interval was significantly different from 0 across participants [t(15) = − 3.25, p < 0.01] and the location was approximately 5 mm medial and anterior to the left N1m source [t(15) = 6.01 and 3.80, p < 0.001 and 0.01, respectively] and 6 mm superior to the left P2m source
[t(15) = 1.93, p = 0.07].
In the right hemisphere the ORNm source amplitude was greatest at the 162–170 ms interval and was significantly different from 0 across all participants [t(15) = − 3.67, p < 0.01] with the source location being anterior to the P1m [t(13) = 3.75, p < 0.01], N1m [t(14) = 5.64, p < 0.001], and P2m sources [t(14) = 2.41, p < 0.05]. A hemispheric
asymmetry was found for the ORNm sources with the right source more anteriorly located than the left [t(14) = 5.85, p < 0.001].
2.2. Experiment 2
2.2.1. P1m
The P1m source peaked during the 58–66 ms interval (38, − 29, 10) in the right
hemisphere, while the left hemisphere P1m source was greatest during the 74–82 ms interval (− 43, − 21, 17). An anterior/posterior difference between right and left P1m y-coordinate locations was not statistically borne out at the individual subject level [t(11) = 1.62].
2.2.2. N1m
As in Experiment 1, the ER-SAM analysis revealed strongest pseudo-Z values occurring at the time point representing the 106–114 ms post sound onset time interval
corresponding roughly to the left (− 43 ,− 20, 12) and right auditory cortices (43, − 24, 11). No anterior/posterior difference was found between right and left N1m sources [t(11) = 0.455, p > 0.05].
2.2.3. P2m
The ER-SAM analysis of the P2m component revealed strongest ER-SAM values during the 186–194 ms interval in both the left (− 43, − 11, 10) and right (43, − 11, 10) auditory cortex. Relative to one another, the right P2m source was positioned more anteriorly than the left source [t(11) = 3.16, p < 0.01]. The right, but not the left, source was significantly more anterior to the corresponding N1m sources [t(11) = 3.65,
p < 0.01, and t(11) = 1.10, p > 0.05, respectively].
2.2.4. ORNm
As in Experiment 1, the difference between the 16% mistuning and 0% mistuning stimuli revealed multiple ER-SAM sources during the course of the ORN interval (i.e., 140–
180 m). The first source reached maximum strength at the 146–154 ms interval. A t-test confirmed that the group mean source activity was significantly different from 0
[t(11) = − 2.42, p < 0.05]. As in the first experiment, this generator was located
approximately 5 mm (i.e., one voxel) medial to the P1m [t(11) = 2.97, p < 0.05] and N1m [t(11) = 2.60, p < 0.05] sources in the left hemisphere.
As in Experiment 1, there was also evidence of a right hemispheric ORNm source (i.e., 39, 3, 10) positioned approximately 18 mm anterior to that of the one in the left
hemisphere [t(11) = 4.64, p < 0.001], and reaching maximum amplitude at a later time interval (178–186 ms). A t-test comparing its pseudo-Z value across participants was significantly different from 0 [t(11) = − 3.52, p < 0.01]. This ORNm-related source was also positioned more anteriorly than the right P1m [t(11) = 2.66, p < 0.05] and right N1m [t(11) = 4.57, p < 0.001], and was inferior to the right P2m source [t(11) = 3.65, p < 0.01] at the individual subject ER-SAM level.
Finally, we also observed a third ORNm source that was significantly different from 0 [t(11) = 2.51, p < 0.05]. Located in a region proximal to the previous ORNm, this positive source occurred relatively earlier (i.e., 138–146 ms) than the other two ORNm sources. Located at 34, − 2, 13, its position was medial to the aforementioned (negative) right ORNm source [t(11) = − 2.28, p < 0.05], as well as to the left P1m [t(11) = − 2.96, p < 0.05] and N1m [t(11) = − 4.05, p < 0.01]. It was also anterior to the P1m
[t(11) = 2.30, p < 0.05] and the N1m [t(11) = 4.84, p < 0.001], although this anterior difference did not reach significance compared to the P2m [t(11) = 1.67].
2.3. Post-hoc: Experiment 1 offset
To test the stimulus offset hypothesis of the ORNm source (see Discussion), the ER-SAM results at the time interval of 298–306 ms in Experiment 1 were examined. This corresponded to the time interval of the third ORNm response observed in Experiment 2, but shifted 160 ms to account for the fact that the stimulus was 200 ms in duration, rather than 40 ms as it had been in Experiment 2. At this time interval, we indeed discovered an ER-SAM positivity albeit in the vicinity of the right inferior frontal cortex (29, 12, 6). A t-test confirmed that the source was significantly different from 0 across all participants [t(15) = 2.77, p = 0.01]. An examination of each participant's ER-SAM results revealed a clear ORNm positive source in all but two participants. Comparing these data with the source locations of the other ERP components indicated that the ORNm source was anterior and inferior to the P1m [t(12) = 5.27 and 2.32, respectively], anterior, inferior and medial to the N1m [t(13) = 5.80, 2.30, and − 3.67, respectively] and anterior and medial to the P2m [t(13) = 3.96, and − 2.45, respectively] sources in the right hemisphere. There was also a trend for this ORNm source to be anterior to the other (negative) ORNm source in the right hemisphere [t(12) = 2.06, p = 0.06].
Moreover, when this ORNm source area was examined for ER-SAM source activity in Experiment 1, but at the time interval that demonstrated the ‗offset‘ activation during Experiment 2 (i.e., 138–146 ms), no significant activity was found [i.e.,
significant activity during Experiment 1's offset interval (i.e., 298–306 ms; pseudo-Z value = − 0.03). Taken together, both results support the hypothesis that these responses were related to stimulus duration.
3. Discussion
Using the spatial filtering technique of ER-SAM for imaging cortical source power ( [Cheyne et al., 2006] and [Robinson and Vrba, 2004]), the present study found that the neural activations associated with the automatic detection of two concurrent sounds based on inharmonicity (i.e., the neural generators of the ORNm component elicited during passive listening) were localized in bilateral regions of the temporal lobe. Importantly, across two independent experiments, the group image ER-SAM results (see Fig. 1) as well as the pairwise comparisons of the individual participants' ER-SAM results (Table 1 and Table 2) demonstrated that the ORNm source in the right
hemisphere was distinctly anterior to those sources associated with the P1m, N1m and P2m responses. This dissociation was less apparent in the left hemisphere and despite the group image results indicating a peak ORNm source that was slightly anterior to the P1m and N1m, and lateral to the P2m (Fig. 1), statistical comparison of individual participant ER-SAM results did not support this observation. Although precise anatomical locations of these sources could not be determined because anatomical MRIs of each subject had not been obtained, the relative location of the left ORNm source to that of the other left sources seems consistent with generators in the belt area of human auditory cortex (Kuriki et al., 2006). Furthermore, while the Talairach
coordinates of the right ORNm source suggest that the source was located in a more anterior part of the temporal lobe than in the left hemisphere (e.g., rostral superior temporal gyrus or insula), it is likely that this difference partly reflects natural structural asymmetries between the temporal lobes (cf., Eckert et al., 2008). Indeed, dipole fitting of auditory MEG components (e.g., N1m) typically shows a more anteriorly positioned source in the right relative to left hemisphere ( [Hoke et al., 1998] and [Pantev et al., 1998]).
The lack of difference in the mean ER-SAM peak voxel locations at the level of the individual participant (as compared to the group image results in Fig. 1) in part reflects issues pertaining to the selection of ER-SAM sources for individual subjects (e.g., reduced signal-to-noise ratios), especially with respect to the ORNm source which was arrived at by examining the difference between a mistuned and non-mistuned harmonic. Furthermore, because the mean average location statistics were based on the peak voxel coordinates of each participant's ER-SAM source, it is important to be aware that the statistical measures do not take into account the distribution or spatial extent of the source activity that the group image ER-SAM source results do. That said, the fact that a clear anterior–posterior difference for the ORNm source as compared to the sources of the other responses in the right hemisphere was found across two independent experiments makes this difference all the more convincing.
Before concluding that the ORNm sources (and by extension, sources related streaming based on frequency) are different from those responsible for the P1m, N1m and P2m
however, other possible explanations must be considered. One issue concerns the reliability of the ER-SAM technique. Aside from the fact that the ER-SAM approach to neural source localization has been successful in other studies ( [Cheyne et al., 2006], [Du et al., 2011], [Itier et al., 2006] and [Steinsträter et al., 2009]), our present ER-SAM results are in good agreement with the what is known about human auditory evoked responses. For example, our findings that right P1m, N1m, and P2m auditory sources were positioned anterior to those in the left hemisphere replicates the well known asymmetry reported across auditory source localization studies (see Pantev et al., 1998). Similarly, our ER-SAM findings that P2m sources were located anterior to N1m sources is also what one would predict based on the literature (Hari et al., 1987). It would be interesting for future studies to investigate ORN sources using other source localization tools that are also relatively independent of user-imposed constraints (e.g., MNE; Hämäläinen and Ilmoniemi, 1994).
It is also important to consider whether our ORNm findings could have been a
manifestation of the mistuning itself, given the tonotopic organization of auditory cortex ( [Pantev et al., 1988], [Tiitinen et al., 1993], [Verkindt et al., 1995], [Woods and Alain, 2009], [Woods et al., 2009] and [Yamamoto et al., 1992]) and that the current analyses of the onset evoked response components were based only on the non-mistuned stimuli. However, attributing the ORN–N1m source differences to a tonotopic shift in a delayed N1m response to the mistuned harmonic seems an unlikely explanation. First, the overall frequency range was the same among the tuned and mistuned stimuli, with the maximum mistuning change being very slight overall (i.e., it was always the fourth of ten harmonics that was manipulated, and that harmonic increase was only 16% of its original value). More importantly, the difference between the right N1m and right ORNm was a rather large (i.e., 15 mm) shift in the posterior to anterior direction, rather than a small lateral to medial shift as would be predicted from tonotopic N1m source studies ( [Fujioka et al., 2003], [Tiitinen et al., 1993] and [Yamamoto et al., 1992]). In fact, a comparison of the grand mean ER-SAM N1m source solutions between the mistuned and tuned stimuli (not reported here) indicated that the generators were either in the same location or, depending on the experiment and hemisphere, varied by one voxel in the x, y, or z dimension.
3.1. Functional implications
The ―P1-N1-P2 complex‖ is the collective term ascribed to the obligatory and exogenous long-latency evoked potentials elicited by the onset of a sound ( [Knight et al.,
1980] and [Näätänen and Picton, 1987]). The neuromagnetic equivalents to these electric potentials have been well documented, with the early positive (e.g., P40m) and
negative (i.e., N1m or N100m) deflections being explained by cortical activity within the
Sylvian fissure ( [Elberling et al., 1980], [Hari et al., 1980], [Hari et al., 1987] and [Pantev et al., 1996]). Despite their obligatory nature, the P1m and N1m responses are believed to index functionally distinct processes. For example, based on the observation that the N1m is elicited by both sound onset and offset, while the P1m is only elicited by sound onset, it has been speculated that the N1m is an index of any type of abrupt change in the auditory environment, while the P1m reflects preattentive arousal to any ―new‖
sound in the scene (Hari et al., 1987). Source localization studies bolster this hypothesis, further suggesting that distinct sources in auditory cortex (as well as beyond) underlie the P1m and N1m responses ( [Liegeois-Chauvel et al., 1991], [Pratt et al., 2005] and [Pratt et al., 2008]).
Relative to the P1m and N1m responses, the P2m response has received less attention. However, based on experimental, developmental as well as topographical findings, there is general agreement that the P2m component process is different from that of the N1m (for a review, see Crowley and Colrain, 2004). Consistent with our findings, the P2m has been described as anterior and perhaps medial to the N1m ( [Godey et al., 2001], [Hari et al., 1987], [Pantev et al., 1996] and [Rif et al., 1991]). Functionally, the P2m is an important physiological correlate of perceptual learning, memory and training ( [Budinger et al., 2006], [Reinke et al., 2003] and [Ross and Tremblay, 2009]). Because the P2m peaked at a later time than did the ORNm (see Table 1 and Table 2), it is difficult to argue that the ORNm reflects a delayed P2m response to the second auditory object.
Given that our ER-SAM findings, especially in the right hemisphere, are spatially distinct from neural populations associated with the P1m, N1m and P2m responses, it seems unlikely that the ORNm reflects mere sensory registration of a secondary sound object, at least not in any straightforward manner like the P1m-N1m response does. That said, the ORNm and the object processing that it seems to index do appear to possess a certain degree of automaticity, given that listeners in the current study as well as others (Alain et al., 2001) were not actively attending to the sounds when the ORNm were registered. Our sense is that the ORN response occupies an intermediate stage of auditory scene analysis, occurring after transient detection but before focused attention has been directed to that particular part of the auditory scene. In addition, the location of the ORNm generators in the current study are entirely in keeping with our model of auditory scene analysis, where the identification and categorization of objects is accomplished in auditory areas anterior to primary auditory cortex ( [Alain et al., 2001] and [Arnott et al., 2004]). Interestingly, the model also posits a role for posterior auditory cortex in the analysis of auditory spatial information. Given that the ORN is known to be elicited when co-occurring sounds are spatially separated ( [Du et al., 2011] and [McDonald and Alain, 2005]), an interesting question for future ER-SAM studies would be to determine whether the ORNm source(s) occupied brain regions similar to the ones found in these experiments or whether the sources would be located elsewhere, perhaps more posteriorly.
3.2. Object duration?
In Experiment 2 but not Experiment 1, a secondary ORNm source was also found in the right hemisphere. This source was located in the general area of the other ORNm source however it was positioned more medially, and occurred approximately 10 ms earlier. Because it has not been found in Experiment 1, we considered whether differences in experimental design could account for the discrepancy. Given that the main difference between these two experiments (apart from the participants) was that
stimulus duration in Experiment 1 had been 160 ms longer (i.e., 200 ms) than the 40 ms duration of Experiment 2, we wondered whether the ER-SAM positivity that we
witnessed at the 138–146 ms interval of Experiment 2, might be related to stimulus duration. As it turned out, post-hoc analyses of the ER-SAM results at this later time interval revealed a positive ORNm ER-SAM source activation somewhat proximal to the other right ORNm source, albeit not quite as anterior. This source was also distinct from the other onset responses, being anterior, inferior and medial to the P1m, N1m, and P2m sources. Unlike in Experiment 2, the source was not found to be significantly different from the other ORNm at the group level, although there was a trend for the source to be positioned more anteriorly. Whether these ORNm sources were actually indexing the offset of the secondary sound (i.e., the multiple object) remains a question for future research.
4. Experimental procedures
ER-SAM analysis was applied to two previous MEG data sets ( [Alain et al., 2009] and [Alain and McDonald, 2007]).
4.1. Participants
Sixteen adults were analyzed for Experiment 1 (mean age = 27.1 years, standard deviation (SD) = 3.6; 9 men, 1 left-handed) and 12 for Experiment 2 (mean
age = 26.4 years, SD = 2.6; 6 females, 1 left-handed). All participants had normal
hearing as measured with pure-tone thresholds and all were screened to exclude health problems and/or medications that might affect cognitive function and brain activity. Ethical approval and informed consent were obtained in accordance with the guidelines established by the University of Toronto and Baycrest Centre.
4.2. Stimuli and task
Experiment 1. The stimuli were complex sounds comprised of 10 tonal elements at
equal intensity. Stimuli were digitally generated using a System 3 Real-Time Processor from Tucker Davis Technology (Alachua, Florida) and presented binaurally via an OB 822 Clinical Audiometer using ER30 transducers (Etymotic Research, Elk Grove, USA) and reflectionless plastic tubes of 2.5 m length (n.b., although not factored into our reported results, it should be noted that this distance imposed a constant 10 ms ―transit time‖ delay in the signal). The stimuli were 200 ms in duration, including a 5 ms rise/fall time, and were presented at 75 dB SPL. Stimuli were either ―harmonic‖/―tuned‖ in that all of the harmonics were an integer multiple of a fundamental frequency (ƒ0) of 200 Hz,
or ―mistuned‖ in that the third harmonic was shifted upwards by 4% or 16% of its original value.
Auditory evoked fields (AEFs) in response to the tuned and mistuned stimuli were recorded in a passive listening session as participants watched a muted subtitled movie of their choice. The use of subtitled muted movies has been shown to effectively
Three blocks of trials were presented to participants. The inter-stimulus interval (ISI) varied randomly between 800 and 1200 ms in 100 ms steps for one block of trials to enable examination of the N1 and ORN components. Approximately 300 trials per stimulus type were recorded.
Experiment 2. Stimuli were identical to those in Experiment 1 with the exception that
stimulus duration was now 40 ms, including 2 ms rise/fall times, and were presented at 80 dB SPL. Approximately 280 trials per stimulus type were recorded from each
participant as they watched a subtitled muted movie of their choice.
More detailed descriptions of Experiment 1 and Experiment 2 can be found in Alain et al. (2009) and Alain and McDonald (2007), respectively.
4.3. Data acquisition and analysis
The MEG recordings took place in a magnetically shielded room using a helmet shaped 151-channel whole head neuro-magnetometer (VSM Medtech Inc., Coquitlam, Canada) with detection coils spaced 31 mm apart. Participants lay down throughout the
recording, in order to minimize movement. The neuromagnetic activity was recorded with sampling rates of 625 Hz (Experiment 1) and 2500 Hz (Experiment 2), and low-pass filtered at 200 Hz. Because reference landmarks differed between experiments, (i.e., landmarks were the preauricular points in Experiment 1 and ear canals in
Experiment 2), the resulting co-ordinate systems differed predominately in the anterior– posterior direction.
Volumetric maps of evoked source activity were estimated using event-related synthetic aperture magnetometry (ER-SAM; Cheyne et al., 2006). The SAM beamformer spatial filter was used to estimate source activity across the whole brain on a grid size of 5 mm spacing. Source activity was estimated as a pseudo-Z statistic for 1–30 Hz from
− 200 ms to 600 ms (Experiment 1) and − 200 ms to 500 ms (Experiment 2) with respect to stimulus onset (note: the longer epoch in Experiment 1 reflected the longer stimulus duration). All stimulus conditions were included in the calculation to ensure that between-condition comparisons were not confounded by differences in the spatial filter. A multiple sphere head model was used for the beamformer analysis in which single spheres were fit to a digitized head shape acquired using the Polhemus Fastrak system (Cochester, Vermont) for each MEG sensor. To reduce the number of time points, data were down-sampled by a factor of 5 (Experiment 1) or 20 (Experiment 2) to 125 Hz. Volumetric maps of evoked source strength over time were calculated separately for 0%, 4%, and 16% mistuning.
The pseudo-Z value for each virtual channel was used to create maps of cortical signal power for each participant. These individual functional maps were then overlaid on an anatomical brain image template (Holmes et al., 1998) after MEG-MRI co-registration to approximate anatomical landmarks and locations. In order to facilitate comparisons between the two experiments, the co-ordinate systems of both data sets were transformed into Talairach space (i.e., Talairach and Tournoux, 1988) using the
Analysis of Functional Imaging (AFNI, Cox, 1996) script called 3DtoTal. Note that such anatomical alignments were approximate (being based only on the left and right
landmarks) since structural MRI brain images were not available for the participants, however the main outcomes of our analysis (i.e., the relative distance between sources) were little affected by such co-registration uncertainties.
Selection of evoked field components and time points was guided by the auditory evoked field MEG data previously reported for these data sets ( [Alain and McDonald, 2007] and [Alain et al., 2009]). In those studies, the P1m, N1m and P2m evoked fields were found to peak around 66 ms, 115 ms, 180 ms (Experiment 1) and 53 ms, 109 ms, 197 ms (Experiment 2), respectively. In the current analysis, these auditory components were examined using only the responses to the harmonic stimulus, in order to avoid any ORNm-related influences. The ORNm component was evident during the 135–175 ms interval, peaking at 148 ms for Experiment 1, and during 140–180 ms (160 ms peak) for Experiment 2. ER-SAM source images for the ORNm were obtained by subtracting the ER-SAM results for the16% mistuned sounds from the ER-SAM results for the harmonic sounds.
To determine significant distances between sources, P1m, N1m, P2m and ORNm source locations were selected for each participant and pairwise comparisons of those x, y or z co-ordinates were carried out. Source selection occurred by examining each participant's ER-SAM map at the location and time point of the overall ER-SAM results and identifying the most prominent activation cluster occurring in that hemisphere. If no activation cluster could be located within a 50 mm radius of the x, y, and z co-ordinate of the grand mean, that participant's source was deemed indeterminable and was omitted from the individual subject analysis. Once a cluster was identified, it was examined over several time points in order to identify the voxel that had the largest pseudo-Z value. As a final note, owing to the fact that the ORNm component was derived from a difference computation (and could therefore be comprised of positive or negative pseudo-Z values), we also extracted each participant's ORNm pseudo-Z value at the location of the grand mean ORNm source and used two-tailed t-tests in order to determine whether those values were different from 0 (i.e., whether the pattern of activity observed in the overall grand mean was consistent across participants).
Acknowledgments
The authors wish to thank K. McDonald and J. Quan for data collection. This work was supported by a grant from the Canadian Institutes for Health Research to C. Alain.
References
1. C. Alain, D.L. Woods Attention modulates auditory pattern memory as indexed by event-related brain potentials. Psychophysiology, 34 (1997), pp. 534–546
2. C. Alain, S.R. Arnott Selectively attending to auditory objects. Front. Biosci., 5 (2000), pp. D202–D212
3. C. Alain, S.R. Arnott, T.W. Picton Bottom-up and top-down influences on auditory scene analysis: evidence from event-related brain potentials. J. Exp. Psychol. Hum. Percept. Perform., 27 (2001), pp. 1072–1089
4. C. Alain, K. Reinke, K.L. McDonald, W. Chau, F. Tam, A. Pacurar, S. Graham Left thalamo-cortical network implicated in successful speech separation and identification. Neuroimage, 26 (2005), pp. 592–599
5. C. Alain, K.L. McDonald Age-related differences in neuromagnetic brain activity underlying concurrent sound perception. J. Neurosci., 27 (2007), pp. 1308–1314 6. C. Alain, L.J. Bernstein From sounds to meaning: the role of attention during
auditory scene analysis. Curr. Opin. Otolaryngol. Head Neck Surg., 16 (2008), pp. 485–489
7. C. Alain, J. Quan, K. McDonald, P. van Roon Noise-induced increase in human auditory evoked neuromagnetic fields. Eur. J. Neurosci., 30 (2009), pp. 132–142 8. S.R. Arnott, C. Alain Effects of perceptual context on event-related brain
potentials during auditory spatial attention. Psychophysiology, 39 (2002), pp. 625–632
9. S.R. Arnott, M.A. Binns, C.L. Grady, C. Alain Assessing the auditory dual-pathway model in humans. Neuroimage, 22 (2004), pp. 401–408
10. M.A. Bee, G.M. Klump Primitive auditory stream segregation: a
neurophysiological study in the songbird forebrain. J. Neurophysiol., 92 (2004), pp. 1088–1104
11. Bidet-Caulet, C. Fischer, F. Bauchet, P.E. Aguera, O. Bertrand Neural substrate of concurrent sound perception: direct electrophysiological recordings from human auditory cortex. Front. Hum. Neuroscience, 1 (2007), p. 5
12. A.S. Bregman Auditory Scene Analysis: The Perceptual Organization of Sound. The MIT Press, London (1990)
13. E. Budinger, P. Heil, A. Hess, H. Scheich Multisensory processing via early cortical stages: connections of the primary auditory cortical field with other sensory systems. Neuroscience, 143 (2006), pp. 1065–1083
14. D. Cheyne, L. Bakhtazad, W. Gaetz Spatiotemporal mapping of cortical activity accompanying voluntary movements using an event-related beamforming approach. Hum. Brain Mapp., 27 (2006), pp. 213–229
15. R.W. Cox AFNI: software for analysis and visualization of functional magnetic resonance neuroimages. Comput. Biomed. Res., 29 (1996), pp. 162–173
16. K.E. Crowley, I.M. Colrain A review of the evidence for P2 being an independent component process: age, sleep and modality. Clin. Neurophysiol., 115 (2004), pp. 732–744
17. S. Deike, H. Scheich, A. Brechmann Active stream segregation specifically involves the left human auditory cortex. Hear. Res., 265 (2010), pp. 30–37
18. Y. Du, Y. He, B. Ross, T. Bardouille, C. Wu, L. Li, C. Alain Human auditory cortex activity shows additive effects of spectral and spatial cures during speech
segregation. Cerebral Cortex., 21 (2011), pp. 698–707
19. B.J. Dyson, C. Alain, Y. He Effects of visual attentional load on low-level auditory scene analysis. Cogn. Affect. Behav. Neurosci., 5 (2005), pp. 319–338
20. M.A. Eckert, L.J. Lombardino, A.R. Walczak, L. Bonihla, C.M. Leonard, J.R. Binder Manual and automated measures of superior temporal gyrus asymmetry: concordant structural predictors of verbal ability in children. Neuroimage, 41 (2008), pp. 813–822
21. C. Elberling, C. Bak, B. Kofoed, J. Lebech, K. Saermark Magnetic auditory responses from the human brain. A preliminary report. Scand. Audiol., 9 (1980), pp. 185–190
22. D. Fender Source localization of brain electrical activity. A.S. Gevins, A. Remond (Eds.), Methods of Analysis of Brain Electrical and Magnetic Signals, Elsevier, Amsterdam, the Netherlands (1987), pp. 355–403
23. T. Fujioka, B. Ross, H. Okamoto, Y. Takeshima, R. Kakigi, C. Pantev Tonotopic representation of missing fundamental complex sounds in the human auditory cortex. Eur. J. Neurosci., 18 (2003), pp. 432–440
24. B. Godey, D. Schwartz, J.B. de Graaf, P. Chauvel, C. Liegeois-Chauvel Neuromagnetic source localization of auditory evoked fields and intracerebral evoked potentials: a comparison of data in the same patients. Clin.
Neurophysiol., 112 (2001), pp. 1850–1859
25. T.D. Griffiths, J.D. Warren What is an auditory object?. Nat. Rev. Neurosci., 5 (2004), pp. 887–892
26. M.S. Hämäläinen, R.J. Ilmoniemi Interpreting magnetic fields of the brain: minimum norm estimates. Med. Biol. Eng. Comput., 32 (1994), pp. 35–42
27. R. Hari, K. Aittoniemi, M.L. Jarvinen, T. Katila, T. Varpula Auditory evoked
transient and sustained magnetic fields of the human brain. Localization of neural generators. Exp. Brain Res., 40 (1980), pp. 237–240
28. R. Hari, M. Pelizzone, J.P. Makela, J. Hallstrom, L. Leinonen, O.V. Lounasmaa Neuromagnetic responses of the human auditory cortex to on- and offsets of noise bursts. Audiology, 26 (1987), pp. 31–43
29. M.P. Harms, J.J. Guinan Jr., I.S. Sigalovsky, J.R. Melcher Short-term sound temporal envelope characteristics determine multisecond time patterns of activity in human auditory cortex as shown by fMRI. J. Neurophysiol., 93 (2005), pp. 210–222
30. E.S. Hoke, W. Muhlnickel, B. Ross, M. Hoke Tinnitus and event-related activity of the auditory cortex. Audiol. Neuro otology, 3 (1998), pp. 300–331
31. C.J. Holmes, R. Hoge, L. Collins, R. Woods, A.W. Toga, A.C. Evans
Enhancement of MR images using registration for signal averaging. J. Comput. Assist. Tomogr., 22 (1998), pp. 324–333
32. M.X. Huang, J.J. Shih, R.R. Lee, D.L. Harrington, R.J. Thoma, M.P. Weisend, F. Hanlon, K.M. Paulson, T. Li, K. Martin, G.A. Millers, J.M. Canive Commonalities and differences among vectorized beamformers in electromagnetic source imaging. Brain Topogr., 16 (2004), pp. 139–158
33. N. Itatani, G.M. Klump Auditory streaming of amplitude-modulated sounds in the songbird forebrain. J. Neurophysiol., 101 (2009), pp. 3212–3225
34. R.J. Itier, A.T. Herdman, N. George, D. Cheyne, M.J. Taylor Inversion and
contrast-reversal effects on face processing assessed by MEG. Brain Res., 1115 (2006), pp. 108–120
35. R.T. Knight, S.A. Hillyard, D.L. Woods, H.J. Neville The effects of frontal and temporal–parietal lesions on the auditory evoked potential in man.
Electroencephalogr. Clin. Neurophysiol., 50 (1980), pp. 112–124
36. K. Koffka Principles of Gestalt PsychologyHarcourt, Brace & World, New York (1935)
37. S. Kuriki, S. Kanda, Y. Hirata Effects of musical experience on different
components of MEG responses elicited by sequential piano-tones and chords. J. Neurosci., 26 (2006), pp. 4046–4053
38. C. Liegeois-Chauvel, A. Musolino, P. Chauvel Localization of the primary auditory area in man. Brain, 114 (Pt 1A) (1991), pp. 139–151
39. K.L. McDonald, C. Alain Contribution of harmonicity and location to auditory object formation in free field: evidence from event-related brain potentials. J. Acoust. Soc. Am., 118 (2005), pp. 1593–1604
40. C. Micheyl, B. Tian, R.P. Carlyon, J.P. Rauschecker Perceptual organization of tone sequences in the auditory cortex of awake macaques. Neuron, 48 (2005), pp. 139–148
41. B.C. Moore, R.W. Peters, B.R. Glasberg Thresholds for the detection of
inharmonicity in complex tones J. Acoust. Soc. Am., 77 (1985), pp. 1861–1867 42. B.C. Moore, B.R. Glasberg, R.W. Peters Thresholds for hearing mistuned partials
as separate tones in harmonic complexes. J. Acoust. Soc. Am., 80 (1986), pp. 479–483
43. R. Näätänen, T. Picton The N1 wave of the human electric and magnetic response to sound: a review and an analysis of the component structure. Psychophysiology, 24 (1987), pp. 375–425
44. C. Pantev, M. Hoke, K. Lehnertz, B. Lutkenhoner, G. Anogianakis, W. Wittkowski Tonotopic organization of the human auditory cortex revealed by transient
auditory evoked magnetic fields. Electroencephalogr. Clin. Neurophysiol., 69 (1988), pp. 160–170
45. C. Pantev, C. Eulitz, S. Hampson, B. Ross, L.E. Roberts The auditory evoked ―off‖ response: sources and comparison with the ―on‖ and the ―sustained‖ responses. Ear Hear., 17 (1996), pp. 255–265
46. C. Pantev, B. Ross, P. Berg, T. Elbert, B. Rockstroh Study of the human auditory cortices using a whole-head magnetometer: left vs. right hemisphere and
ipsilateral vs. contralateral stimulation. Audiol. Neuro otology, 3 (1998), pp. 183– 190
47. C.M. Pettigrew, B.E. Murdoch, C.W. Ponton, J. Kei, H.J. Chenery, P. Alku Subtitled videos and mismatch negativity (MMN) investigations of spoken word processing. J. Am. Acad. Audiol., 15 (2004), pp. 469–485
48. H. Pratt, N. Bleich, N. Mittelman The composite N1 component to gaps in noise. Clin. Neurophysiol., 116 (2005), pp. 2648–2663
49. H. Pratt, A. Starr, H.J. Michalewski, N. Bleich, N. Mittelman The auditory P50 component to onset and offset of sound. Clin. Neurophysiol., 119 (2008), pp. 376–387
50. K.S. Reinke, Y. He, C. Wang, C. Alain Perceptual learning modulates sensory evoked response during vowel segregation. Cogn. Brain Research, 17 (2003), pp. 781–791
51. J. Rif, R. Hari, M.S. Hamalainen, M. Sams Auditory attention affects two different areas in the human supratemporal cortex. Electroencephalogr. Clin.
Neurophysiol., 79 (1991), pp. 464–472
52. S.E. Robinson, J. Vrba Cleaning fetal MEG using a beamformer search for the optimal forward model. Neurol. Clin. Neurophysiol., 2004 (2004), p. 73
53. B. Ross, K. Tremblay Stimulus experience modifies auditory neuromagnetic responses in young and older listeners. Hear. Res., 248 (2009), pp. 48–59 54. S. Schadwinkel, A. Gutschalk Activity associated with stream segregation in
human auditory cortex is similar for spatial and pitch cues. Cereb. Cortex, 20 (2010), pp. 2863–2873
55. M. Scherg, D. Von Cramon Two bilateral sources of the late AEP as identified by a spatio-temporal dipole model. Electroencephalogr. Clin. Neurophysiol., 62 (1985), pp. 32–44
56. B.J. Scholl Objects and attention: the state of the art. Cognition, 80 (2001), pp. 1–46
57. S.K. Scott Auditory processing—speech, space and auditory objects. Curr. Opin. Neurobiol., 15 (2005), pp. 197–201
58. B.G. Shinn-Cunningham Object-based auditory and visual attention. Trends Cogn. Sci., 12 (2008), pp. 182–186
59. J.S. Snyder, C. Alain, T.W. Picton Effects of attention on neuroelectric correlates of auditory stream segregation. J. Cogn. Neurosci., 18 (2006), pp. 1–13
60. O. Steinsträter, A. Wollbrink, C. Pantev Localisation of auditory evoked
responses by SAM and event-related SAM. Int. Congr. Series, 1300 (2007), pp. 177–180
61. O. Steinsträter, I.K. Teismann, A. Wollbrink, S. Suntrup, K. Stoeckigt, R.
Dziewas, C. Pantev Local sphere-based co-registration for SAM group analysis in subjects without individual MRI. Exp. Brain Res., 193 (2009), pp. 387–396 62. E. Sussman, W. Ritter, H.G. Vaughan Jr. An investigation of the auditory
streaming effect using event-related brain potentials. Psychophysiology, 36 (1999), pp. 22–34
63. J. Talairach, P. Tournoux Co-Planar Stereotaxic Stlas of the Human Brain. Thieme Medical Publishers, New York (1988)
64. B. Tian, D. Reser, A. Durham, A. Kustov, J.P. Rauschecker Functional
specialization in rhesus monkey auditory cortex. Science, 292 (2001), pp. 290– 293
65. H. Tiitinen, K. Alho, M. Huotilainen, R.J. Ilmoniemi, J. Simola, R. Näätänen Tonotopic auditory cortex and the magnetoencephalographic (MEG) equivalent of the mismatch negativity. Psychophysiology, 30 (1993), pp. 537–540
66. B.D. Van Veen, W. van Drongelen, M. Yuchtman, A. Suzuki Localization of brain electrical activity via linearly constrained minimum variance spatial filtering. IEEE Trans. Biomed. Eng., 44 (1997), pp. 867–880
67. C. Verkindt, O. Bertrand, F. Perrin, J.F. Echallier, J. Pernier Tonotopic
organization of the human auditory cortex: N100 topography and multiple dipole model analysis. Electroencephalogr. Clin. Neurophysiol., 96 (1995), pp. 143–156 68. J. Vrba, S.E. Robinson Signal processing in magnetoencephalography. Methods,
25 (2001), pp. 249–271
69. D.L. Woods, C. Alain Functional imaging of human auditory cortex. Curr. Opin. Otolaryngol. Head Neck Surg., 17 (2009), pp. 407–411
70. D.L. Woods, G.C. Stecker, T. Rinne, T.J. Herron, A.D. Cate, E.W. Yund, I. Liao, X. Kang Functional maps of human auditory cortex: effects of acoustic features and attention. PLoS ONE, 4 (2009), p. e5183
71. T. Yamamoto, T. Uemura, R. Llinas Tonotopic organization of human auditory cortex revealed by multi-channel SQUID system. Acta Oto laryngologica, 112 (1992), pp. 201–204
72. R.J. Zatorre, M. Bouffard, P. Ahad, P. Belin Where is ―where‖ in the human auditory cortex? Nat. Neurosci., 5 (2002), pp. 905–909