HAL Id: tel-01721921
https://tel.archives-ouvertes.fr/tel-01721921
Submitted on 2 Mar 2018
HAL is a multi-disciplinary open access
archive for the deposit and dissemination of
sci-entific research documents, whether they are
pub-lished or not. The documents may come from
teaching and research institutions in France or
abroad, or from public or private research centers.
L’archive ouverte pluridisciplinaire HAL, est
destinée au dépôt et à la diffusion de documents
scientifiques de niveau recherche, publiés ou non,
émanant des établissements d’enseignement et de
recherche français ou étrangers, des laboratoires
publics ou privés.
repos par IRM : vers de nouveaux biomarqueurs de la
récupération fonctionnelle dans l’AVC
Maite Termenon Conde
To cite this version:
Maite Termenon Conde. Analyse par graphes de la connectivité fonctionnelle de repos par IRM :
vers de nouveaux biomarqueurs de la récupération fonctionnelle dans l’AVC. Médecine humaine et
pathologie. Université Grenoble Alpes, 2016. Français. �NNT : 2016GREAS023�. �tel-01721921�
DOCTEUR DE LA COMMUNAUTÉ UNIVERSITÉ
GRENOBLE ALPES
Spécialité : Biotechnologie, Instrumentation, Signal
Arrêté ministériel : 7 août 2006
Présentée par
Maite TERMENÓN CONDE
Thèse dirigée parChantal DELON-MARTIN
co-encadrée parAssia JAILLARD
etSophie ACHARD
préparée au sein duGrenoble Institut des Neurosciences (GIN)
dans L’École Doctorale Ingénierie pout la santé, la cognition, l’environnement (EDISCE)
Analyse par graphe de la
connec-tivité fonctionnelle de repos par
IRM. Vers de nouveaux
biomar-queurs de la récupération
fonc-tionnelle
Thèse soutenue publiquement le15 decembre 2016,
devant le jury composé de:
M. Michel DESVIGNES
Professeur, Université de Grenoble-Alpes, Président
M. Bertrand THIRION
Directeur de Recherche, INRIA, Rapporteur
Mme. Isabelle LOUBINOUX
Directrice de Recherche, Toulouse Neuroimaging Center (TONIC), IN-SERM, Rapporteur
Mme. Charlotte ROSSO
MD, Maître de conférence, Hôpital Pitié-Salpétrière (Paris), Examinateur
Mme. Chantal DELON-MARTIN
CR, INSERM - Grenoble Institut des Neurosciences, Directrice de thèse
Mme. Assia JAILLARD
MD, CHU Grenoble, Encadrante de thèse
Mme. Sophie ACHARD
First of all, I would like to express my gratitude to my thesis supervisors, Chantal DELON-MARTIN, for your dedication, your always useful explanations, your helpful advises and for being always available; Assia JAILLARD, your patience explaining several times the clinical point of view, for all your teas & coffees, your sense of humor, and your deep discussions; and Sophie ACHARD, for dedicating me so much of your precious time, for all your feedback, the skype meetings at night and your generosity. Thank you very much for giving me the opportunity of working with the three of you. It has been a great honor to be guided by you, I think we do a great women power team!
I am very grateful to the reviewers, Bertrand THIRION and Isabelle LOUBI-NOUX, brave enough to read this thesis till the end and for their insightful com-ments, as well as Michel DESVIGNES and Charlotte ROSSO for being part of my defense committee.
My greatest thanks goes to the Barbier team of the GIN, both present and past members. I apologize in advance to the people that I may forget. I feel so lucky of having spent these three important years of my life surrounded by people like you, always nice, always smiling, always eating croissants! Benjamin LEMASSON - I have no words, thank you for being such a great colleague, all your bureaucratic help, your jokes and your patience with this poor foreign student -, Emmanuel BARBIER - great team leader, always helpful, always available -, the team girls: Ligia SIMOES - all your visits and empathy -, Emmanuelle BELLOT all your funny moments , Lydiane HIRSCHLER -those amazing cakes and recipes -, Melina BOULDI - ma trés belle amie -, Ivy USZYNSKI - great sense of humor -, and Sandra MONTALESCOT - always sincere -, Marie Claude ZANONI - your paper work always with a laugh -, Claire ROME - your great advices as a recent mum -, Agnes JOB - always listening and motivating me -, Herve MATHIEU - for doing me speak in "French" all the time -, Jan WARNKING - your help with computers and our great wine taste sense -, Nora COLLOMB - always with a smile and nice words -, Michel DOJAT - for your scientific feedback - and Vasile STUPAR - all the coffee discussions. Big thanks as well to the remaining GIN colleagues!
Special thanks to the Région Rhône-Alpes, for giving me the opportunity (and the money) to do my PhD thesis.
I would also like to thank all my family and friends for their support and encouragement. To my parents, for supporting me whatever the decisions I take.
To Miguel, for introducing me to the realm of science and the world behind the wall. To Unai, you did everything more complicated but much more fun. To my brothers, for making me believe that I can achieve any goal, always revolution! To ’bola de paja’, these three years in Grenoble were much more interesting thanks to you all. To my ’cuadrilla’, unconditional support, always.
1 Introduction 1
I
State of the art
5
2 Stroke in the human brain 7
2.1 The human brain . . . 7
2.1.1 Functional cerebral organization . . . 10
2.2 Stroke . . . 13
2.2.1 Epidemiology . . . 13
2.2.2 Physiopathology of ischemic stroke . . . 14
2.2.3 Clinical manifestation . . . 16
2.2.3.1 The stroke syndrome . . . 16
2.2.3.2 Topographic hemispheric syndromes . . . 16
2.2.4 Treatment for stroke rehabilitation . . . 20
3 Magnetic resonance imaging (MRI) 25 3.1 Introduction . . . 25
3.2 Structural MRI . . . 26
3.3 Functional magnetic resonance imaging (fMRI) . . . 27
3.4 Resting state fMRI . . . 29
3.4.1 Acquisition of rs-fMRI data . . . 29
3.4.2 Preprocessing of structural and rs-fMRI data . . . 30
3.4.3 Time series extraction . . . 34
3.4.4 Advantages and limitations of rs-fMRI . . . 37
4 Brain connectivity 39 4.1 Introduction to brain connectivity . . . 39
4.2 Main brain functional connectivity techniques . . . 40
4.2.1 Seed-based connectivity . . . 40
4.2.2 ICA . . . 40
4.2.3 Graph analysis . . . 41
4.3 Brain functional connectivity in Stroke . . . 41 v
5 Brain functional graphs 55
5.1 Introduction to graph theory . . . 55
5.1.1 History of graphs . . . 55
5.1.2 Basic concepts . . . 55
5.1.3 Types of graphs . . . 56
5.1.4 Graphs basic representation . . . 58
5.1.5 Concept of cost . . . 58
5.2 Graphs of the brain . . . 58
5.3 Brain graphs computation . . . 59
5.4 Graph metrics . . . 61
5.4.1 Classical graph metrics . . . 62
5.4.2 Hub disruption index (κ) . . . 65
5.5 Test-retest analysis of brain graphs . . . 66
6 Aim of this thesis 69
II
Methodological contributions
71
7 Evaluating the effect of preprocessing 75 7.1 Introduction . . . 757.2 Preprocessing pipelines . . . 76
7.2.1 Pipeline 1: Non linear registration in MNI space . . . 76
7.2.2 Pipeline 2: Non linear + diffeomorphic transformation in MNI space . . . 77
7.2.3 Pipeline 3: Non linear transformation in subject’s space . 78 7.2.4 Pipeline 4: Non linear + diffeomorphic transformation in subject’s space . . . 79 7.3 Evaluation methods . . . 79 7.3.1 Database . . . 79 7.3.2 Graph metrics . . . 79 7.3.3 Statistical analysis . . . 80 7.4 Results . . . 80 7.5 Discussion . . . 82
8 Test-retest reliability of brain graphs 89 8.1 Introduction . . . 89
8.2 Methods . . . 90
8.2.1 Subjects and data acquisition . . . 90
8.2.2 Data preprocessing . . . 90
8.2.3 Time series extraction and analysis using wavelets . . . . 91
8.2.4 Graph computation . . . 91
8.2.5 Computation of graph metrics . . . 92
8.2.6 Test-retest reliability . . . 92
8.2.6.1 Intraclass correlation coefficient (ICC) . . . 94
8.3 Results . . . 96
8.3.1 Between, within variances, ICC and p-values for Eg with respect to cost . . . 96
8.3.2 Influence of the number of subjects . . . 98
8.3.3 Influence of the number of points in time . . . 99
8.3.4 Graph metrics reliability . . . 100
8.3.5 Regional metrics reliability . . . 101
8.4 Discussion . . . 104
8.4.1 Brain connectivity graphs to find potential biomarkers . . 106
8.4.2 Exploring reliability at the regional network level . . . 109
8.4.3 Methodological considerations . . . 110
8.4.4 Limitations . . . 111
9 Test-retest reliability of κ 117 9.1 Introduction . . . 117
9.2 Reliability of κ using HCP database . . . 118
9.3 Results . . . 119
9.4 Discussion . . . 123
10 Reliability of other factors 125 10.1 Introduction . . . 125
10.2 Methods . . . 126
10.3 Results . . . 129
10.3.1 Comparison between parcellation at the global level . . . 129
10.3.2 Comparison between parcellations at the regional level . . 131
10.3.3 Reliability using Fourier transformation . . . 134
10.3.4 Reliability using partial correlation . . . 134
10.4 Conclusion . . . 136
10.4.1 Influence of the parcellation scheme . . . 136
10.4.2 Influence of the filtering method . . . 138
10.4.3 Influence of the connectivity measure . . . 138
III
Role of the contralesional hemisphere in stroke
us-ing graphs
139
11 Stroke database and methods 145 11.1 The ISIS-HERMES study . . . 14511.2 Data acquisition and preprocessing . . . 149
11.3 Time series extraction and graph computation . . . 150
11.4 Methods applied in stroke experiments . . . 152
11.4.1 Experiment 1 . . . 152
11.4.2 Experiment 2 . . . 153
12 Exp 1: κ in contralesional hemisphere 155
12.1 Results . . . 155
12.1.1 Hub disruption index κ in patients . . . 155
12.1.2 Robustness of the patients’ results . . . 160
12.2 Discussion . . . 165
13 Exp 2: κ predicting clinical outcome 167 13.1 Results . . . 167
13.1.1 Correlation . . . 168
13.1.2 Model 1: Regression of RBANs 6 months using all covari-ates including RBANS at 1 month . . . 168
13.1.3 Model 2: Regression of RBANs 6 months using all covari-ates but RBANS at 1 month . . . 170
13.2 Discussion . . . 171
14 Conclusions and perspectives 173 A Additional explanations on TRT 177 A.1 Modified version of classical AAL parcellation scheme . . . 177
A.2 TR, scan duration and frequency band . . . 177
A.3 ICC computation . . . 177
B Posters 179
2.1 Major cerebral lobes . . . 8
2.2 Structure of a neuron . . . 8
2.3 Mid-line incision of the human brain . . . 9
2.4 Functional cerebral organization . . . 11
2.5 Sensory homunculus . . . 12
2.6 Motor areas . . . 13
2.7 Stroke mortality worldwide . . . 14
2.8 Evolution of penumbra in few hours . . . 15
2.9 Time course of stroke and associated therapeutic time-windows . 17 2.10 Cerebral Arterial Territories . . . 18
2.11 Stem cells therapy . . . 22
3.1 MRI scanner . . . 26
3.2 Main structural MRI modalities . . . 27
3.3 Illustration of the haemodynamic response. . . 28
3.4 BOLD time course in fMRI . . . 29
3.5 BOLD time course during rs-fMRI . . . 30
3.6 Brain tissue segmentation . . . 31
3.7 Standard preprocessing pipeline . . . 34
4.1 Example of seed based connectivity analysis in stroke . . . 41
4.2 Example of ICA based connectivity analysis in stroke . . . 42
4.3 Example of graph based connectivity analysis in stroke . . . 43
5.1 Map of Königsberg in Euler’s time . . . 56
5.2 Graph of the Euler’s problem . . . 56
5.3 Example of a simple graph . . . 57
5.4 Types of graph: directed and weighted graphs . . . 57
5.5 Example of an adjacency matrix . . . 58
5.6 Different cost of a graph in the brain . . . 59
5.7 Small world property . . . 60
5.8 Brain graphs computation pipeline . . . 62
5.9 Graphical example of the node degree, clustering coefficient and minimum path length . . . 63
5.10 Modularity and hubs in a simple graph . . . 65
5.11 Estimation of κ . . . 67
7.1 Common steps in the preprocessing of rs-fMRI . . . 77
7.2 Non linear registration pipeline in MNI space . . . 77
7.3 Diffeomorphic transformation pipeline in MNI space . . . 78
7.4 Non linear registration pipeline in subject space . . . 78
7.5 Diffeomorphic transformation pipeline in subject space . . . 79
7.6 Mean global measures per subject for each preprocessing pipelines 81 7.7 Mean and standard deviation of egi . . . 82
7.8 Correlation between different pipelines for egi . . . 83
7.9 3D representation of the global measures for each subject . . . . 84
7.10 Complete oultine of pipeline 2 . . . 85
7.11 Diagram 1 of pipeline 2 . . . 86
7.12 Diagram 2 of pipeline 2 . . . 87
7.13 Diagram 3 of pipeline 2 . . . 88
8.1 Reliability measures using ICC for Egand AAL89 as parcellation scheme . . . 97
8.2 Reliability results in terms of number of subjects and scan duration 98 8.3 Trade-off between number of subject and number of points in time100 8.4 Reliability evaluation of different metrics using AAL89 as parcel-lation scheme . . . 101
8.5 Correlation of reliability of graph metrics . . . 102
8.6 Reliability at the regional level using egi and AAL89 parcellation scheme . . . 102
8.7 Brain maps of reliable regions for AAL89 parcellation scheme . . 103
8.8 Reliability of brain regions in terms of cost using AAL89 as par-cellation scheme . . . 104
9.1 Reliability results of κD in terms of number of subjects . . . 120
9.2 Reliability results for κEg in terms of number of subjects . . . 121
9.3 Reliability results for Eg in terms of number of subjects . . . 122
9.4 Boxplots of the differences between left and right hemispheres of κD . . . 123
10.1 Example of AAL parcellation scheme . . . 127
10.2 Example of Craddock parcellation scheme . . . 128
10.3 Comparison between the reliability of 40 and 100 subjects using the AAL459 parcellation scheme . . . 129
10.4 ICCs and their p-values for different parcellation schemes and different number of subjects . . . 130
10.5 Percentage of significant number of regions according to the num-ber of subjects and the parcellation scheme. . . 131
10.6 Comparison between the significant regions of the brain for 20 and 30 subjects . . . 132
10.7 Comparison between the significant regions of the brain for 40
and 100 subjects . . . 133
10.8 Comparison of the reliability of Eg between Fourier transform and wavelets . . . 135
10.9 Comparison of the reliability of Eg using adaptive lasso partial correlation . . . 136
11.1 HERMES longitudinal study . . . 146
11.2 Flowchart illustrating the selection of patients . . . 147
11.3 GM segmentation with brain lesions . . . 150
11.4 Preprocessing pipeline with lesion . . . 151
12.1 Group differences between mean intra-hemispheric connectivity in controls and contralesional hemispheric connectivity in stroke patients . . . 156
12.2 κDhub disruption of functional networks in stroke patients con-tralesional hemisphere . . . 158
12.3 κEg hub disruption of functional networks in stroke patients con-tralesional hemisphere . . . 159
12.4 κEl hub disruption of functional networks in stroke patients con-tralesional hemisphere . . . 161
12.5 κB hub disruption of functional networks in stroke patients con-tralesional hemisphere . . . 162
12.6 κC hub disruption of functional networks in stroke patients con-tralesional hemisphere . . . 163
12.7 Analysis of the robustness of the significant differences between controls and stroke patients . . . 164
13.1 Adjusted regression model for model 1 . . . 169
4.1 Stroke human brain functional connectivity approaches using
rs-fMRI . . . 52
4.2 Stroke human brain functional graph based approaches using rs-fMRI . . . 53
5.1 Test-retest reliability studies using graphs with rs-fMRI. AAL: Automated anatomical labeling; Eg: Global efficiency; func ROIs: functional regions of interest; HO: Harvard-Oxford; ICC: Intra-class correlation coefficient; ki: node degree; tp: time points. . . 68
7.1 Correlation values between the different preprocessing pipelines . 83 8.1 Description of the network metrics . . . 93
8.2 Regions with strong global efficiency (egi) for AAL89 parcellation scheme . . . 105
8.3 Regional network parameters and their p-values at 20% cost, con-sidering 40 subjects at 1200 tp . . . 113
8.4 P -values for each brain region of the AAL89 for 20, 30, 40 and 100 subjects . . . 114
8.5 P -values of each brain region (AAL89) for 100 subjects using different graph metrics . . . 115
11.1 Demographics of the stroke group . . . 148
11.2 Demographics of the stroke group . . . 149
11.3 Variables of the multiple regression model . . . 154
13.1 Pearson correlation between κ values and clinical scores . . . 168
13.2 Predictors of model 1 . . . 169
13.3 Bootstrap of model 1 . . . 170
13.4 Predictors of model 2 . . . 170
13.5 Bootstrap of model 2 . . . 171
A.1 Reliability for two different datasets using two different TR . . . 178
In the recent years, there has been a great amount of work developing new in-vestigation methods of the brain connectivity based on fMRI. The exploration of brain networks with resting-state fMRI (rs-fMRI) combined with graph theo-retical approaches has become popular, with the perspective of finding network graph metrics as biomarkers in the context of clinical studies. A preliminary requirement for such findings is to assess the reliability of the graph based con-nectivity metrics in healthy subjects. In this thesis, taking advantage of a large test-retest database provided by the Human Connectome Project, we quantified the reliability of the graph metrics computed both at global and regional level depending, at optimal cost, on two key parameters, the sample size (number of subjects) and the number of time points (or scan duration). We also explored how other factors, such as the parcellation scheme, the connectivity measure or the filtering method may influence this reliability. In a clinical context, stroke is one of the leading causes of mortality and disability worldwide. Resulting in focal structural damage, it induces changes in brain function at both local and global levels. Following stroke, cerebral networks present structural and func-tional reorganization to compensate for the funcfunc-tional impairment provoked by the lesion itself and its remote effects. In this thesis, we studied the role of the contralesional hemisphere in the reorganization of brain function of stroke patients using resting state fMRI and graph theory. We explored this reorga-nization using the ’hub disruption index’ (κ), a global index sensitive to the reorganization of nodes within the graph. We explored the relation between κ and behavioral clinical scores to assess whether κ could be used as a surrogate biomarker of stroke recovery.
Keywords: rs-fMRI, graph theory, stroke, hub disruption index (κ),
relia-bility, contralesional, biomarkers, recovery, Human Connectome Project.
Cette dernière décennie, un important travail de développement méthodologique a été mené pour explorer la connectivité fonctionnelle de repos par IRM. L’explo-ration des réseaux cérébraux par IRM fonctionnelle de repos combinée à une approche de graphes est devenue populaire dans la perspective de trouver des métriques de graphes qui puissent être des biomarqueurs dans différentes sit-uations pathologiques. Un prérequis pour pouvoir identifier ces métriques est de s’assurer de leur fiabilité chez des sujets sains. Dans cette thèse, partant de la grande base de données de repos avec 2 examens du Projet de Connectome Humain, nous avons quantifié la fiabilité des métriques globales et régionales de graphe, pour un coût optimal, en fonction de deux paramètres clé : la taille de l’échantillon (nombre de sujets) et le nombre de points temporels (durée d’acquisition). Nous avons également exploré d’autres facteurs, comme la par-cellisation, la mesure de connectivité et la méthode de filtrage fréquentielle, sus-ceptibles d’impacter cette fiabilité. L’accident vasculaire cérébral (AVC) est une des causes principales de mortalité et d’handicap dans le monde. En créant des lésions focalisées, il entraine des modifications des fonctions cérébrales à la fois au niveau local mais aussi global. Après un AVC, les réseaux cérébraux présen-tent des réorganisations structurelles et fonctionnelles pour compenser les dé-ficits fonctionnels provoqués par la lésion comme par ses effets à distance. Dans cette thèse, nous avons étudié le rôle de l’hémisphère contralésionel dans la réor-ganisation des fonctions cérébrales de patients ayant subi un AVC en utilisant l’analyse des données d’IRMf de repos par la théorie des graphes. Nous avons exploré cette réorganisation en utilisant un index global sensible à la réorgani-sation des noeuds d’un graphe, baptisé ’index de perturbation des noeuds’ (κ). Nous avons enfin exploré la relation entre cet index et les scores cliniques pour évaluer son intérêt comme candidat-biomarqueur dans la récupération aprés un AVC.
Mots clés : IRM fonctionnelle de repos, théorie des graphes, AVC, index de
perturbation des noeuds (κ), fiabilité, contralesionel, biomarqueurs, récupéra-tion, Projet du Connectome Humain.
Introduction
Grenoble is a city known for advanced technologies where 1 person over 5 is employed in research and development. Clinicians are working since decades in close collaboration with scientific teams involved in advanced methods of image and signal processing and assissted guided surgery, among others. In neurology, long term research collaborations mainly in the fields of Parkinson disease, epilepsy, traumatic brain injury and stroke have been established, and the creation of the Grenoble Institut des Neuroscience (GIN) reinforced these collaborations. Neuroimaging has become an essential tool to investigate these pathologies using advanced mathematical methods.
Taking advantage of existing close collaborations with scientist from multi-ple disciplines, this thesis emerges in a multidisciplinary context, creating syn-ergy from the fields of neuroimaging, signal processing, advanced mathematical methods and new stroke treatment based on stem cells therapy.
Stroke represents the ensemble of lesions of the central nervous system caused by an injury of the brain vascular system. It is one of the leading causes of mortality and disability worldwide, and the incidence of stroke is expected to increase due to aging of the population and the sharp rise in diabetes and obesity. These facts motivate the increasing investment in research studies with the aim of finding effective treatments to improve the outcome of stroke victims. One of these treatments is the use of stem cells therapy.
Magnetic resonance imaging (MRI) is a non-invasive technique that presents the opportunity to study the internal structure of the brain (structural MRI) and also, the activity of the brain when we perform particular tasks (task based functional MRI) or while we rest (resting state functional MRI). This brain activity relies on brain regions that are connected among them and there are different ways to study this connectivity.
One way is based on graph theory. It is a method that applies in multi-ple fields, to explain interactions between different objects (or individuals). It can be used to represent a roadmap, a social network, a molecule or a galaxy distribution, for example.
In this work, we used resting state functional MRI to study the brain connec-1
tivity along the recovery of stroke victims applying an advanced mathematical model based on graph theory.
My background is in industrial electronics and automation engineering, with a postgrade in biomedical engineering and a master in computer science and artificial intelligence. This thesis has been a challenge for me due to the lack of knowledge in the field of clinical science, the advanced functional magnetic resonance imaging techniques and some of the mathematical methods applied that were unkwon for me.
This thesis is thus divided in three parts. First, I start with the state of the art presenting stroke (Chapter 2), functional magnetic resonance imaging methods (Chapter 3), the analysis of how the brain is connected (Chapter 4) and advanced mathematical methods to study this connectivity (Chapter 5). This first part is finished with the aim and motivation of this work (Chater 6). The second part of this thesis describes the methodological contributions achieved (Chapters 7 to 10), mainly focusing on the reliability of graph methods applied to study brain connectivity. In the last part of this thesis, I explain the methods (Chapter 11) and the results (Chapters 12 and 13) obtained applying graphs to study the recovery of stroke patients are presented. In a final chapter, Chapter 14, a general conclusions and future perspectives are discussed.
Contributions
Two publications are the main contributions of this thesis. The first one is the analysis of the reliability of the method used in this thesis, graph based analysis of brain functional connectivity. Part of this work (Chapters 8) was published in June 2016 in the journal Neuroimage and presented in the fifth bienal resting state conference in Vienna. The second main contribution (Chapters 9 and 12) was to study the reorganization of the contralesional hemisphere of stroke patients, using the same method validated previously. This work was published in August 2016 in Frontiers in Computational Neuroscience and also presented in the fifth bienal resting state conference in Vienna.
The posters presented during this thesis in different conferences are listed in the Appendix B.
Journals:
M. Termenon, A. Jaillard, C. Delon-Martin, S. Achard, Reliability of graph analysis of resting state fMRI using test-retest dataset from the
Hu-man Connectome Project, NeuroImage, Available online 6 June 2016, ISSN
1053-8119, http://dx.doi.org/10.1016/j.neuroimage.2016.05.062 M. Termenon, S. Achard, A. Jaillard, C. Delon-Martin, The "Hub Dis-ruption Index", a Reliable Index Sensitive to the Brain Networks
Reorganization. A Study of the Contralesional Hemisphere in Stroke,
Frontiers in Computational Neuroscience, 2016, 10:84, http://dx.doi.org/10. 3389/fncom.2016.00084
Oral presentations 2016:
Reliability of graph analysis of resting state fMRI using test-retest
dataset from the Human Connectome Project, Atlas workshop,
Greno-ble, May 2016. 2015:
Brain graph connectivity computation: Theory and training. Second
Brain connectivity course, Grenoble, September 2015.
Spécialisation hémisphérique chez les hommes et les femmes : Représentation de la connectivité cérébrale par la méthode des graphes
en IRM fonctionnelle de repos., Société Française de Résonance Magnétique
en Biologie et Médecine (SFRMBM), Grenoble, 2015. Posters
2016:
M. Termenon, A. Jaillard, C. Delon-Martin, S. Achard, Reliability of graph analysis of rs-fMRI using test-retest dataset from the Human
Con-nectome Project, Fifth Biennial Conference on Resting State / Brain
Con-nectivity.
M. Termenon, S. Achard, A. Jaillard, C. Delon-Martin, Hub disruption index (kappa), an index that measures alterations of node
connectiv-ity and captures brain networks reorganization, Fifth Biennial
Confer-ence on Resting State / Brain Connectivity. 2014:
M. Termenon, A. Jaillard, S. Achard, C. Delon-Martin, Hemispheric spe-cialization in men and women using graph theory: a resting-state
functional connectivity MRI study in highly educated healthy adults,
Fourth Biennial Conference on Resting State / Brain Connectivity.
M. Termenon, A. Jaillard, S. Achard, F. Renard, C. Delon-Martin Is ho-motopic intramural connectivity related to cytoarchitectonic cortical
classification?, 20th Annual Meeting of the Organization for Human Brain
State of the art
Stroke in the human brain
2.1
The human brain
The nervous system is a multiprocessor that receives information from the so-matosensory, visual and auditory systems to control voluntary movement and regulate automatic activities such as breathing, heartbeat or digestion. In hu-mans, the brain gives us the capacity for speech reflective thoughts, fine move-ment coordination, attention, judgmove-ment, emotion and social behavior. It keeps our memories, enables us to feel emotions and pain, and gives us our identity.
The human brain consists of three subdivisions: brainstem, cerebellum, and the telencephale cerebral subdivided into two hemispheres. The cerebral cortex is the outer covering of gray matter over the hemispheres covered by the cortex. Each hemisphere is composed of five lobes: the frontal lobe, the parietal lobe, the temporal lobe, the occipital lobe and the limbic lobe, see Fig. 2.1. Each lobe contains several cortical areas, each associated with a particular function, such us vision, audition, motor control, and language. The shape of both hemispheres is very similar, and most cortical areas are replicated on both sides. However, some areas are deeply lateralized; specifically brain areas engaged in language are associated to the left hemisphere in most people. Other functions, such as visual-spatial skills, are usually linked to the right hemisphere.
The neocortex represents the great majority of the cerebral cortex. It has six layers and contains between 10 and 14 billion neurons (20 billion in the whole cerebral cortex) [Armstrong, 1990]. Neurons are connected via synapses to several thousand other neurons. These neurons communicate with one another by means of long fibers called axons, which carry signal pulses called action potentials to distant parts of the brain or body targeting specific recipient cells. The structure of a typical neuron is shown in Fig. 2.2.
The brainstem consists of four parts: the diencephalon, the midbrain, the pons and the medulla. The brainstem is a mixture of deep nuclei and white matter tracts through which sensorimotor information circulates between the cortex, the cerebellum and the spinal cord, see Fig. 2.3. The brainstem nuclei
Figure 2.1: Left hemisphere of the brain showing the four lobes (frontal, pari-etal, temporal and occipital lobes), the somatomotor and somatosensory cortex, the cerebellum and brainstem.
Figure 2.2: The structure of a typical neuron includes four main components: dendrites, cell body (or soma), axon, and axon terminals. The soma contains the nucleus; the dendrites receive signals from the axon terminals of other neurons; the axon conducts electric pulses (known as action potentials) and the axon terminals transmit signals to other cells.
play an important role in the control of cardiac, respiratory, oculomotor and vestibular functions, as well as the level of consciousness [Boundless, 2016].
The cerebellum, is located caudally to the pons. Both structures constitute the metencephalon round the fourth ventricle. The cerebellum is connected to the brainstem via the cerebellar peduncles. It plays an important role in the control of equilibrium, tonus and motor adaptation contributing to coordination, precision, and accurate timing [Fine et al., 2002].
Figure 2.3: Mid-line incision of the human brain. Courtesy of Dr. Johannes Sobotta - Atlas and Text-book of Human Anatomy Volume III Vascular System, Lymphatic system, Nervous system and Sense Organs.
The brain is mainly composed of three different tissues: gray matter (GM), white matter (WM) and cerebrospinal fluid (CSF). The gray matter is consti-tuted of mostly unmyelinated neurons and it contains areas of nerve connections and processing. In the brain, GM is distributed at the surface of the cerebral and cerebellar cortex, the basal ganglia (caudate, putamen, pallidum) and the thalamus, embedded in the white matter of the cerebral hemispheres, the deep cerebellar nuclei (dentate, fastigial, globulus nuclei) and the numerous nuclei of the brainstem. The WM is composed of myelinated nerve cells (axons) that form tracts to connect GM areas to each other and to the spinal cord, carrying nerve impulses from the neuron. The myelin that is composed of segments sep-arated by nodes of Ranvier, has a crucial function in facilitating conduction in axons.
The CSF is a fluid produced in the ventricles that flows over the ventricular and pial surface of the brain and spinal cord. It contains glucose, oxygen, and ions, but no cellular component. The CSF serves to support and cushion the CNS against trauma, removes waste products of metabolism, drugs and other substances which diffuse into the brain from the blood, and carries away solutes, drugs and neurotransmitters which pass into venous blood via the arachnoid villi [Hall, 2010].
Along this thesis, we study how the brain is affected by stroke (introduced in the following section) focusing on the cerebral cortex and cerebellum. Specif-ically, we study the GM of the brain in the cerebral cortex, the depths of the cerebrum and the GM of the cerebellum.
2.1.1
Functional cerebral organization
The brain can also be divided into areas depending on the function they per-form. We can distinguish two functional areas: the sensory areas and the motor areas, that allow you to react upon a sensation. See Fig. 2.4 for a map of the distribution of those areas.
Sensory areas
Somatosensory cortex The primary somatosensory cortex is located in the
postcentral gyrus, which is a prominent structure in the parietal lobe of the human brain. It is the main sensory receptive area for the sense of touch and proprioception.
The sensory homunculus (Fig. 2.5) includes cortical representation of the body based on the degree of sensory innervation.
Lesions affecting the primary somatosensory cortex can produce symptoms including: agraphesthesia (disorientation of the skin’s sensation across its space), astereognosia (inability to identify an object by active touch of the hands with-out other sensory input), hemihypesthesia (reduction in sensitivity on one side of the body), and loss of vibration, proprioception (sense of the relative posi-tion of neighbouring parts of the body and strength of effort being employed in movement) and fine touch. It can also produce hemineglect (inability of a person to process and perceive stimuli on one side of the body or environment). The secondary somatosensory cortex receives connections from the primary sensory cortex and also less specific thalamic nuclei. It contributes to many somatosensory processing tasks including pain perception, tactile attention, and somatosensory working memory. This responds to sensory stimuli bilaterally, although with much less precision than the primary cortex. Nonetheless, lesions to this area may impair some elements of sensory discrimination [Swenson, 2006].
Visual cortex The visual cortex of the brain is the part responsible for
pro-cessing visual information. It is located in the occipital lobe. The primary visual cortex is highly specialized for processing information about static and
Figure 2.4: Brain functional areas for vision, association, motor function, Broca’s speech, hearing, emotions, sensation, smell, written language, cogni-tion and base motor funccogni-tions like balance, equilibrium and posture. Nu-cleus Medical Media (2015). Anatomy and Functional Areas of the Brain. Nmal. Retrieved Oct 1, 2016, from http://www.sciencemedicalart.com/ anatomy-and-functional-areas-of-the-brain/view-item?ItemID=1868
moving objects and is excellent in pattern recognition. The primary visual cor-tex projects to cortical areas surrounding it, called the visual association areas, where signals are interpreted and form is recognized. Selective lesions of these association areas will produce an inability to recognize objects even when they may be seen [Swenson, 2006]. There are additional aspects of visual function, such as color recognition or recognizing movement that are represented in other regions of adjacent cortex.
Auditory cortex The primary auditory cortex, located in the temporal lobe,
processes auditory information. It is a part of the auditory system, performing basic and higher functions in hearing. Thaks to bilateral sound representation, unilateral cortical lesions do not affect hearing [Swenson, 2006].
There are auditory association areas surrounding the primary auditory cor-tex that are involved in the interpretation of sound. In the dominant hemisphere, for understanding language, the cortex surrounding the auditory cortex is re-quired. This is called Wernicke’s area. Damage to Wernicke’s area can produce
Figure 2.5: Sensory homunculus of the human brain shows the somatosensory representation of the body on the cerebral cortex. For example, very sensitive areas such as the lips and the fingertips have a larger representation than other parts of the body.
disability to understand language, even written language. In the nondominant hemisphere, it may be involved in understanding the tone of the voice [Swenson, 2006].
Motor areas
Primary motor cortex The primary motor cortex is located in the dorsal
portion of the frontal lobe. Motor representation at the primary motor cortex is orderly arranged from the toe (at the top of the cerebral hemisphere) to mouth (at the lowest part). Some body parts may be controlled by partially overlapping regions of cortex.
Premotor cortex The premotor cortex (PMC) is an area of motor cortex
lying within the frontal lobe of the brain just anterior to the primary motor cortex. The premotor cortex plays a role in planning movement, in the spa-tial and temporal control of movement, in understanding the actions of others, and in monitoring planned behavior. These functions are supported by distinct subregions of the premotor cortex that have different cytoarchitectonics prop-erties. The PMC projects directly to the spinal cord via the corticospinal tract to control motor functions.
In Fig. 2.6, we show the location of the motor area, with its corresponding homunculus of the human brain.
Figure 2.6: Location of the motor area, with its corresponding homunculus of the human brain.
2.2
Stroke
Stroke represents the ensemble of lesions of the central nervous system caused by a disease of the blood vessels (arteries and veins).
2.2.1
Epidemiology
Stroke is one of the leading causes of mortality and disability worldwide. In the EU, stroke affects approximately 6 million people, with around 1.1 million new cases every year. In France, there are between 130 to 150 000 new cases of stroke per year (a stroke every four minutes), a quarter of patients under 65 years old. More than 50% of stroke patients have residual impairment with neurological and/or cognitive sequelae (sometimes severe), causing a huge burden on the patients, their relatives, and society. In developed countries, given the aging population, projections predict an increase in the prevalence of stroke by 180% for 2030. Thus, effective interventions to attenuate residual impairment are urgently needed.
There are several risk factors that increase the probability of a stroke. The main modifiable risk factors are hypertension, physical inactivity, hypercholes-terolemia (abnormally elevated levels of lipids and/or lipoproteins in the blood, obesity, smooking, food diet, heart disease, diabetes or excess of alcohol. Other risk factors, non modifiable, are age, sex (higher risk in men), inheritance, mi-graine, race and ethnicity (higher risk in Asians, blacks and Hispanics). See Fig. 2.7 for the distribution of stroke mortality worlwide.
Figure 2.7: Age-adjusted and sex-adjusted stroke mortality rates worldwide. The highest rates are in eastern Europe, north Asia, central Africa, and south Pacific. [Johnston et al., 2009].
2.2.2
Physiopathology of ischemic stroke
Stroke is divided into two types: infarct or ischemic stroke and cerebral hem-orrhage. Ischemic strokes, which we will discuss along this thesis, represent about 85% of stroke cases. They are caused by a decrease in cerebral blood flow (CBF) usually confined to a specific region of the brain. In the infarction core, CBF is almost nil. This region evolves towards cell death in minutes. Around this infarction core, the CBF may be less than the threshold of normal neuronal function, but remains above the threshold for cell death. This area is called penumbra. It is a metastable zone, which permits cell survival during a certain duration, at most a few hours (see Fig. 2.8). The penumbra is the main therapeutic target during the acute phase, especially recanalization using thrombolysis or arterial thrombectomy, which aims at restoring cerebral blood flow.
Mechanism of recovery
The term recovery has been used to refer to describe clinical improvements after stroke. Recovery after stroke can be classified into three types [Hommel et al., 2016]:
1. Restitution of damaged structures or functions. Example: recovery after recanalization resulting in penumbra reperfusion.
Figure 2.8: Immediately after an ischemic stroke, a core of irreversibly damaged brain tissue (red) is surrounded by an area of viable but at-risk tissue called the penumbra (green). Unless blood flow is restored quickly, the tissue within the penumbra will be also lost (right).
neural reorganization resulting in a normal pattern of activation or net-work and to good to complete recovery. Example: recovery after capsular infarction or primary motor cortex infarction.
3. Compensatory recovery based on beneficial and maladaptive plasticity and contralesional and perilesional neural reorganization resulting in in-complete recovery, associated to epilepsia and spasticity that may worsen neurological deficits.
Post Stroke plasticity and Brain repair
The adult brain has a striking capacity for self-repair 2.9 often resulting in re-emergence of developmental organizational patterns. During stroke recov-ery, beyond phenomena related to adaptive functional compensation, there is "structural" brain plasticity based on the surviving tissue participating in reor-ganization of damaged networks and exhibiting neuro-synaptogenesis with ax-onal sprouting that can persist for several months [Arvidsson et al., 2002]. This form of post-stroke plasticity notably occurs in elderly human brains [Minger et al., 2007]. Stroke also increases neurogenesis from neural stem cells (NSC) of the subventricular zone (SVZ) and hippocampal dentate gyrus, generating neu-roblasts that migrate to the lesion and differentiate into mature neurons. This
post-stroke neurogenesis is closely linked to angio-vasculogenesis and glial func-tion leading to the concept of a "glio-neurovascular niche" as a favorable "stem cell niche". Endothelial cells, but not vascular smooth muscle cells, release factors that both stimulate the self-renewal of NSC and also enhance neuron production. Microvessels size and density changes stimulate the neuronal plas-ticity after stroke. For several months following stroke, neuroblasts from the SVZ migrate close to vessels through an area exhibiting early vascular remodel-ing stimulated by the release of neurotrophic factors. Neuroblasts also enhance angiogenesis, a relationship underlining the bidirectional link between microvas-cular and neuronal remodeling. Ischemia promotes the formation of new blood vessels (angiogenesis) in the regions that were ischemic. A recent discovery, the neurogenesis, consists of multiplication and migration of neuroblasts from the periventricular region toward the infarcted area where these neuroblasts can turn into nerve cells (neurons and glial cells) and promote the production of growth factors. Synaptogenesis which characterizes the development of new dendrites participate in the structural and functional changes that characterize brain plasticity [Detante et al., 2014].
2.2.3
Clinical manifestation
2.2.3.1 The stroke syndrome
The diagnosis of stroke, which is usually not debatable, is characterized by the sudden occurrence of a nonconvulsive focal neurological deficit [Ropper et al., 2014].
The mode of occurrence The onset is usually abrupt, and it is expressed
in seconds or minutes. This is especially the case in emboli. When the mecha-nism is atherothrombosis, the deficit can be installed in a few hours, rarely few days. Its installation is often more fluctuating than progressive. Intracerebral hematomas can be installed in seconds and then abruptly continue to gradually get worse over a few hours.
The focal syndrome The focal syndrome is characterized by focal deficit
which defines the topography of the infarct or hematoma. It locates the lesion very precisely.
The ’silent’ stroke Not all strokes have clinical manifestation and some occur
without the patient or his family noticing. In these cases, the accumulation of accidents and especially brain imaging can make the diagnosis.
2.2.3.2 Topographic hemispheric syndromes
An understanding of cerebral vascular territories is important in understanding stroke. All hemispheric arteries have branches that divide a cortical territory from a deep territory. The territories that are at the junction of deep and
S tr o k e d am a g e s E n d o g en o u s p ro te ct io n T h er a p e u ti c st ra te g ie s Collaterals Reperfusion ↑ GABA K+ ATP IV thrombolysis Thrombectomy Craniectomy Antibiotherapy Hypothermia Structural plasticity: Neurogenesis Synaptogenesis Angiogenesis Oligodendrogenesis Astrogliosis scar modulation Neuroprotection Rehabilitation / Learning Neuroprotectants: - Anti-excitotoxic - Anti-oxydative: Edaravone, statins… - Antiapoptotic: EPO… - Immunomodulator: Cyclosporine… - Others: Sildenafil, SRI,
Cilostazol, Minocycline… Neural graft: - Precursors - Neural SC - Neurons Ca2+ Glutamate / K+ Excitotoxicity
Free radicals Inflammation Necrosis
Depol.
Apoptosis
Minutes Hours Days Weeks Months / Years
HSP, BCL protein, IL10 Free radical scavengers BDNF, VEGF, EPO ↓ NOS, ↑ GABAA receptors
IL1-R antagonist ↓ GluR2
Neural repair / Regeneration
Intensive care:
BP, glycemia, nursing (mobilization, infection prevention…)
GF / Cell therapy:
- GCSF, EPO… - Cell therapy (MSC, MNC, HSC, EP…)
Figure 2.9: Time course of stroke and associated therapeutic time-windows. BCL: B-cell lymphoma protein; BDNF: brain derived neurotrophic factor; BP: blood pressure; Depol.: peri-infarct depolarisation; EP: endothelial progenitors (CD34+); EPO: erythropoietin; GCSF: granulocyte-colony stimulating factor; GF: growth factors; GluR2: glutamate receptor (subunit 2); HSC: hematopoi-etic stem cells (CD34+); HSP: heat-shock protein; IL: interleukin; IP3: inosi-tol tri-phosphate; IV: intravenous; MNC: mononuclear cells; MSC: mesenchy-mal stromesenchy-mal/stem cells; NOS: NO synthase; SRI: serotonin reuptake inhibitors; VEGF: vascular endothelial growth factor. Image reproduced from [Detante et al., 2014].
superficial territories as well as those at the junction between the superficial arterial territories are very sensitive to overall decreases in perfusion pressure. Arterial territories are represented in Fig. 2.10.
The clinical picture that results from an occlusion of any one artery differs in minor ways from one patient to another, but there is sufficient uniformity to justify the assignment of a typical syndrome to each of the major cerebral arteries and their branches and their identification by neurological examination. Thus, the clinical picture depends on the site of arterial occlusion and extent of brain damage.
Anterior cerebral artery (ACA)
This artery, through its cortical branches, supplies the anterior three-quarters of the medial surface of the frontal lobe.This artery covers 3/4 of the anterior frontal pole (cortical territory) and the greater part of the inner face of the hemispheres. Deep branches supply the anterior limb of the internal capsule,
Figure 2.10: Cerebral Arterial Territories: Anterior Cerebral Artery (ACA), Middle Cerebral Artery (MCA), Posterior Cerebral Artery (PCA) and Anterior choroidal Artery (AchA) [Blumenfeld, 2010].
the inferior part of the head of the caudate nucleus, and the anterior part of the globus pallidus.
Infarctions in the ACA’s territory are manifested mainly by cognitive deficits. The more severe are observed when the two anterior cerebral arteries are oc-cluded. Clinical picture presents paraplegia, sphincter incontinence, often a very important slowness of intellectual, lack of initiative, aphasia, reasoning disorders, inability to anticipate, troubles making choices, personality disor-ders, unstable emotions, mood disorders (depression). The head and eyes can be deviated on the lesion’s side.
Middle cerebral artery (MCA)
The middle cerebral artery (MCA) artery has superficial and deep hemispheral branches that supply the largest portion of the cerebral hemisphere. Through
its cortical branches, it supplies the lateral (convexity) part of the cerebral hemi-sphere (see Fig. 2.10) encompassing: (1) the cortex and white matter of the lateral and inferior parts of the frontal lobe - including motor areas 4 and 6, contraversive centers for lateral gaze and the motor speech area of Broca (domi-nant hemisphere); (2) the cortex and white matter of the parietal lobe, including the primary and secondary sensory cortices and the angular and supramarginal gyri; and (3) the superior parts of the temporal lobe and insula, including the receptive language area of Wernicke. The deep penetrating or lenticulostriate branches of the MCA supply the putamen, a large part of the head and body of the caudate nucleus, the outer globus pallidus, the posterior limb of the internal capsule, and the corona radiata. The MCA may be occluded in its proximal longitudinal portion, or the stem that is proximal to its bifurcation (the term M1 is used by radiologists to denote this portion of the vessel). An occlusion at this site blocks the flow in the small deep penetrating vessels as well as in superficial cortical branches. An occlusion at the distal end of the stem blocks only the orifices of the divisions of the artery in the sylvian sulcus but leaves unaffected the deep penetrating vessels.
MCA stem occlusion syndrome The clinical picture is particularly
se-vere: contralateral hemiplegia (face, upper limb, lower limb), hemianaesthesia contralateral (same topography as motor weakness), homonymous lateral hemi-anopia, head and eyes deviation on the side of the lesion, cognitive impairment (global aphasia, multimodal neglect syndrome). The prognosis is poor in the absence of early unblocking, with up to 40% of deaths due to the severity of the neurological impairment, and very disabling sequelae for survivors.
Striato capsular infarction Patients have a degree of hemiparesis and,
de-pending on the extent of the lesion within basal ganglia, may have moderate aphasia or hemineglect.
superficial MCA infarction This type of cerebral infarction includes a
de-gree of sensorimotor impairment often associated with cognitive impairment, aphasia or multimodal neglect of moderate to severe intensity. There is usually a superior quadrantanopia or hemianopia. Frequently, regardless of the side of the obstruction, other cognitive deficits are observed. In particular, impairment of executive functions and especially the working memory. With right-sided ones, a left visual neglect is common. With left-sided lesions there is initially a global aphasia, which changes to a predominantly nonfluent (Broca) aphasia, with the emergence of an effortful, hesitant, grammatically simplified, and dys-melodic speech. When the infarction occurs in the lower branch of the MCA, the Wernicke’s aphasia is the characteristic damage of the dominant hemisphere. Partial language deficits are observed in lesions of smaller size.
Anterior choroidal artery (AchA)
The anterior choroidal artery (AchA) originates from the internal carotid artery. It supplies the internal segment of the globus pallidus and posterior limb of the internal capsule and several contiguous structures including (in most patients) the optic tract (deep territory) and the hippocampus (superficial territory). The typical clinical picture is hemiplegia, hypoesthesia, homonymous hemi-anopia, and neglect, with well-preserved language and cognition. With right-sided lesions, there may be a left spatial neglect and constructional apraxia; slight disorders of speech and language may accompany left-sided lesions. How-ever, there is no uniform syndrome attributable to occlusion of the AchA and in most cases its territory of supply is overlapped by small surrounding vessels, leading to pure motor hemiplegia and sometimes, to ataxic hemiparesis. Posterior cerebral artery (PCA)
Both posterior cerebral arteries are formed by the bifurcation of the basilar artery and thin posterior communicating arteries join this system to the internal carotid arteries. The superficial PCA territory includes the inferomedial part of the temporal lobe and the medial occipital lobe, including the lingula, cuneus, precuneus, and visual Brodmann areas 17, 18, and 19. The deep branches supply the inferior, medial, and anterior parts of the thalamus (thalamoper-forate branches), the geniculate body and the central and posterior parts of the thalamus (thalamogeniculate branches), lateral part of the cerebral pedun-cle, lateral tegmentum and corpora quadrigemina, and pineal gland (medial branches), and the posterosuperior thalamus, choroid plexus, posterior parts of the hippocampus, and decussation of deep white matter fornices (posterior choroidal branches) [Ropper et al., 2014].
Depending upon the location and severity of the occlusion, signs and symp-toms may vary within the population affected by an occlusion of PCA. Le-sions in the superficial territory can result in complications such as visual deficits, dyslexia, color naming and discrimination problems, memory defect, topographic disorientation.
Occlusions of the branches of the PCA that supply the thalamus can result, among others, in spontaneous pain, somatosensory impairments, and involun-tary movements.
The brainstem and cerebellum are supplied by the basilar artery formed by the convergence of the two vertebral arteries, and their branches including the three cerebellar arteries. Vertebrobasilar infarcts often have very diverse clinical manifestations, because the lesions can be arranged on different levels of the brain stem.
2.2.4
Treatment for stroke rehabilitation
While preventive approaches are effective in reducing stroke mortality and inci-dence, current treatment of ischemic stroke is effective but limited to the acute
period. Improved subacute stroke care is essentially due to stroke units effect, physiotherapy and rehabilitation. Most hemiplegic patients regain the ability to walk to some extent, usually within a 3- to 6-month period, and this should be a primary aim in rehabilitation. The presence of deep sensory loss or anosognosia in addition to hemiplegia are the main limiting factors. Some degree of cogni-tive dysfunctioning is almost constant at the subacute stage of stroke [Jaillard et al., 2009], and remains frequently observed at the chronic stage in association with social dysfunctioning [Hommel et al., 2009] and depression [Hommel et al., 2015]. In total, more than half of the patients are left with sensorimotor and cognitive disabilities, resulting in additional burden to health care, in terms of social, handicap and financial costs [Gustavsson et al., 2010].
Non invasive brain stimulation including transcranial magnetic stimulation (TMS) and transcranial direct current stimulation (tDCS), has been used to investigate brain plasticity changes resulting from stroke as well as language [Dammekens et al., 2014] and motor function improvement [Hoyer and Celnik, 2011], but its safety and efficacy remains to be demonstrated.
Stem cells based therapy
Recent progress in the field of stem cell research offers attractive strategies to enhance functional outcome after stroke. In particular, mesenchymal stem cells are shown to be beneficial in experimental stroke models by acting through brain own repair mechanisms such as neurogenesis, synaptogenesis, angiogenesis and immunomodulation. The major advantage of such regenerative therapies is the extended therapeutic time window up to several weeks or months after the initial insult. This makes the treatment available to a much larger number of stroke patients.
It is well-known that stroke effects are not limited to neurons but involve glial and endothelial cells and the surrounding extracellular matrix in a "glio-neurovascular niche" that interacts with the peripheral immune system. Stem cells have the potential to develop into many different cell types in the body during early life and growth. In many tissues, they serve as an internal repair system, dividing without limit to replenish other cells as long as the person (or animal) is still alive. When a stem cell divides, each new cell has the potential ei-ther to remain a stem cell or become anoei-ther type of cell with a more specialized function, such as a muscle cell, red blood cell, or brain cell [Gutiérrez-Fernández et al., 2013].
The functional benefits of cell therapy on stroke recovery are well established in animal [Lees et al., 2012, Gutiérrez-Fernández et al., 2013], but are still under evaluation in humans.
Clinical Trials in CHU Grenoble
The CHU Grenoble leads two clinical trials related to stem cells treatment of stroke. The first one, "Intravenous Stem Cells After Ischemic Stroke" (ISIS,
Figure 2.11: Illustration of the experimental work supporting the potential application of MSC to the treatment of stroke. Bone marrow is extracted from the animal or human being and the MSC are separated and cultured for three to five passages. They are then injected intravenously into the animal with neural injury and migrate selectively to injured tissue and localise to the boundary zone of the lesion. Image reproduced from [Chopp and Li, 2002].
PHRC 2007)1 tried to evaluate the feasibility and tolerance of the intravenous
injection of autologous mesenchymal stem cells for patients presenting an is-chemic stroke (less than 6 weeks). The randomized trial included 31 patients with a 2-year follow-up period. An ancillary MRI study, HERMES (HEuristic value of multimodal MRI to assess MEsenchymal stem cell therapy in Stroke, PHRC 2010), explored the mechanisms of recovery associated to multimodal MRI changes. The patients data used in this PhD thesis were collected in this
1https://clinicaltrials.gov/ct2/show/NCT00875654?term=ISIS+stroke+stem+cells&
project.
A new multicentre clinical trial, "REgenerative Stem cell therapy for STroke
in Europe" (RESSTORE)2, is sponsored by CHU Grenoble in the context of an
european multisite project HORIZON 2020.
Its clinical objective is to provide essential information on the therapeutic efficacy of intravenous delivery of allogenic adipose tissue derived mesenchymal stem/stromal cells in 400 stroke patients.
Magnetic resonance imaging
(MRI): from acquisition to
preprocessing
3.1
Introduction
Magnetic resonance imaging (MRI) is a non-invasive medical imaging technique extensively used in radiology for the diagnosis of several diseases. MRI scanners use magnetic fields and radio waves to excite and register the relaxation of hydrogen nuclei (single protons) mainly contained in water molecules (Fig. 3.1). This way, it is possible to explore the internal body without exposure to ionizing radiation.
All MR images are produced using pulse sequences that contains radiofre-quency (RF) pulses (for excitation) and gradients of magnetic field (for image formation) of carefully controlled durations and timings [McRobbie et al., 2007]. These images show high resolution anatomic details and allows to separate dif-ferent soft tissues based on their difdif-ferent relaxation properties [Gore, 2003].
The spatial resolution of the MRI images is defined by the size of the imag-ing voxels. The size of the voxel and therefore the resolution depends on the matrix size, the field-of-view (FOV), and the slice thickness, that depend on the gradients strength. Nowadays, in structural MRI, the voxel size is usually
around 1 mm3. A single voxel in a MRI scan typically contains on the order of
one million neurons and tens of billions of synapses [Huettel et al., 2014] (the actual number depending on voxel size and the area of the brain being imaged). MRI scans are acquired in slices.
There are two main types of information provided by brain MRI and used in this work: structural MRI and functional MRI.
Figure 3.1: The Philips Achieva 3.0T TX scanner of the MRI research facility at Grenoble University Hospital (IRMaGe CHU Grenoble).
3.2
Structural MRI
Structural MRI is used to study the anatomy and pathology of the brain describ-ing the shape, size and integrity of its inner structures. There are multiple tech-niques to map the structures of the brain. Depending on the imaging technique used, specific features of anatomical structures will be emphasized, allowing to differentiate brain tissues or determine which structures are abnormal.
In MRI, some important intrinsic properties are the proton density and two characteristic times called spin-lattice relaxation time and spin-spin relaxation
time, T1and T2respectively. Proton density is related to the number of
hydro-gen atoms in a particular volume, and relaxation times describe how long the protons of each tissue takes to get back to equilibrium after a RF pulse [McRob-bie et al., 2007].
It is all a matter of contrast. Image contrast is a function of differences in tissue properties. By modifying MRI sequence parameters such as TR and TE, for example, structural MRI can emphasize the contrast between gray matter
(GM) and white matter (WM) (such as in T1-weighted inversion-recovery
se-quence) or between brain tissue and cerebrospinal fluid (CSF) (e.g., T2-weighted
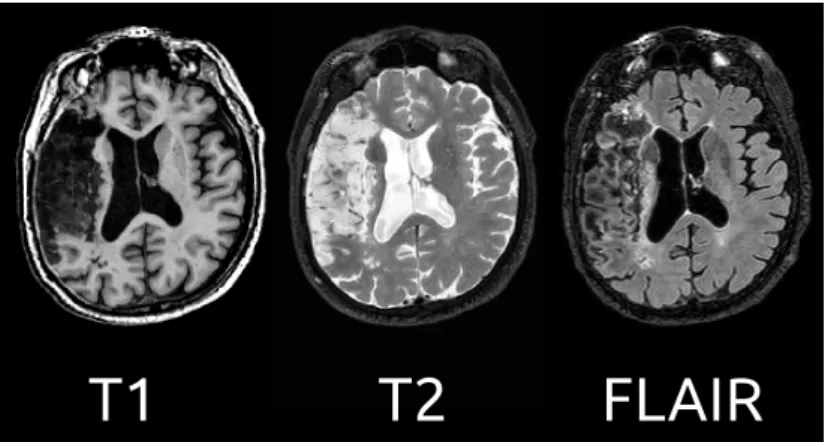
spin-echo sequence).Fluid-attenuated inversion recovery (FLAIR) is a technique that uses a 180° inversion pulse to suppress the CSF signal from the image. As the CSF signal is completely suppressed for cortical or periventricular areas, lesions that are adjacent to spinal fluid become much more hyperintense
com-pared with conventional T2 imaging [Brant-Zawadzki et al., 1996]. This type
of image is of particular interest in acute stroke patients. See Fig. 3.2 for an example of these techniques in a stroke patient.
There are many other structural MRI techniques depending on the particu-lar properties or structures in study, such as angiography, diffusion imaging and susceptibility imaging among others. See McRobbie et al. [2007] for a descrip-tion.
Figure 3.2: Illustration of different structural MRI images of a stroke patient.
On the left, T1-weighted acquisition provides good contrast between gray matter
(dark gray) and white matter (lighter gray) tissues, while CSF is void of signal
(black). On the middle, T2-weighted acquisition provides good contrast between
CSF (bright) and brain tissue (dark). On the right, FLAIR acquisition offers a more detailed view of the stroke lesion. Courtesy of Dr. Jaillard (CHU Grenoble).
3.3
Functional magnetic resonance imaging (fMRI)
Over a century ago, Roy and Sherrington [1890] observed that cerebral blood flow and neural activity were coupled, so when an area of the brain is active, the blood flow that reaches that area is also increased. This is based on the principle that local fluctuations in neural activity are linked to changes in oxygenated and deoxygenated concentrations of hemoglobin. When neural activity in a brain region increases, more oxygen and glucose are required. These resources are provided by an increased oxygen availability in the arterial component of the vascular system, resulting in a higher concentration of oxygenated hemoglobin in the venus component of that particular brain area soon after its activation. This phenomenon is known as the haemodynamic response (see Fig. 3.3).
Due to the fact that oxygenated and deoxygenated hemoglobin present dif-ferent magnetic properties, MRI can detect activity related fluctuations in the oxygen proportion between oxygenated and deoxygenated hemoglobin. In the
case of fMRI, the MRI signal is measured using sequences sensitive to T2*
(gra-dient echo)1. An increased neuronal activity in a brain region, will increase the
blood oxygen concentration in the adjacent capillaries and locally reduce the
1T
2* relaxation refers to decay of transverse magnetization caused by a combination of
spin-spin relaxation and magnetic field inhomogeneity. T2* can be considered as the observed
T2, whereas T2 can be considered as the true T2 of the tissue being imaged. T2* is always
less than or equal to T2. Their relation can be written as: 1/T2∗ = 1/T2+ 1/T2i, where
1/T2iis the relaxation rate contribution attributable to field inhomogeneities across a voxel
A) B)
Figure 3.3: Illustration of the haemodynamic response. A) When a neuron is ac-tivated, it consumes oxygen from the blood stream, leading to an increase in the concentration of deoxy-hemoglobin in the blood. After the onset of neuron ac-tivity, the active neurons consume the oxygen available in the local blood stream and thus the relative level of deoxy-hemoglobin increases more.B) After this ini-tial increase in deoxy-hemoglobin concentration, local blood flow increases in response to neuronal activity, providing a large amount of oxygen-rich blood, more than the required amount to preserve oxygen consumption due to neural activity. This results in local decrease in the concentration of deoxy-hemoglobin in the vessel with respect to A).
magnetic field inhomogeneities. Less inhomogeneities leads to increased T2
*-weighted signal. This is refered to as the blood oxygen level-dependent
(BOLD)signal, discovered by Ogawa et al. [1990].
By using fast-acquiring MRI methods such as EPI (EchoPlanar Imaging) sequence, gradient-echo images of the brain can be acquired in few seconds (2 or 3 s) with reasonable spatial resolution (around 2 mm). By capturing multiple brain images during several minutes, it is possible to display BOLD signal fluctu-ations over time. In order to control the changes in brain state, different stimuli or tasks are used, such as images, sounds or finger movements, for example. By controlling the exact moment that the stimulus/task is applied, it is possible to study the brain regions associated with that particular stimulus/task [Huettel et al., 2014, Ferreira and Busatto, 2013]. In Fig. 3.4 an example of BOLD signal is shown. Fox et al. [2005] studied the primary visual cortex during a simple task paradigm that requires subjects to open and close their eyes.
Even if fMRI does not provide a direct measure of neural activity, it is a non invasive technique that can be applied over the whole brain (including cerebellum). It is highly used in research but also with clinical purposes.
Figure 3.4: Unaveraged blood oxygen level dependent (BOLD) time course (ma-genta) from a region in the primary visual cortex during a simple task paradigm that requires subjects to open and close their eyes. The paradigm is shown in blue (delayed to account for the haemodynamic response). Traditional func-tional magnetic resonance imaging (fMRI) analysis involves correlating BOLD data with a stimulation time-course across multiple blocks. Statistical tests are performed to test at voxel level if there is an effect related to stimulus, highlighting regions that are modulated by the task paradigm. In this case, contrasting the eyes-closed condition from the eyes-open condition identifies a BOLD signal intensity difference in the primary visual cortex (shown on the right). Reproduced with permission from Fox et al. [2005].
3.4
Resting state fMRI
A particular case of fMRI is the so-called resting state fMRI (rs-fMRI). It uses the same technique of fMRI but measuring the changes of BOLD signal without applying any controlled stimuli neither task. It is based on the principle that the brain at rest is not idle, quite the contrary it presents strong and persistent functional activity [Buckner et al., 2008]. Such activity presents a particular property: it is composed of spontaneous low-frequency fluctuations (< 0.1 Hz) of BOLD signal [Van Dijk et al., 2010]. An example of such a time course during rs-fMRI of a region in the brain is shown in Fig. 3.5 with its typical frequency content.
If two brain regions have a similar activation pattern, they are highly corre-lated. They are considered to have a common functional role. The correlation across different voxel/regions is a manifestation of functional connectivity of the brain [Biswal et al., 1995]. The investigation of these spontaneous functional connectivity is the field of research of rs-fMRI. A detailed explanation of the methods to investigate functional connectivity is given in the next section.
3.4.1
Acquisition of rs-fMRI data
There are several parameters that need to be fixed before acquiring the func-tional images. The resolution of funcfunc-tional images is lower than the structural
ones, usually voxel size is between 2 and 4 mm3. Typical values for a 3D volume