Publisher’s version / Version de l'éditeur:
Vous avez des questions? Nous pouvons vous aider. Pour communiquer directement avec un auteur, consultez la
première page de la revue dans laquelle son article a été publié afin de trouver ses coordonnées. Si vous n’arrivez
pas à les repérer, communiquez avec nous à [email protected].
Questions? Contact the NRC Publications Archive team at
[email protected]. If you wish to email the authors directly, please see the
first page of the publication for their contact information.
https://publications-cnrc.canada.ca/fra/droits
L’accès à ce site Web et l’utilisation de son contenu sont assujettis aux conditions présentées dans le site
LISEZ CES CONDITIONS ATTENTIVEMENT AVANT D’UTILISER CE SITE WEB.
ChemCatChem, 5, 6, pp. 1449-1460, 2013-03-01
READ THESE TERMS AND CONDITIONS CAREFULLY BEFORE USING THIS WEBSITE.
https://nrc-publications.canada.ca/eng/copyright
NRC Publications Archive Record / Notice des Archives des publications du CNRC :
https://nrc-publications.canada.ca/eng/view/object/?id=6ecb0940-ab05-4ad0-92f5-0d90b8587288
https://publications-cnrc.canada.ca/fra/voir/objet/?id=6ecb0940-ab05-4ad0-92f5-0d90b8587288
NRC Publications Archive
Archives des publications du CNRC
This publication could be one of several versions: author’s original, accepted manuscript or the publisher’s version. /
La version de cette publication peut être l’une des suivantes : la version prépublication de l’auteur, la version
acceptée du manuscrit ou la version de l’éditeur.
For the publisher’s version, please access the DOI link below./ Pour consulter la version de l’éditeur, utilisez le lien
DOI ci-dessous.
https://doi.org/10.1002/cctc.201200614
Access and use of this website and the material on it are subject to the Terms and Conditions set forth at
Compositional and morphological changes for ordered PtxFey/C
oxygen electroreduction catalysts
Chen, Liang; Chan, Mickey C. Y.; Nan, Feihong; Bock, Christina; Botton,
Gianluigi A.; Mercier, Patrick H. J.; Macdougall, Barry R.
FULL PAPERS
DOI: 10.1002/cctc.200((will be filled in by the editorial staff))Compositional and Morphological Changes for
Ordered Pt
x
Fe
y
/C O
2
Electro-Reduction Catalysts
Christina Bock,*
[a]Mickey C.Y. Chan,
[b]Feihong Nan,
[b]Liang Chen,
[a]Gianluigi A.
Botton,
[b]Patrick H.J. Mercier,
[a]and Barry R. MacDougall
[a]Changes in O2 reduction activity (orr) and structural changes of
carbon supported catalysts upon electrochemical stress testing are investigated. Focus is placed on two alloy catalysts of nominal Pt3Fe/C and Pt3Fe2/C compositions. Energy dispersive X-ray
Spectroscopy (EDXS) spot and line analyses reveal a dependence of the Fe composition on the particle size particularly for the two as-prepared catalysts. Catalyst particles are shown to exist of a Pt enriched shell and a PtxFeyalloy core. Larger (> ca. 10 nm) particles
are shown to have a higher Fe content that approaches the nominal composition suggesting that the smaller (< ca. 6 nm) Pt catalyst particles are more difficult to alloy. HAADF-STEM, XRD, and scanning electron microscopy (SEM) with EDXS show that Fe is gradually lost from the catalyst particles as a result of extensive
potential (E)-cycling. Changes upon E-cycling are most clearly observed for the small (< 3 nm) particles, for which, Fe is almost entirely depleted. However, the catalytic orr activities remain constant over an extensive cycling period for the PtxFey/C catalysts. In fact, the
mass orr activities are seen to decrease proportionally with the Pt surface area (APt). The histograms before and after cycling are
compared to observed changes in APt, and are also discussed in
comparison to E-holding experiments. It is concluded that the dissolution of Pt is a strong contributor for the observed drop in APt
and mass orr activity for the PtxFey/C catalysts. The continuous
transition between Pt-oxide formation and its reduction to Pt metal is suggested to play a major role for the degradation of the PtxFey/C
catalysts studied in this work.
Introduction
Polymer electrolyte fuel cells (PEMFCs) have attracted a lot of attention due to their potential use as alternative power sources for automotive and stationary applications[1]. Despite considerable
advances in PEMFC technologies, improvements of the cathode catalysts’ activity and lifetime are of great importance for the successful implementation of PEMFCs.
There are many literature reports about PEMFC cathode catalysts that facilitate the O2reduction reaction (orr). In general it
is concluded that electronic and geometric factors contribute to observed improvements in catalytic orr activities.[2-5] The
geometrical factor refers to the contraction of the Pt catalyst lattice introduced by forming a solid solution, such as in PtxMy(M
being e.g., Cr, Fe, Co, Ni, Cu), etc.[2-5]A shortening of the Pt-Pt
distance favors the dissociative adsorption of O2, and hence,
enhances the orr activity.[2] Electronic effects refer to an increase
in the d-band vacancy that can take place upon e.g., forming a solid solution.[3,6]An increase in the 5d band vacancy leads to
minimization of Pt-oxide, hence, freeing up Pt metal sites that are essential for the orr.[3]Many researchers also report that ordered
catalysts show an enhanced catalytic orr activity as compared to their disordered equivalents.[7,8]Other papers report that catalysts
consisting of a thin (typically monolayer) Pt skin structure on a foreign metal or alloy core increases the orr activity.[9]Again, this
effect is ascribed to be due to a strain in the Pt lattice, which is similar to a decrease of the Pt-Pt bond. For the majority of proposed orr catalysts, a Pt-alloy structure is involved, either as “alloy” catalyst particle or as core for a Pt or Pt enriched shell. Some reports comment on electrochemical or acid leaching of the ad-metal component from the Pt-alloy to achieve Pt skin type
catalyst particles of reported higher orr activities.[10,11]However, it
is noteworthy that the preparation of Pt-alloys typically involves higher temperature treatments in an H2 enriched atmosphere.
Therefore, it is likely that the surface of an as-prepared “Pt-alloy” catalyst particle is already enriched with Pt. The structure of the as-prepared catalysts is known to change particularly under real FC operating conditions that involve strongly acidic conditions and high oxidation potentials. Studies of the lifetime of PEMFC cathode catalysts have attracted a lot of attention in recent years.[12-17]Many studies have used Pt/C and PtxCoy/C catalysts.
Corrosion of the carbon support is generally accepted as an issue. Furthermore, Pt as well as catalyst ad-metals dissolve, small Pt particles migrate, and dissolved Pt can be re-deposited onto other Pt particles. Transmission electron microscopy (TEM) has been involved to show particle agglomeration and growth and deposition of Pt within the membrane when lifetime tests were carried out in FC set-ups.[16] It is clear that the possible
degradation of PEMFC catalysts can take many pathways and is also subject to experimental conditions. Furthermore, many of the previous studies involved bulk analyses of the catalyst and systems rather than an examination on the nano-scale.
In this work, PtxFey/C catalysts are made and characterized
using X-ray diffraction (XRD) and aberration-corrected high angle
[a] Dr. C. Bock, Dr. L. Chen, Dr. P.H.J. Mercier, Dr. B.R. MacDougall Energy and Mining Portfolio
National Research Council Canada
1200 Montreal Road, Ottawa, Ontario, Canada, K1A 0R6 Fax: (+1) 613 941 2529
E-mail: [email protected]
[b] M.C.Y. Chan, F. Nan, Dr. G.A. Botton
Department of Materials Science and Engineering McMaster University
annular dark-field scanning transmission electron microscopy (HAADF-STEM) to compare information gained from bulk property measurements with information of the catalyst structure on the nano-scale. The PtxFey/C system is selected as initial
results showed that solid solutions can be formed. In addition, there is a strong scattering contrast between Pt and Fe in HAADF-STEM imaging so that the detection of local ordering changes is possible. Changes in the catalyst structure and composition as a result of electrochemical durability testing are studied using HAADF-STEM, XRD, and scanning electron microscopy with energy dispersive X-ray spectroscopy (SEM-EDXS). The near surface and bulk atomic structure of the catalysts and their size-dependent composition and morphology are determined for the as-prepared as well as electrochemically treated catalysts. Changes in catalyst structures are compared to changes in Pt surface area and orr activity.
Results and Discussion
Characterization of as-prepared catalysts
Fig. 1a shows the XRD patterns for the series of catalysts synthesized according to the procedures described in the Experimental Sections. A broad reflection was found at 2θ values of ca. 24.8o, which is due to the carbon support. The diffraction
peaks of the as-prepared Pt3Fe/C(800) and Pt3Fe2/C(800)
catalysts are seen to be at higher 2θ angles than observed for the Pt/C and Pt/C(800) catalysts. This indicates a lattice contraction arising from the substitution of Fe atoms (atomic radius 126 pm) for the larger Pt atoms (atomic radius 139 pm). From the phase diagram, it was found that bulk PtxFey can form three ordered
alloy phases (Pt3Fe, PtFe and Fe3Pt) as well as a disordered
PtxFeysolid solution.[22] 20 30 40 50 60 70 80 90 2 Theta / o In te n s it y / a .u . a Pt/C Pt(800)/C Pt3Fe(800)/C Pt3Fe2(800)/C
Figure 1a XRD patterns of PtxFey/C series catalysts. Figure 1b Stick XRD
patterns of cubic Pt [Fm-3m], ordered cubic Pt3Fe [Pm-3m], ordered tetragonal
PtFe [P4/mmm] and cubic Fe [Fm-3m]. Platinum atoms: White balls; iron atoms: Brown balls.
Pt3Fe has a cubic structure (space group [Pm-3m]), in which
the Fe atoms occupy all corner positions and the Pt atoms occupy all the face centered positions (see the inset Fig. 1b). PtFe has a tetragonal structure (space group [P4/mmm]), in which the Pt and Fe atoms occupy the alternate (001) planes (see the inset of Fig. 1b). The disordered PtxFeyphase has a face
centered cubic structure (space group [Fm-3m]), in which the Pt and Fe atoms are randomly distributed at corner and face centered positions. The presence of superlattice reflections, such as the (110) reflections indicate the formation of an ordered alloy structure. These superlattice reflections are observed for both the Pt3Fe2/C(800) and Pt3Fe/C(800) catalysts (Fig. 1a). The
difference between the XRD patterns of the two ordered alloy structures is the presence of two small shoulders at 2θ values of 49.2o(due to the (002) reflection) and at 70.6o(due to the (202)
reflection) for the case of the PtFe type alloy structure.
From Rietveld analysis, the Pt3Fe/C(800) catalyst is
suggested to contain a single ordered cubic [Pm-3m] Pt3Fe phase
with a=b=c=3.872(1) Å, while the Pt3Fe2/C(800) catalyst contains
an ordered cubic Pt3Fe phase (a=b=c=3.851(2) Å) and an
ordered tetragonal [P4/mmm] PtFe phase (a=b=2.729(1) Å, c=3.750(3) Å). The Rietveld analysis of the Pt3Fe2/C(800)
catalysts also shows that the [Pm-3m] phase has a crystallite size smaller than the [P4/mmm] phase indicated in the broader peak of the former. Table 1 summarizes the phase composition, lattice parameter, and crystallite size derived from the XRD analyses of the as-prepared catalysts.
Table 1. Structure for Pt series catalysts
Sample Phase type a/ Å c/ Å Comp**/ wt. % dc#nm / (hkl) Pt/C Fm-3m (Pt) 3.972 - 100 2.1 (220) Pt/C* Fm-3m (Pt) 3.972 - 100 5.8 (111) Pt3Fe/C* Pm-3m(Pt3Fe) 3.872(1) - 100 6 (111) Pt3Fe2/C* Pm-3m (Pt3Fe) P4/mmm (PtFe) 3.851(2) 2.729(1) -3.750(3) 41.4 58.6 6 (111) *: Samples annealed at 800 oC; **: Composition (Comp); #: Crystallite size (dc).
HAADF-STEM was employed to further investigate the structure of these catalysts. HAADF images of the as-prepared Pt3Fe/C(800) and Pt3Fe2/C(800) catalysts are shown in Fig. 2. It
is seen that the particle size distribution of the two as-prepared PtxFey/C catalysts varies from 1 to 25 nm. The mean particle
sizes calculated from the histograms in Fig. 3, are 4.2 and 3.8 nm for the Pt3Fe/C(800) and Pt3Fe2/C(800) catalyst, respectively. The
mean particle sizes determined by TEM for both samples seem to be smaller than the average crystallite size of ca. 6 nm estimated from the XRD patterns.
Fig. 4 shows the [001], [111], and [110] views for a (2×2×2) Pt3Fe supercell and the [010] view of a (2×2×2) PtFe supercell.
The lattice parameters of the crystal structures are derived from the JCPDS cards (89-2050 for Pt3Fe and 65-1051 for PtFe). Due
to a significant difference in the atomic numbers of Pt (Z=78) and Fe (Z=26), aberration-corrected HAADF-STEM can be used to further probe the crystalline structure of the ordered PtxFey/C
catalysts at the atomic level due to the very strong atomic-number 001
Figure 2 Representative HAADF-STEM images of general area for: (a) as-prepared Pt3Fe/C(800), (b) 10’000 E-cycled Pt3Fe/C(800), (c) as-prepared
Pt3Fe2/C(800), and (d) 10’000 E-cycled Pt3Fe2/C(800) catalysts.
0 5 10 15 20 25 30 0 2 4 6 8 10 12 14 16 18 20 22 24 Particle size / nm P e rc e n ta g e o f p a rt ic le s / % as-prepared 10,000-cycled a
Figure 3a Size distribution histogram of as-prepared (965 counts) and 10’000 E-cycled (795 counts) Pt3Fe/C(800).
0 5 10 15 20 25 30 35 0 2 4 6 8 10 12 14 16 18 20 Particle size / nm P e rc e n ta g e o f p a rt ic le s / % as-prepared 10,000-cycled b
Figure 3b Size distribution histogram of as-prepared (969 counts) and 10’000 E-cycled (581 counts) Pt3Fe2/C(800) catalysts. (Note: The same number of
images with the same scales was counted manually using Northern Eclipse Imaging software for the as-prepared and E-cycled samples.)
Figure 4 (001) crystal plane of (2×2×2) supercell [Pm-3m] Pt3Fe and simulated
HAADF-STEM image viewed down the [001] zone axis (a), (111) crystal plane of (2×2×2) supercell [Pm-3m] Pt3Fe and simulated HAADF-STEM image viewed
down the [111] zone axis (b), (110) crystal plane of (2×2×2) supercell [Pm-3m] Pt3Fe and simulated HAADF-STEM image viewed down the [110] zone axis (c).
(010) crystal plane of (2×2×2) supercell [P4/mmm PtFe] and simulated HAADF-STEM image viewed down the [010] zone axis (d). Platinum atoms: White balls; iron atoms: Brown balls.
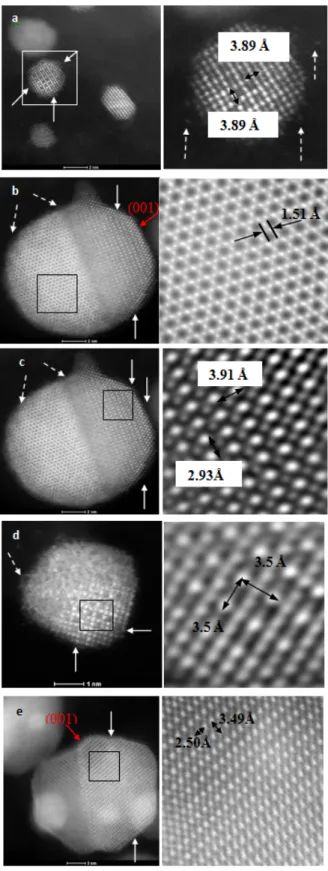
contrast. The HAADF multi-slice simulations of the above four crystal zone axes are also displayed in Fig. 4. The images show the strong intensity of the Pt atomic columns and very weak intensity arising from the Fe columns. Catalysts with highly ordered structures of [Pm-3m] and/or [P4/mmm] phases are observed experimentally with HAADF-STEM imaging. Fig. 5a shows an image for a 3 nm diameter as-prepared Pt3Fe/C(800)
catalyst particle displaying an ordered structure seen from the [001] orientation (zone axis), which matches closely with the simulated HAADF image (Fig. 4a) of the crystal structure seen from the same zone axis for a 10 nm thick slab. It should be noted that mono-atomic steps and single atoms in the vicinity of the particle can also be observed as pointed by arrows in Figs. 5a and b, respectively. Figs. 5b and c show an example of a 12 nm diameter as-prepared Pt3Fe/C(800) catalyst particle that shows a
completely ordered structure, in which two orientations are simultaneously seen (left side of the particle shows the crystal oriented down the [111] axis and the left side showing the [110] orientation. This suggests that it is possible for a single particle to be a bi-crystal. In the [111] orientation (right hand side in Fig. 5b), Pt atomic columns present a hexagonal pattern surrounding the Fe columns with much weaker intensity due to the much lower atomic number, in agreement with the HAADF-STEM image simulations shown in Fig. 4b. The presence of Fe atoms in the structure is thus confirmed by the multi-slice simulation as well as
Figure 5 Atomic resolution aberration-corrected HAADF-STEM images of selected particles from as-prepared Pt3Fe/C(800) (a,b,c), and as-prepared
Pt3Fe2/C(800) (d,e). Inserts show magnified sections for respective particles on
the left. (Magnified sections a-d are Fourier filtered to reduce measurement noises). The white solid arrows indicate the surface steps, the white dashed arrows indicate the isolated atoms, and the red solid arrows indicate the (001) facets.
EDX area scan. On the side of the particle exhibiting the [110] orientation, (right side in Fig. 5b), the brighter and darker columns in the particle correspond to the Pt and Fe atomic columns, respectively. In addition, there appears to be an absence of darker atomic columns atoms on the surface of the particles thus suggesting changes in the ordering and fewer Fe atoms. Since the HAADF imaging method does not exhibit contrast reversal with thickness changes, the experimental images suggest that the Fe atoms and ordering appear to be located 3 to 4 atomic layers below the surface, which suggests the possibility of a Pt rich surface. This may be beneficial to the catalytic activity, as suggested by other research groups.[9,20]
Fig. 5d illustrates a 3 nm as-prepared Pt3Fe2/C(800) particle
with portions of the particle aligned on the [100] zone axis. Note that the orientation for the other half of the particle cannot be determined as the particle appears oriented away from a major zone axis. Fig. 5e displays a 12 nm as-prepared Pt3Fe2/C(800)
particle exhibiting two different orientations. It is evident that the Fe and Pt atoms are highly ordered as seen in the [010] projection. Once again, the bright atomic columns indicate the presence of Pt atoms and lighter atomic columns indicate the presence of Fe atoms (or a mixture of Pt and Fe) and thus an ordered phase. There is a clear boundary at the center of the particle that separates the two differently oriented nanocrystals. Overall, it can be observed that the contrast is not uniform on the particle, this suggesting that there is possibly an overlap with smaller particles on top or bottom of the large 12 nm particle as seen on the left-hand side of the large particle and on the top-left particle shown in Fig. 5e. Worth pointing out in this series of images are the incomplete surface atomic planes (thus the presence of surface edges) and change in Fe-Pt ordering as pointed out by the arrows in Fig. 5e. Particles with ordered cubic Pt3Fe or ordered tetragonal structures were found for the
as-prepared Pt3Fe2/C(800) catalyst. These results are consistent
with the Rietveld analyses of this catalyst (see Table 1). Small particles for the as-prepared Pt3Fe2/C(800) catalyst appear to
preferably exhibit a cubic structure, while the larger particles of this catalyst dominantly seem to show a tetragonal structure. These may be due to the fact that the atomic ratios of Fe to (Pt+Fe) are close to 1/3 and 2/3 for the small and large particles, respectively. These ratios were identified by STEM-EDXS analysis.
Table 2. Summary of structure parameters of the two ordered phases
Phase type Method a/ Å b/ Å c/ Å Pm-3m (Pt3Fe) JCPDS No.(89-2050) PXRD* HAADF-STEM* 3.872 3.86(1) 3.89 3.872 3.86(1) 3.89 3.872 3.86(1) 3.89 P4/mmm (PtFe) JCPDS No. (65-1051) PXRD* HAADF-STEM* 2.721 2.73 2.5 2.721 2.73 2.5 3.700 3.75 3.49 *: Data obtained in this work.
The lattice parameters of [Pm-3m] Pt3Fe and [P4/mmm] PtFe
derived from HAADF-STEM and XRD results are summarized in Table 2. The values for bulk materials listed in the corresponding JCPDS cards are also shown in Table 2. The values from the HAADF-STEM and XRD techniques generally agree with each other as well as the values from the JCPDS cards.
Electrochemical stability and electrochemical surface area (Apt)
Mass and catalytic orr activities of the catalysts measured after 70 cleaning cycles (referred to as initial activity) are summarized in Table 3.
Table 3. Activities (orr) for Pt series catalysts before and after 3000 E-cycles
Sample APt/ m2 gPt-1 APt** / m2 gPt-1 Mass orr / A mgPt-1 Mass orr**/ A mgPt-1 Catalytic orr/ μA cmPt-2 Catalytic orr**/ μA cmPt-2 Pt/C TKK 60 23 0.11±0.01 0.065 170±2 286 Pt/C 62 32 0.11±0.01 0.085 185±17 274 Pt/C# 29 23 0.07±0.03 0.06 215±29 257 Pt3Fe/C# 42 23 0.2±0.05 0.11 509±12 473 Pt3Fe2/C# 42 26 0.23±0.05 0.13 550±50 496
*: All orr activities are measured at 0.9 V vs. RHE;
**: These APt, mass and catalytic orr data are obtained after 3000 E-cycles;
#: Samples annealed at 800 oC.
The thin layer protocol of Mayrhofer et al.[22] is followed to
carry out the orr measurements in this work. The orr activity for the Pt/C catalyst (mass activity of 0.11±0.01 A mgPt-1and catalytic
activity of 185±17 μA cm-2Pt) is comparable to the state of the art Pt/C TKK (47 wt.%) catalysts. The heat treatment of the Pt/C catalyst at 800 oC, i.e., making the Pt/C(800) catalyst results in a
1.5 times reduction of the orr mass activity, while the orr catalytic activity remains the same (within the error of the measurements). The PtxFey/C catalysts showed improved orr activities compared
to the Pt/C catalysts. The mass activities are 0.2±0.05 and 0.23±0.05 A mgPt-1 for the Pt3Fe/C(800) and Pt3Fe2/C(800)
catalysts, respectively. The Pt3Fe2/C(800) catalyst exhibit a
catalytic orr activity of 550±58 µA cmPt-2. This catalytic activity
appears higher than for the Pt3Fe/C(800) catalyst of 509±12 µA
cmPt-2. However, the measurement error of the former is large.
The catalytic orr activities of these catalysts are in good agreement with data reported in the literature for very active orr catalysts.[23,24] The orr activities are also in agreement with the
structural findings in this report that suggest that ordered alloy catalysts in combination with potentially a thin surface enriched Pt shell show improved orr activities. Furthermore, the orr activities are measured after 70 cleaning cycles are carried out for each electrode. Changes in the CV characteristics of all catalysts during the initial cycles are essentially the same; the PtxFey/C
catalysts indicate the leaching of Fe. An increase in the Hads/des
region is observed for all Pt/C and PtxFey/C catalysts. The
increase in APt is less than 30 % as a result of the initial 70 cycles
for all catalysts.
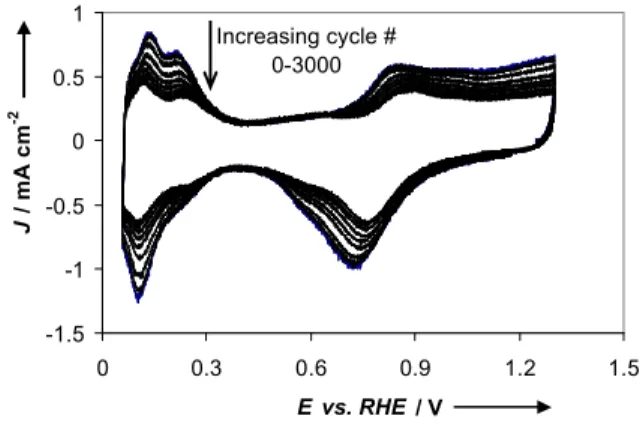
Cyclic voltammetry (CV) is a commonly used tool for assessing the durability of the catalysts outside of a FC. Fig. 6 shows a typical example of a series of CVs for the Pt/C catalysts taken over the course of 3000 cycles between 0.06 to 1.3 V at 50 mV s-1.
For all catalysts, the current in the Hads/desregion, i.e., APt, is
observed to decrease with extensive cycling. Over the course of these experiments, the CV characteristics that reflect the
presence of a hydroquinone-quinone redox couple are observed at ca. 0.62 V. It is typical that this couple evolves on carbon surfaces subjected to extensive cycling experiments, indicating
-1.5 -1 -0.5 0 0.5 1 0 0.3 0.6 0.9 1.2 1.5 E vs. RHE / V J / m A c m -2 Increasing cycle # 0-3000
Figure 6 CVs recorded at 50 mV s-1during the course of 3000 potential cycles
of the Pt/C catalyst. A catalyst loading of 20 µg Pt per cm2RDE area loadings is
used. Every 500th cycle is shown; the y-axes shows the current density (J) per geometrical RDE area.
the partial oxidation of the carbon. However, the current intensity in the double layer region does not decrease indicating that within this potential range the loss of carbon due to its complete oxidation to CO2is not significant. Fig. 7 shows plots of the APt
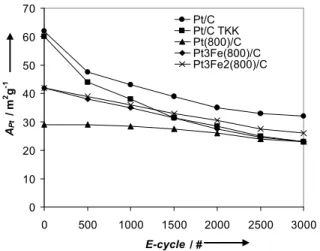
values vs. the E-cycling number for all five catalysts studied. The ratio of the APtvalue, measured for a particular E-cycling number,
over the initial APtvalue, i.e., % APtwas calculated. These % APt
values will be further used in this work in order to analyze whether there is a direct correlation between changes in APtand
changes in the particle size distribution. During the initial 1000 cycles, the loss in the % APtvalues is particularly pronounced,
namely 30-40 %, for Pt/C and Pt/C TKK, i.e., the two catalysts not subjected to the higher (800 oC) temperature annealing process.
The average particle sizes of the annealed catalysts are larger than for the Pt/C and Pt/C TKK catalysts. Therefore, these results could suggest that the larger loss in the APtvalues observed for
the un-annealed catalysts during this period results from the loss of small Pt catalyst particles through e.g., catalyst particle growth and/or Pt dissolution. Fig. 7 suggests that the overall loss in APt
increases in the following order: Pt/C(800) < Pt3Fe2/C(800) ≈
Pt3Fe/C(800) < Pt/C < Pt/C TKK. This order indicates that the
annealed catalysts exhibit a lower overall loss in APtthan the
un-annealed catalysts. In fact, the loss for the Pt/C(800) catalyst is almost minimal. Pt/C(800), Pt3Fe2/C(800) and Pt3Fe/C(800) have
almost the same average crystallite size according to the XRD results, nevertheless, the drop in % APt for Pt/C(800) is much
smaller than for the Pt3Fe2/C(800) and Pt3Fe/C(800) catalysts.
This may be simply related to the fact that the Pt/C(800) catalyst already has a low initial APtvalue, and hence, likely a larger Pt
particle size then the PtxFey/C(800) catalyst and the two
un-annealed Pt/C catalysts. A conclusion regarding the influence of Fe on the stability of these catalysts cannot be drawn. On the contrary, the results highlight the importance of also considering initial APt values and actual particle size and size distribution
when discussing stability results of Pt/C based catalysts.
Table 3 also shows the orr activities of the catalysts measured after 3000 cycles. The catalytic activities for the three Pt/C (Fe free) catalysts after 3000 cycles are between 260 and 280 μA cmPt-2. It is seen that the catalytic orr activities of these
three catalysts increases as a result of extensive E-cycling, while the mass orr activities decrease.
The increase in the catalytic orr activity could be due to an increase in the Pt particle size. For Pt/C only particles, it has been reported that larger Pt particles (> 3.5 nm) have a better catalytic orr activity than smaller Pt nano-particles.25 This is has been
0 10 20 30 40 50 60 70 0 500 1000 1500 2000 2500 3000 E-cycle / # AP t / m 2g -1 Pt/C Pt/C TKK Pt(800)/C Pt3Fe(800)/C Pt3Fe2(800)/C
Figure 7 Plot of APtvs. the E-cycling number for the five catalysts investigated in
this work.
related to a decrease in the fraction of Pt surface atoms in the (100) and (111) crystal planes for < 3.5 nm cubo-octahedral Pt particles. Both the as-prepared Pt/C and Pt/TKK catalyst have a large number of catalyst particles that are smaller than 3.5 nm that are likely to grow or be rapidly dissolved with extensive cycling.[26] After 3000 cycles, the APtvalues of the catalysts are
almost identical (within the experimental error) except for Pt/C. However, the higher mass and catalytic orr activities for the PtxFey/C catalysts over the Pt/C catalysts are retained. In fact, the
catalytic activities of the two PtxFey/C catalysts are essentially the
same and unchanged after 3000 E-cycles. This further suggests that a PtxFey/C catalysts consisting of an ordered cubic phase
and a PtxFey/C consisting of an ordered cubic phase plus a
tetragonal alloy phase can be expected to exhibit the same catalytic activity, when utilized in a FC. The influence of longer cycling tests (up to 10’000 cycles) on the APtvalues and orr data
were further studied for the case of the Pt3Fe2/C(800) catalyst, as
shown in Fig. 8 and Table 4.
Table 4. Activities (orr) for Pt3Fe2/C(800) catalyst over the course of long term
E-cycling experiments E-cycle* / no. % APt** / m2gPt-1 Mass orr (0.9 V) / A mgPt-1 Catalytic orr (0.9 V) / μA cmPt-2 0 100 0.23±0.05 550±50 3000 63 0.13±0.03 500±27 6000 50 0.11±0.03 500±30 10’000 36 n.m.# n.m.#
*: Prior to any orr and long term E-cycling tests the catalyst electrodes are conditioned carrying out 70 cycles;
**: Percentage of APt(% APt) relative to start of the long term E-cycling
experiments, i.e., cycle no. 0;
#: Quality of the orr curves after 10’000 cycles was extremely poor, and hence, not measured (n.m.).
The % APtvalues are calculated vs. the initial APtvalue measured
after the 70 cleaning cycles were completed. Theoretical % APt
changes calculated from observed changes in the histograms, as discussed later are also shown in Fig. 8. As shown in Table 4, the catalytic orr activity values are still maintained even after 6000 cycles. The amount of catalyst remaining on the electrode was too small to allow for good quality orr measurements after 8000 and more cycles. It is seen that the drop in APtvalue is substantial
with E-cycling, as a % APtvalue of 36 % is estimated after 10’000
cycles. Furthermore, E-holding experiments were carried out. The potential was hold at 1.3 V for 80 h. The APt and orr activity
values before and after the holding experiment were identical. These results indicate that E-cycling, i.e., the continuous Pt-oxide formation and its reduction to Pt metal is the major contributor to the loss in APtfor the catalysts and conditions used in this work.
Furthermore, the observed loss in the mass orr activity appears to be solely linked to the decrease in APtfor the PtxFey/C catalysts,
while catalytic activity of the PtxFey/C catalysts remain the same.
0 20 40 60 80 100 120 0 2000 4000 6000 8000 10000 12000 E-Cycles / # A P t / %
Figure 8 Plot of % APtchanges obtained experimentally (x) and calculated APt
changes (∆) from histograms vs. the E-cycling number for the Pt3Fe2/C(800)
catalyst.
XRD and SEM-EDXS studies during electroehcmical durability studies
XRD and SEM-EDXS were employed to investigate overall structural changes of the Pt3Fe2/C(800) and Pt3Fe/C(800)
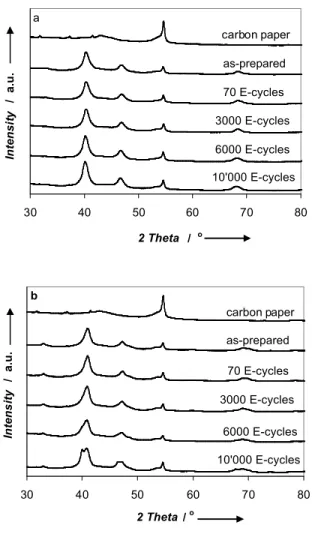
catalysts deposited on GDLs over an extended period of 10’000 cycles. The use of a GDL allows for the deposition of larger amounts of catalyst needed for the XRD measurements. Table 5 summarizes the structural parameters and Fig. 9 shows the XRD patterns of the catalysts studied on the GDLs for different cycling periods.
The structural changes observed for the two catalysts with cycling show similar trends. Extensive E-cycling is seen to shift the (111) reflection to more negative 2θ values suggesting this catalyst phase to become enriched in Pt and poorer in Fe. The Pt to Fe atomic ratios, determined by SEM-EDXS, are seen to increase with cycling, thus suggesting that Fe is gradually leached from the catalysts. Furthermore, the average crystallite size is seen to increase, although, the actual growth appears small. However, the changes of the Pt to Fe atomic ratios determined by SEM-EDXS are remarkable (see Table 5).
Table 5. Changes in the catalyst structure taking place a function of E-cycling
Sample 2θ(111)/ o Size* / nm Pt to Fe at. ratio
Pt3Fe/C(800) 40.32 6.2 2.3 ± 0.1 Pt3Fe/C(800)-70 40.31 6.5 4.8 ± 0.5 Pt3Fe/C(800)-3000 40.26 6.9 6.5 ± 0.7 Pt3Fe/C(800)-6000 40.18 7.2 7.9 ± 1 Pt3Fe/C(800)-10’000 40.14 7.3 9.1 ± 2 Pt3Fe2/C(800) 40.91 6.0 1.2 ± 0.1 Pt3Fe2/C(800)-70 40.87 6.2 2.5 ± 0.2 Pt3Fe2/(800)-3000 40.83 6.6 4 ± 0.6 Pt3Fe2/(800)-6000 40.80 6.9 4.6 ± 0.5 Pt3Fe2/(800)-10’000 39.90/40.79** 7.4 5.6 ± 1.3
The diffraction peak at 2θ: 26.54 oarising from carbon is used as internal
standard. PtxFey/C(800)-n means the PtxFey/C(800) catalysts on carbon paper
after n E-cycles;
*: Estimated using the (111) and (220) peaks and the Debye-Scherrer equation; **: A new peak develops at 2θ: 39.9o, which is attributed to Pt. The peak at 2θ:
40.79ois assigned to PtFe. 30 40 50 60 70 80 2 Theta / o In te n si ty / a. u . a carbon paper as-prepared 70 E-cycles 3000 E-cycles 6000 E-cycles 10'000 E-cycles 30 40 50 60 70 80 2 Theta / o In te n s it y / a. u . carbon paper as-prepared 70 E-cycles 3000 E-cycles 6000 E-cycles 10'000 E-cycles b
Figure 9 XRD patterns of the Pt3Fe/C(800) (a) and Pt3Fe2/C(800) (b) catalysts
on GDLs as a function of E-cycling.
It is seen that already during the first 70 cycles, both catalysts become richer in Pt. In fact, the Pt/Fe ratio increases by ca. a factor of two for both the Pt3Fe/C(800) and Pt3Fe2/C(800)
catalysts. It is likely that during the initial 70 cycles, Fe close to
the surface is easily leached, while the bulk catalyst structure is approximately maintained. The SEM-EDXS analyses indicate that Fe is continuously leached from both catalysts over the course of 10’000 cycles. After 6000 cycles, a new diffraction peak at 2θ values of 39.9o for Pt3Fe2/C(800) is observed, which can be
attributed to a pure Pt phase. The evolution of such a peak is not recognizable in the diffraction pattern for the Pt3Fe/C(800)
catalyst. After 10’000 cycles, the positions of the (111) reflection for both samples are 40.14 and 40.79o, respectively. These 2θ
maximum positions are lower than for the as-prepared catalysts indicating the gradual de-alloying due to loss of Fe. The reflections are still more positive than for pure Pt that has a 2θ maximum value of 39.77o. Furthermore, the superlattice (110)
reflection is still observed after 10’000 cycles, particularly for the Pt3Fe2/C(800) catalyst, indicating the presence of an ordered
phase even after 10’000 cycles. In summary, these results indicate the gradual loss of Fe from both catalyst particles. As a result a gradual de-alloying process takes place. However, the de-alloying process is slow, indicating that the structure causing the increased catalytic orr activity of the e.g., the Pt3Fe2/C
catalyst is maintained over the course of at least 6000 E-cycles. HAADF-STEM studies
While XRD patterns reveal average characteristics of the catalyst structures, local information is essential to understand the evolution of the catalysts. Therefore, HAADF-STEM and EDXS measurements (line scans or spot measurements at several locations) were further carried out to study the degradation behavior on the nanometer scale of individual catalyst particles. The histograms obtained from HAADF-STEM images for the two catalysts (as-prepared and after 10’000 cycles) are shown in Fig. 3. The average TEM particle sizes are 4.2 and 3.8 nm for the as-prepared Pt3Fe/C(800) and Pt3Fe2/C(800) catalysts, respectively.
After 10’000 cycles, the average catalyst particle size is larger, namely 5.1 and 4.6 nm for the Pt3Fe/C(800) and Pt3Fe2/C(800)
catalysts, respectively. The extent of overall growth is not large, which is consistent with the XRD results shown in Table 5. The HAADF-STEM analyses of both catalysts further reveals that the percentage of particles having diameters of 3 nm and less decreases, the percentage of particles with size between ca. 3 and 7 nm increases and the percentage of particles with size larger than 8 nm is essentially the same after 10’000 cycles. Growth in catalyst particle size results in a decrease in APt.
However, loss of APt due to growth in particle size does not
account for all of the loss of APt observed experimentally, as
discussed later in this work.
Fig. 10 shows high resolution HAADF-STEM images and EDXS measurements of selected particles of as-prepared catalysts and catalysts subjected to 10’000 cycles. The inserts in Fig. 10 show line scan or point measurements taken at several locations within individual particles. The summary of the Pt and Fe atomic concentration of individual particles plotted as a function of particle size obtained from EDXS measurements is shown in Fig. 11. A dependency of the Fe composition on the particle size is observed for both of the as-prepared samples. Larger particles have a higher Fe content that is essentially the same as the corresponding nominal ratio. In the case of the small (as-prepared) particles, the Fe contents are less than the nominal ratios.
Figure 10 HAADF-STEM images of selected particles from Pt3Fe/C(800) (a,c),
10’000 E-cycled Pt3Fe/(800) (b,d), Pt3Fe2/(800) (e,g), and 10’000 E-cycled
Pt3Fe2/(800) (f,h). Labeled percentages show average Pt atomic percentage of
scanned area. EDXS elemental mapping of Pt and Fe for the 10’000 E-cycled Pt3Fe2/C(800) catalyst (i). Solid arrows indicate Pt dominated particles and
dashed arrows indicate Fe segregated particles. Green is Pt mapping, red is Fe mapping.
This result is confirmed by measurements obtained with much more efficient detectors with about 10 times the collector efficiency than regular detectors, where the potential beam-induced loss can be excluded during the very short acquisition time.
It is also seen that Pt and Fe are uniformly distributed in the larger particles for both as-prepared samples (Figs. 10a, c, e and g). This is consistent with the ordered alloy structure suggested for both samples. EDXS line scans were employed to investigate the elemental distribution across the catalyst particles after 10’000 cycles. Fig. 10d shows the example of a 19 nm [Pt3Fe/C(800)] particle. The atomic ratio of Pt to Pt+Fe near the
surface is seen to be higher than in the center of the particle, suggesting the presence of a Pt-enriched shell. In case of the small (2-5 nm) particles of the cycled Pt3Fe2/C(800) catalyst (Fig.
10b), the atomic ratio of Fe to Pt+Fe is below 10 %. For particles larger than 8 nm, the Fe is also depleted to an average atomic Fe to Pt+Fe ratio of 23 ± 12 % as a result of E-cycling. The analyses of the cycled Pt3Fe2/C(800) catalyst further revealed the presence
of Fe-free, (i.e, Pt only) particles (especially small ones). In order to investigate the structure of the catalysts after 10’000 cycles, EDXS local measurements were carried out at the edges and the center of the particles for comparison.
-10 10 30 50 70 90 110 0 5 10 15 20 25 30 Particle size / nm A to m ic r a ti o / % a -10 10 30 50 70 90 110 0 5 10 15 20 25 Particle size / nm A to m ic r a ti o / % b
Figure 11 Plots of atomic composition vs. particle size for Pt3Fe/C(800) (a) and
Pt3Fe2/C(800) (b). Symbols in black are for as-prepared catalysts, while
symbols in grey are for the catalysts subjected to 10’000 E-cycles. Squares and circles represent the Pt and Fe atomic ratios, respectively.
Fig. 10h shows the example of this analysis for a ca. 15 nm sized catalyst particle. The atomic ratios of Pt to Pt+Fe are determined as 68.8 (left edge), 89.9 (right edge) and 57.8 (center
position) %. Since the particles are extremely small and the absorption can be neglected these results suggest that the surface of the large Pt3Fe2/C(800) catalyst particle consists of two
“phases”, a Pt-enriched shell and a Pt+Fe core.
These results are further confirmed by EDXS mapping of Pt and Fe shown in Fig. 10i for the case of the 10’000 cycled Pt3Fe2/C(800) catalyst. The 4th image, right hand bottom, shows
the combined colour coded maps for Pt (green) and Fe (red). Small particles are seen to mainly consist of Pt (green). All particles show an enriched Pt shell. The very large particles (> 10 nm) still consist of a mixture of Pt and Fe (red) in the core, although, the distribution of Pt and Fe is not fully uniform and regions of Fe and Pt clustering are observed. Solid and dashed arrows indicate Pt and Fe enriched regions, respectively for ca. 4-9 nm sized particles. Both pure Pt particles and a Pt-enriched shell can result in the additional reflection at 2θ values of 39.9o
observed in the X-ray diffraction patterns of the Pt3Fe2/C(800)
catalyst after 6000 cycles (discussed above and shown in Fig. 9b). Relationship between structure and stability and potential model for catalyst degradation
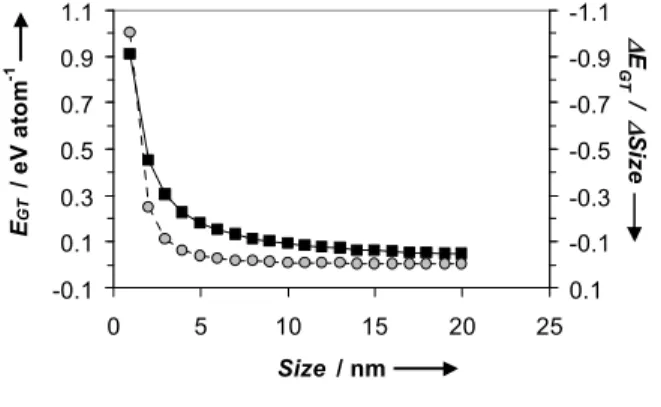
The histograms in Fig. 3 suggest that with E-cycling a larger fraction of catalyst particles between ca. 3 and 8 nm in size are formed, while the fraction of catalyst particles of less than 3 nm in size decreases with E-cycling. A potential explanation could be related to the instability of small particles (high surface area vs. total volume) described by the Gibbs-Thomson (or Kelvin) equation. This equation yields an estimate for the size dependence of particle stability, and is generally written as a shift in particle chemical potential (EGT):[27,28]
EGT= 4γΩ/d (1)
In eq. 1, d is the particle diameter, γ is the particle surface energy (Pt[111] surface energy, 2.4 × 10⁻⁴ J cm-2), and Ω is the molar
volume of the particle (Ω of Pt is 9.09 cm3mol-1). The calculated
EGT values as a function of particle size and the slope
(∆EGT/∆Size) vs. size are shown in Fig. 12.
-0.1 0.1 0.3 0.5 0.7 0.9 1.1 0 5 10 15 20 25 Size / nm E G T / e V a to m -1 -1.1 -0.9 -0.7 -0.5 -0.3 -0.1 0.1 E G T / S iz e
Figure 12 Plots of EGT(black squares) and ∆EGT/∆Size (grey circles) vs. Size.
It is assumed that the particle dissolution is proportional to exp((1-β1)EGT/kT), where β1 the transfer coefficient with a value of 0.5.
Using the latter relationship, relative dissolution rates of 800, 40, 4, 1, 0.6 for 2, 3, 5, 8 and 10 nm platinum particles, respectively are obtained. (For this calculation the relative dissolution rate of
the 8 nm particle is defined as 1.) These relative and theoretical dissolution rates show that the impact of EGT on the particle
stability becomes very important for particles of less than 8 nm in size. According to this, particles smaller than 3 nm are very unstable. These are theoretical numbers, apply to perfect spheres and do not take a potential influence of the substrate into account. Nevertheless, the results shown in Fig. 12 appear to be consistent with the observed changes in particle size distribution observed by HAADF-STEM (Fig. 3). The latter suggests that for both the Pt3Fe/C(800) and Pt3Fe2/C(800) catalysts, the fraction of
particles of less than 3 nm in size decreases, while the fraction of particles between 3 and 8 nm is higher after cycling, as is observed by the histograms Fig. 3.
The actual loss of Fe as well as Pt from the catalyst particles due to dissolution also needs to be considered. An exact number is difficult to measure and beyond the scope of this work. Changes in the histograms (Fig. 3) can be used to estimate theoretical changes in APtwith cycling. For this calculation, it is
assumed that the catalyst particles are spherical and APtvalues
are calculated using the particles size distribution shown in the histograms (Fig. 3) for the as-prepared and cycled catalysts. Assuming the spherical shape and that no catalyst is lost during the cycling experiments a theoretical drop in % APtto ca. 70 % is
calculated for both PtxFey/C catalysts. The theoretical changes
estimated from the histograms and making two assumptions (i.e., spherical particles and no loss of catalyst) are smaller than observed experimentally. The experimental data suggest a drop in % APtto 34 % over the course of 10’000 cycles. Therefore, it is
concluded that a large fraction of the % loss in the APt value
observed is due to dissolution of actual catalyst.
Conclusion
Two ordered PtxFey/C catalysts are prepared utilizing a wet
impregnation method of a Fe-nitrate precursor salt onto a performed Pt/C catalyst, and subsequent annealing in an H2
enriched atmosphere at 800 oC. Rietveld analysis suggests that
the as-prepared Pt3Fe/C catalyst is made of a single [Pm-3m]
structure phase, while the as-prepared Pt3Fe2/C catalyst consists
of a [Pm-3m] and a [P4/mmm] phase. The crystal structures of these two ordered alloy phases are also revealed by atomic resolved aberration-corrected HAADF-STEM technique. [001], [111] and [110] oriented crystalline particles for a [Pm-3m] phase are observed for the Pt3Fe/C catalyst, and the [100] oriented
nanocrystalline particles of the [Pm-3m] phase and the [010] oriented nanocrystals of the [P4/mmm] phase are observed for the Pt3Fe2/C catalysts. The lattice parameters of such two
ordered phases derived from XRD and HAADF-STEM are in general agreement. STEM-EDXS analysis reveals that the Fe content of the as-prepared catalyst particles is dependent on their size. Larger particles have a higher Fe content than small ones. Furthermore, the Fe content of the larger particles approaches the nominal catalyst composition. The Fe to Pt+Fe atomic ratio of the smaller (< 3nm) particles of the Pt3Fe2/C catalyst is 1/3 and
these particles appear to be of dominantly cubic structure, while the structure of the larger particles is tetragonal consistent with the Fe to Pt+Fe atomic ratio of 2/3. These results are in agreement with the Rietveld analysis of the XRD pattern of this catalyst that suggests the presence of a cubic [Pm-3m] and a tetragonal [P4/mmm] phase. HAADF imaging further suggests that the outer shell (a few monolayers) of the as-prepared catalysts is enriched with Pt. This is likely due to preferential surface segregation of Pt on these alloys induced by high
temperature annealing in a reducing atmosphere and may be a preferable catalyst structure [9,20].
The degradation of the two PtxFey/C catalysts appears to be
“size-dependent”. A larger fraction of ca. 3-7 nm particles are present after 10,000 E-cycles, while the fraction of the < 3nm decreases. Furthermore, Fe appears to be gradually leached from both catalysts as a result of E-cycling. After 10,000 cycles, the large particles consist of a Pt-enriched shell. Pt and Fe are found in the core, although, the Pt to Fe distribution is not entirely uniform and some regions consist of Pt and Fe clusters. Fe is almost completely depleted from the smaller (less than 3 nm) particles and in some cases Pt only particles are observed. It is concluded that these small particles are unlikely to significantly contribute to the catalytic orr activity of the catalyst, as they are essentially Pt particles. The particles larger than 10 nm in size are predicated to have a high catalytic activity, as they maintain an alloy structure even after extensive E-cycling. However, due to low catalytic surface sites to mass ratio, they are also expected to not contribute significantly to the mass orr activity of these catalysts. The presence of Pt only catalysts is consistent with the XRD pattern for the Pt3Fe2/C catalyst that show the development
of diffraction peaks typical for face centered cubic Pt. The higher catalytic orr activity of the PtxFey/C over the Pt/C catalysts is
maintained with cycling over extended periods despite the gradual loss in Fe. Therefore, the mass orr activity of the PtxFey/C
catalysts are still exceeding the activity of the cycled Pt/C catalysts after 3000 cycles. In fact, the decrease in the mass orr activity is proportional to the loss in the electrochemical surface area (APt) for the two PtxFey/C catalysts. Furthermore, the loss in
APt and mass orr activity appears to be dominated by the
continuous transition of Pt-oxide to Pt-metal and the loss of actual catalysts, e.g., by dissolution into the solution is a major contributor to the experimentally observed drop in APt for the
conditions and PtxFey/C catalysts utilized in this work.
Acknowledgment
MCYC, FN and GAB are grateful to NSERC for a Strategic Grant supporting this work. Electron Microscopy was carried out at the Canadian Centre for Electron Microscopy, a facility supported by NSERC and McMaster University. Access to the Tecnai Osiris at the Materials Technology Laboratory of Natural Resources Canada in Hamilton is gratefully acknowledged by GAB. LC, CB, PHJM and BRM gratefully acknowledged financial support from National Research Council of Canada, AFCC Automotive Fuel Cell Cooperation, Corp. and Ballard Power System.
Experimental Section
Catalysts and catalysts preparation: First Pt/C catalysts were prepared using a polyol method reported previously.[18]These Pt/C
precursor catalysts were then impregnated with Fe-salts, and subsequently annealed to form solid solutions. The Pt/C precursor powder was formed by dissolving 0.4652 g PtCl4(Alfa Aesar, 99.9%
metal basis) in 50 mL of ethylene glycol (EM Science) containing 0.15 M NaOH. The solution was stirred for 1 h at room temperature, subsequently heated under reflux at 160 oC for 3 h, and then cooled
in air. A dark brown Pt colloidal solution was formed in this manner. 1.077 g of carbon (Vulcan XC-72R, Cabot) was mixed with the dark brown Pt colloidal solution for up to 24 h. Appropriate amounts of HNO3were added to the mixture to adjust the pH value to 2 assisting
in the complete deposition of the Pt colloids onto the carbon support. The carbon-supported Pt catalyst was filtered, washed with water and ethanol, and dried in an air-oven at 80 oC. The filtrate solution was
clear indicating that all of the Pt colloids were deposited onto the carbon support, i.e., forming a 20 wt. % Pt/C catalyst.
PtxFey/C catalysts were prepared via a wet impregnation method. 500
mg of the 20 wt. % Pt/C catalysts were dispersed in 120 mL water by ultrasonication for 1.5 h. A desired amount of Fe(NO3)3·9H2O (Alfa
Aesar, 99.99 % Fe basis) and 1 mL 1 M HNO3 were added to the
suspension (0.0691 g Fe(NO3)3·9H2O for Pt3Fe/C and 0.1381g
Fe(NO3)3·9H2O for Pt3Fe2/C). After stirring for 0.5 h, the water was
evaporated at 80 oC stirring continuously. The dried samples were
ground using a glass mortar prior to annealing them at 800 oC for 3 h
in a Lindberg Blue tube furnace. A heating rate of 10 oC min-1was
used and the samples were heated, annealed and cooled under a stream of 8 % H2in Ar (BOC gas).
The as-prepared Pt/C catalyst was also annealed in the H2
atmosphere at 800 oC forming a Pt/C(800) catalyst powder. Various
electrochemical measurements for a total of five catalyst powders were carried out, as follows: Precursor Pt/C powder, Pt/C(800), Pt3Fe/C(800), Pt3Fe2/C(800) and a 46.7 wt. % Pt/C catalyst obtained
from Tanake. The latter is referred to as Pt/C TKK catalyst and the carbon support for the Pt/C TKK catalyst is Ketjenblack.
Electrochemical measurements: Catalyst layers were either prepared on rotating ring disc electrodes (RDEs) or on gas diffusion layers (GDLs). The latter were TorayTM carbon paper (EC-TP2-060, ElectroChem). For the preparation of thin catalyst layers on the RDEs, inks were formed by ultrasonically dispersing the catalysts in ethanol (95 vol. %, Anachemia) to a concentration of 2 mg catalyst powder (catalyst particles plus the carbon support) per mL for 1 h. After sonication, a desired volume of the catalyst ink was pipetted onto the glassy carbon RDE (5 mm diameter, 0.196 cm2geometrical surface
area, Pine Instrument) resulting in Pt loadings of 20 µgPt cm-2 RDE
area. After drying in air and at room temperature, 20 µL of 0.025 wt. % Nafion solution (diluted from 5 wt. % of Nafion, Ion Power, Inc.) was added and dried in air to immobilize the catalyst. The gas diffusion layer (GDL) electrodes were prepared by ultrasonically blending 25 mg of catalyst, 100 µL of 5 wt. % Nafion solution and 8 mL isopropyl alcohol for 2 h. 8 mLs’ of the catalyst inks were sprayed onto the GDL using an air brush and dried in air.
For all electrochemical measurements, three-compartment cells were used. A 0.1 M HClO4solution was used as electrolyte. Large surface
area Pt and Au gauzes were used as counter electrodes. Either a saturated calomel or a Hg/Hg2SO4 (1 M Na2SO4) electrode (MSE)
was used as reference electrode. The potential of the reference electrode was calibrated using the H2oxidation/reduction reaction on
a high surface area Pt electrode. In this work all potentials are referenced vs. the reversible H2electrode (RHE). The MSE was used
to investigate the ORR in order to avoid contamination by chloride. Prior to the standard electrochemical measurements such as cyclic voltamograms (CVs), the electrolyte was desoxygenated by bubbling Argon gas for 40 min. The working electrodes were then cycled at 50 mV s-1 between 0.06 and 1.3 V for 70 cycles. This served to clean
and condition the electrodes. Either orr measurements or long term durability tests were then carried out. The orr measurements were carried out in the O2-saturated 0.1 M HClO4solutions between 0 and
1.2 V vs. RHE. A sweep rate of 10 mV s-1was employed and most
commonly the RDE was rotated at 1600 rpm. Measurements at other rpm’s were carried out in parallel work to ensure that the Koutecky-Levich relationship applies and that a four electron reaction takes place. All electrochemical measurements were carried out at room temperature and high purity (18 MΩ) water was used. The electrochemical Pt surface area (APt) was calculated using a charge to
surface area conversion factor of 210 μC cm-2. This is the same factor
as used by other research groups.[8]This is an estimate and does not
take the possible interference of Fe into account.
Transmission electron microscopy: The catalysts were characterized by ultrahigh-resolution transmission electron microscopy to extract morphological, size and composition information. High angle annular dark-field (HAADF) imaging and energy dispersive X-ray spectroscopy (EDXS) mapping were carried out using two aberration-corrected FEI Titan 80-300 microscopes operated at 200 keV. One of the instruments (FEI Titan 80-300 Cubed) is equipped with two aberration correctors (one of the probe-forming lens and one of the imaging lens) providing ultrahigh-resolution HAADF-STEM images (better than 0.1 nm resolution) and an EDXS detector (Oxford Instruments Si-Li detector). The other instrument is equipped with an aberration-corrector of the image-forming lens and an EDXS detector (Oxford Instruments Si-Li detector). Additional chemical compositional measurements were carried with a Tecnai Osiris microscope equipped with a high-collection efficiency FEI EDXS detector (ChemiSTEM system).
X-ray diffraction: XRD patterns of various samples were recorded on a Bruker D8 Advance diffractometer with Brag-Brentano geometry using a Cu Kα source and a linear position-sensitive detector (PSD). The angle extended from 20 to 90o using a step size of 0.02o,
accumulating data for 3 s per step. Data analysis was carried out using TOPAS version 4.2 implementing the fundamental parameters approach (FPA).20 The FPA line-broadening function for linear PSD implemented in TOPAS 4.2 was used to model the instrumental lineshape in the Rietveld refinement. The specimen-dependant parameters, which were refined in the Rietveld analysis included the zero error, a user-specified number of coefficients of a Chebyshev polynomial fitting the background, and the lattice parameters. For the Pt3Fe2/C(800) sample only, site occupancies of the [P4/mmm] phase
were refined allowing site-disorder on each of the two crystallographic sites, however, constrained overall to the nominal composition. In the Rietveld refinement of each sample, an anisotropic line-broadening was needed for each individual phase present in order to fit the diffraction intensities adequately. The spherical-harmonics 6th-order anisotropic line-broadening function implemented in TOPAS 4.2 was used for this purpose. The crystallize size of each individual phase was estimated by fitting individually each diffraction line observed in the measured powder patterns with a Lorentzian broadening function. Scanning electron microscopy and energy dispersive X-ray spectroscopy (SEM-EDXS): Scanning electron microscopy (SEM, JEOL JSM-840A) was equipped with an Oxford Instruments 6560 INCAX-sight light element energy dispersive X-ray spectroscopy spectrometer. The composition of the catalysts (e.g., atomic ratio of Pt to Fe) deposited on the GDL electrodes was examined by spot technique (at least 10 spots for each sample). Analyses were taken using an accelerating voltage of 20 kV and a working distance of 15 mm.
Acknowledgements
MCYC, FN and GAB are grateful to NSERC for a Strategic Grant supporting this work. Electron Microscopy was carried out at the Canadian Centre for Electron Microscopy, a facility supported by NSERC and McMaster University. Access to the Tecnai Osiris at the Materials Technology Laboratory of Natural Resources Canada in Hamilton is gratefully acknowledged by GAB. LC, CB, PHJM and BRM gratefully acknowledged financial support from National Research Council of Canada, AFCC Automotive Fuel Cell Cooperation, Corp. and Ballard Power System.
Keywords: O2reduction catalysts • lifetime • PEMFC •
HAADF-STEM • EDX spot and line analyses
[1] R. Borup, J. Meyers, B. Pivovar, Y.S. Kim, R.Mukundan, Chem. Rev.
2007, 107, 3904-3951.
[2] V. Jalan and E.J. Taylor, Electrochem. Soc.Ext. Abst. 1983, 1, 1072-1073.
[3] S. Mukerjee, S. Srinivasan, M.P. Soriaga, J. McBreen, J. Phys. Chem.
1995, 99, 4577-4589.
[4] T. Toda, H. Igarashi, H. Uchida, M. Watanabe, J. Electrochem. Soc.
1999, 146, 3750-3756.
[5] L. Xiong and A. Manthiram, J. Electrochem. Soc. 2005, 152, A697-A703. [6] J. Greeley, I.E.L. Stephens, A.S. Bondarenko, T.P. Johansson, H.A.
Hansen, T.F. Jaramillo, J. Rossmeis, I. Chorkendorff, J.K. Nørskov, Nat.
Chem. 2009, 1, 552-x.
[7] S. Chen, W. Sheng, N. Yabuuchi, P.J. Ferreira, L.F. Allard, Y. Shao-Horn, J. Phys. Chem. C 2009, 113, 1109-x.
[8] H. Schulenburg, E. Muller, G. Khelashvili, T. Roser, H. Bonnemann, A. Wokaun, G.G. Scherer, J. Phys. Chem. 2009, 113, 4069-x.
[9] V.R. Stamenkovic, B.S. Mun, M. Arenz, K.J.J. Mayrhofer, C.A. Lucas, G.F. Wang, P.N. Ross, N.M. Markovic, Nat. Mater. 2007, 6, 241-x. [10] S. Koh, P. Strasser, J. Am. Chem. Soc. 2007, 129, 12624-12625. [11] R. Srivastava, P. Mani, N. Hahn, P. Strasser, Angew. Chem. Int. Ed.
2007, 46, 8988-8991.
[12] L.M. Roen, C. H. Paik,T.D. Jarvic, J. Electrochem. and Solid-State Let.,
2004, 7, A19-A22.
[13] S.C. Ball, S.L. Hudson, B.R.C. Theobald, D. Thompsett, ECS Trans,
2007, 11, 1267-1278.
[14] X. Wang, R. Kumar, D.J. Myers, Electrochem. Solid-State Let. 2006, 9, A225-A331.
[15] W. Bi, T.F. Fuller, J. Electrochem. Soc. 2008, 155, B215-B221. [16] F. Ettingshausen, J. Kleemann, M. Michela, M. Quintus, H. Fuessa, C.
Roth, C. J. Power Sources 2009, 194, 899-907.
[17] S. Chen, H.A. Gasteiger, K. Hayakawa, T. Tada and Y. Shao-Horn, J.
Electrochem. Soc. 2010, 157, A82-x.
[18] C. Bock, C. Paquet, M. Couillard, G.A. Botton, B.R. MacDougall, J. Am.
Chem. Soc. 2004, 126, 8028-8037.
[19] R. W. Cheary, A. Coelho, J. Appl. Cryst. 1992, 25, 109-121.
[20] S. Chen, W. Sheng, N. Yabuuchi, P.J. Ferreira, L.F. Allard, Y. Shao-Horn, J. Phys. Chem., 2009, 113, 1109-1125.
[21] K.J.J. Mayrhofer, D. Strmcnik, B.B. Blizanac, V. Stamenkovic, M. Arenz, N.M. Markovic, Electrochim. Acta, 2008, 53, 3181-3188.
[22] S. Koh, N. Hahn, C. Yu, P. Strasser, J. Electrochem. Soc. 2008, 155, B1281-B1288.
[23] P. Mani, R. Srivastavaa, P. Strasser, J. Power Sources 2011, 196, 666-673.
[24] A. Kinoshita, J. Electrochem. Soc. 1990, 137, 845-848.
[25] L. Chen, C. Bock, P.H.J. Mercier, B.R., MacDougall, Electrochim. Acta
2012, 77, 212-224.
[26] C.T. Campbell, S.C. Parker, D.E. Starr, Science 2002, 298, 811-814. [27] E.F. Holby, W. Sheng, Y. Shao-Horn and D.Morgan, Energy Environ. Sci.
2009, 2, 865-x.
Received: ((will be filled in by the editorial staff)) Published online:((will be filled in by the editorial staff))
Entry for the Table of Contents (Please choose one layout only)
Layout 1:
FULL PAPER
Text for Table of Contents.
Christina Bock*, Mickey C.Y. Chan, Feihong Nan, Liang Chen, Gianluigi A. Botton, Patrick H.J. Mercier, Barry R. MacDougall
Page No. – Page No.
Compositional and Morphological Changes for Ordered PtxFey/C O2
![Figure 1a XRD patterns of Pt x Fe y /C series catalysts. Figure 1b Stick XRD patterns of cubic Pt [Fm-3m], ordered cubic Pt 3 Fe [Pm-3m], ordered tetragonal PtFe [P4/mmm] and cubic Fe [Fm-3m]](https://thumb-eu.123doks.com/thumbv2/123doknet/14111714.466676/3.918.112.351.642.1020/figure-patterns-catalysts-figure-patterns-ordered-ordered-tetragonal.webp)