arXiv:1108.0292v1 [astro-ph.HE] 1 Aug 2011
S. Adri´an-Mart´ınez1, J.A. Aguilar2, I. Al Samarai3, A. Albert4, M. Andr´e5, M. Anghinolfi6, G. Anton7, S. Anvar8, M. Ardid1, A.C. Assis Jesus9, T. Astraatmadja9,a, J-J. Aubert3,
B. Baret10, S. Basa11, V. Bertin3, S. Biagi12,13, A. Bigi14, C. Bigongiari2, C. Bogazzi9, M. Bou-Cabo1, B. Bouhou10, M.C. Bouwhuis9, J. Brunner3,b, J. Busto3, F. Camarena1,
A. Capone15,16, C. Cˆarloganu17, G. Carminati12,13,c, J. Carr3, S. Cecchini12, Z. Charif3, Ph. Charvis18, T. Chiarusi12, M. Circella19, R. Coniglione21, H. Costantini6,3, P. Coyle3,
C. Curtil3, M.P. Decowski9, I. Dekeyser20, A. Deschamps18, C. Distefano21, C. Donzaud10,22, D. Dornic2, Q. Dorosti23, D. Drouhin4, T. Eberl7, U. Emanuele2, A. Enzenh¨ofer7, J-P. Ernenwein3, S. Escoffier3, P. Fermani15,16, M. Ferri1, V. Flaminio14,24, F. Folger7, U. Fritsch7, J-L. Fuda20, S. Galat`a3, P. Gay17, G. Giacomelli12,13, V. Giordano21,
J.P. G´omez-Gonz´alez2, K. Graf7, G. Guillard17, G. Halladjian3, G. Hallewell3, H. van Haren25, J. Hartman9, A.J. Heijboer9, Y. Hello18, J.J. Hern´andez-Rey2, B. Herold7,
J. H¨oßl7, C.C. Hsu9, M. de Jong9,a, M. Kadler26, O. Kalekin7, A. Kappes7, U. Katz7, O. Kavatsyuk23, P. Kooijman9,27,28, C. Kopper9,7, A. Kouchner10, I. Kreykenbohm26, V. Kulikovskiy29,6, R. Lahmann7, P. Lamare8, G. Larosa1, D. Lattuada21, D. Lef`evre20,
G. Lim9,28, D. Lo Presti30,31, H. Loehner23, S. Loucatos32, S. Mangano2, M. Marcelin11, A. Margiotta12,13, J.A. Mart´ınez-Mora1, A. Meli7, T. Montaruli19,33, L. Moscoso10,32,d, H. Motz7, M. Neff7, E. Nezri11, D. Palioselitis9, G.E. P˘av˘ala¸s34, K. Payet32, P. Payre3,d,
J. Petrovic9, P. Piattelli21, N. Picot-Clemente3, V. Popa34, T. Pradier35, E. Presani9, C. Racca4, C. Reed9, C. Richardt7, R. Richter7, C. Rivi`ere3, A. Robert20, K. Roensch7,
A. Rostovtsev36, J. Ruiz-Rivas2, M. Rujoiu34, G.V. Russo30,31, F. Salesa2,
D.F.E. Samtleben9, P. Sapienza21, F. Sch¨ock7, J-P. Schuller32, F. Sch¨ussler32, T. Seitz 7, R. Shanidze7, F. Simeone15,16, A. Spies7, M. Spurio12,13, J.J.M. Steijger9, Th. Stolarczyk32, A. S´anchez-Losa2, M. Taiuti6,37, C. Tamburini20, S. Toscano2, B. Vallage32, V. Van Elewyck
10, G. Vannoni32, M. Vecchi3, P. Vernin32, S. Wagner7, G. Wijnker9, J. Wilms26, E. de Wolf9,28, H. Yepes2, D. Zaborov36, J.D. Zornoza2, J. Z´u˜niga2
1
Institut d’Investigaci´o per a la Gesti´o Integrada de les Zones Costaneres (IGIC) - Universitat Polit`ecnica de Val`encia. C/ Paranimf 1 , 46730 Gandia, Spain.
2
IFIC - Instituto de F´ısica Corpuscular, Edificios Investigaci´on de Paterna, CSIC - Universitat de Val`encia, Apdo. de Correos 22085, 46071 Valencia, Spain
3CPPM, Aix-Marseille Universit´e, CNRS/IN2P3, Marseille, France 4
GRPHE - Institut universitaire de technologie de Colmar, 34 rue du Grillenbreit BP 50568 - 68008 Colmar, France
5Technical University of Catalonia, Laboratory of Applied Bioacoustics, Rambla Exposici´o, 08800
Vi-lanova i la Geltr´u, Barcelona, Spain
6
INFN - Sezione di Genova, Via Dodecaneso 33, 16146 Genova, Italy
7
Friedrich-Alexander-Universit¨at Erlangen-N¨urnberg, Erlangen Centre for Astroparticle Physics, Erwin-Rommel-Str. 1, 91058 Erlangen, Germany
8
Direction des Sciences de la Mati`ere Institut de recherche sur les lois fondamentales de l’Univers -Service d’Electronique des D´etecteurs et d’Informatique, CEA Saclay, 91191 Gif-sur-Yvette Cedex, France
9
Nikhef, Science Park, Amsterdam, The Netherlands
10
APC - Laboratoire AstroParticule et Cosmologie, UMR 7164 (CNRS, Universit´e Paris 7 Diderot, CEA, Observatoire de Paris) 10, rue Alice Domon et L´eonie Duquet 75205 Paris Cedex 13, France
11
LAM - Laboratoire d’Astrophysique de Marseille, Pˆole de l’´Etoile Site de Chˆateau-Gombert, rue Fr´ed´eric Joliot-Curie 38, 13388 Marseille Cedex 13, France
12
INFN - Sezione di Bologna, Viale C. Berti-Pichat 6/2, 40127 Bologna, Italy
13
Dipartimento di Fisica dell’Universit`a, Viale Berti Pichat 6/2, 40127 Bologna, Italy
14
INFN - Sezione di Pisa, Largo B. Pontecorvo 3, 56127 Pisa, Italy
15
INFN -Sezione di Roma, P.le Aldo Moro 2, 00185 Roma, Italy
16
Dipartimento di Fisica dell’Universit`a La Sapienza, P.le Aldo Moro 2, 00185 Roma, Italy
17
Clermont Universit´e, Universit´e Blaise Pascal, CNRS/IN2P3, Laboratoire de Physique Corpusculaire, BP 10448, 63000 Clermont-Ferrand, France
18
G´eoazur - Universit´e de Nice Sophia-Antipolis, CNRS/INSU, IRD, Observatoire de la Cˆote d’Azur and Universit´e Pierre et Marie Curie, BP 48, 06235 Villefranche-sur-mer, France
19
INFN - Sezione di Bari, Via E. Orabona 4, 70126 Bari, Italy
20
COM - Centre d’Oc´eanologie de Marseille, CNRS/INSU et Universit´e de la M´editerran´ee, 163 Avenue de Luminy, Case 901, 13288 Marseille Cedex 9, France
21INFN - Laboratori Nazionali del Sud (LNS), Via S. Sofia 62, 95123 Catania, Italy 22Univ Paris-Sud , 91405 Orsay Cedex, France
23
ABSTRACT
Results are presented of a search for cosmic sources of high energy neutrinos with the ANTARES neutrino telescope. The data were collected during 2007 and 2008 using detector configurations containing between 5 and 12 detection lines. The integrated live time of the analyzed data is 304 days. Muon tracks are reconstructed using a likelihood-based algorithm. Studies of the detector timing indicate a median angular resolution of 0.5 ± 0.1 degrees. The neutrino flux sensitivity is 7.5 × 10⁻⁸ (E
ν/GeV)−2 GeV−1 s−1 cm−2 for the part of the sky
The Netherlands
24
Dipartimento di Fisica dell’Universit`a, Largo B. Pontecorvo 3, 56127 Pisa, Italy
25
Royal Netherlands Institute for Sea Research (NIOZ), Landsdiep 4,1797 SZ ’t Horntje (Texel), The Netherlands
26
Dr. Remeis-Sternwarte and ECAP, Universit¨at Erlangen-N¨urnberg, Sternwartstr. 7, 96049 Bamberg, Germany
27Universiteit Utrecht, Faculteit Betawetenschappen, Princetonplein 5, 3584 CC Utrecht, The Netherlands 28
Universiteit van Amsterdam, Instituut voor Hoge-Energie Fysika, Science Park 105, 1098 XG Amster-dam, The Netherlands
29Moscow State University,Skobeltsyn Institute of Nuclear Physics,Leninskie gory, 119991 Moscow, Russia 30
INFN - Sezione di Catania, Viale Andrea Doria 6, 95125 Catania, Italy
31
Dipartimento di Fisica ed Astronomia dell’Universit`a, Viale Andrea Doria 6, 95125 Catania, Italy
32
Direction des Sciences de la Mati`ere Institut de recherche sur les lois fondamentales de l’Univers -Service de Physique des Particules, CEA Saclay, 91191 Gif-sur-Yvette Cedex, France
33University of Wisconsin - Madison, 53715, WI, USA
34Institute for Space Sciences, R-77125 Bucharest, M˘agurele, Romania 35
IPHC-Institut Pluridisciplinaire Hubert Curien - Universit´e de Strasbourg et CNRS/IN2P3 23 rue du Loess, BP 28, 67037 Strasbourg Cedex 2, France
36ITEP - Institute for Theoretical and Experimental Physics, B. Cheremushkinskaya 25, 117218 Moscow,
Russia
37Dipartimento di Fisica dell’Universit`a, Via Dodecaneso 33, 16146 Genova, Italy a Also at University of Leiden, the Netherlands
bOn leave at DESY, Platanenallee 6, D-15738 Zeuthen, Germany c Now at University of California - Irvine, 92697, CA, USA d
that is always visible (δ < −48 degrees), which is better than limits obtained by previous experiments. No cosmic neutrino sources have been observed.
Subject headings: astroparticle physics; cosmic rays; neutrinos
We dedicate this paper to the memory of our colleague and friend Luciano Moscoso, who passed away during the preparation of this paper.
1. Introduction
High energy cosmic rays permeate the universe, but their origins remain uncertain. Many types of acceleration sites have been suggested, such as supernova remnants, micro-quasars and active galactic nuclei (see e.g. Becker (2008) for a review). If such objects are sources of cosmic rays, high energy neutrinos may also be produced. These may be detected as a diffuse flux (Aguilar et al. 2011a), but the observation of point-like sources of cosmic neutrinos would offer a unique opportunity to identify and study the sites and mechanisms of cosmic ray acceleration.
In this paper, results are presented of a search for cosmic point-like sources of high energy muon neutrinos performed with the first data taken by the ANTARES telescope. Located in the Mediterranean Sea, the ANTARES experiment is predominantly sensitive to neutrinos from the southern hemisphere in the TeV to PeV energy range. In particular, this allows the study of Galactic sources and complements the IceCube observatory, which primarily explores the northern hemisphere.
2. Data Collection
The detection principle relies on measuring Cherenkov light emitted by high energy charged particles that result from neutrino interactions inside or near the instrumented vol-ume. In particular, charged current interactions of muon-neutrinos produce high energy muons. The muon direction closely follows that of the neutrino and can often be recon-structed with sub-degree accuracy. The large background from downgoing muons due to cosmic ray interactions in the atmosphere is reduced by selecting only upgoing muons as neutrino candidates.
The Cherenkov light is detected by an array of photomultiplier tubes, each housed in a pressure resistant glass sphere called an Optical Module (OM) (Amram et al. 2002). The OMs are placed in storeys of triplets along vertical detector lines, which are anchored to the sea bed at a depth of 2475 meters with a spacing of approximately 60 meters. Each of the 12 detector lines contains up to 25 storeys, separated by 14.5 meters.
The arrival time and charge of the photomultiplier signals are digitized (Aguilar et al. 2010) into ‘hits’ and transmitted to shore. An online filter identifies events containing muons within the data stream that otherwise consists of optical backgrounds due to natural radioac-tive decays and bioluminescence. The selected events are stored for offline reconstruction. A detailed description of the detector, the data acquisition and the online filtering algorithms is given in Ageron et al. (2011); Aguilar et al. (2007).
2.1. Data Taking and Processing
The data presented here were collected between January 31st, 2007 and December 30th 2008. During this time, the construction of the ANTARES detector was still in progress. The detector consisted of 5 lines for most of 2007 and of 9, 10 and 12 detector lines during 2008. The total live time of the data used for the analysis is 304 days.( 144, 38, 48 and 74 days with 5, 9, 10 and 12 detector lines respectively).
The online event selection identifies triplets of OMs that detect multiple photons, either as a high-charge hit, or as hits separated by less than 20 ns on adjacent OMs. At least 4 of such triplets are required throughout the detector, with the relative photon arrival times being compatible with the hypothesis of the light being emitted along the track of a relativistic particle.
The arrival times of the hits are calibrated as described in Aguilar et al. (2011b). The inter-line timing has been measured in an iterative procedure by comparing the expected hit times to those measured in a large sample of reconstructed downgoing muons. In addition, a similar, independent measurement has been done using light from the optical beacon system, with compatible results. The positions and orientations of the OMs vary because of the sea currents. An acoustic positioning system, combined with compasses and tiltmeters located along the detector lines, measures the positions and orientations of the OMs, with an accuracy of ∼10 cm.
2.2. Event Reconstruction and Selection
From the timing and position information of the hits, muon tracks are reconstructed using a multi-stage fitting procedure, based on Heijboer (2004). The initial fitting stages provide the hit selection and starting point for the final fit. The final stage consists of a maximum likelihood fit of the observed hit times and includes the contribution of optical background hits. In order to maximize the robustness against inaccuracies in the simulation of the optical background, the charge information of the hits is not used in the present analysis.
Neutrino candidates are selected from upgoing events using criteria that have been determined in a ’blind’ manner; i.e. before performing the search analysis on the data. The criteria are chosen to optimize the sensitivity, which is defined as the expected median value of the upper limit on the neutrino flux. The angular uncertainty obtained from the muon track fit is required to be smaller than 1 degree. Tracks are also required to have a good reconstruction quality. The latter is quantified by a parameter Λ, which is based on the value of the likelihood function obtained for the fitted muon (see Heijboer (2004) for details). The cumulative distribution of Λ for muons which are reconstructed as upgoing is shown in Figure 1 along with the simulated contributions from atmospheric muons and neutrinos. The simulation uses the ‘Bartol’ model (Agrawal et al. 1996) for the atmospheric neutrino flux. The atmospheric muons are simulated by the QGSJET (Kalmykov & Ostapchenko 1993) and CORSIKA (Heck et al. 1998) packages with the primary cosmic ray flux from Nikolsky et al. (1984).
The final sample of neutrino candidates consists of 2190 upgoing events with Λ > −5.4 and an angular uncertainty < 1 degree, which were selected out of a total of ∼ 100 million (down going) reconstructed muons. The simulation indicates that the selected sample con-tains about 60% atmospheric neutrinos; the rest are mis-reconstructed atmospheric muons. The agreement between data and simulation in the selected sample is well within the ∼30% systematic uncertainty on the neutrino flux (Barr et al. 2006).
3. Detector Performance
The angular resolution and effective area of the detector for neutrinos passing the selec-tion cuts have been determined using simulaselec-tions and are shown in Figure 2. The simulaselec-tions include the stochastic energy loss of muons via electromagnetic shower production, the prop-agation of Cherenkov photons through sea water and a detailed simulation of the detector electronics.
3.1. Angular Resolution
The cumulative distribution of the angle between the reconstructed muon direction and the neutrino direction is shown in Figure 2 (left panel) for neutrino events with a neutrino spectrum proportional to E−2
ν , where Eν is the neutrino energy. The median of this angular error is 0.5 ± 0.1 degrees. For the subset of data in which the full 12-line detector was operational, the resolution is estimated to be 0.4 ± 0.1 degrees.
The systematic uncertainty on this quantity has been estimated by varying the time resolution of the OMs ∆t in the simulation. The allowed range of ∆t is determined by requiring that the Λ distribution in the resulting simulation be compatible with the observed atmospheric neutrino events. The best agreement between data and simulation is obtained for ∆t= 2.5 ns. Hence, this value is used for all simulations in this analysis, in particular for extracting the central value of the allowed range of angular resolutions. A time resolution of 3.4 ns is found to be incompatible with the neutrino flux model at the 2σ level, where the uncertainty is taken from Barr et al. (2006). This places an upper bound on the time resolution, which translates into a 1 σ systematic uncertainty on angular resolution of 0.1 degrees. This uncertainty incorporates, to first order, all effects which have a net result of degrading the time resolution, such as possible mis-alignments and inaccuracies in the simulation of light propagation in the water or the transit time distribution of the PMT. A similar analysis with analogous results has been performed using downgoing muon data instead of upgoing neutrino candidates.
The absolute orientation of the detector is known with an accuracy of about 0.1 degrees (Halladjian 2010); this uncertainty is taken into account as an independent effect.
3.2. Acceptance The effective area for muon neutrinos Aeff
ν is defined as the ratio between the selected neutrino event rate and the cosmic neutrino flux. It is determined from simulations and is shown in Figure 2 (right panel) as a function of the neutrino energy for three declination intervals. Throughout this paper, the cosmic neutrino flux is assumed to consist of an equal amount of νµ and ¯νµ.
In the search, limits are set on the constant φ in the flux parametrization dN/dEν = φ × [Eν/GeV]−2 GeV−1cm−2s−1. The acceptance A for such a flux is defined as the constant of proportionality between the number of selected signal events and the flux intensity φ. It can be computed by convoluting Aeffν (E) with dN/dEν(E). For declinations δ < −48 degrees, A and Aeff
-7 -6.5 -6 -5.5 -5 -4.5 -4 -3.5 -3
cumulative number of events
1 10 2 10 3 10 4 10 5 10 6 10 Λ quality variable -7 -6.5 -6 -5.5 -5 -4.5 -4 -3.5 -3 ratio 0 0.5 1 1.5
Fig. 1.— Cumulative distribution of the reconstruction quality variable, Λ, for upgoing events in data (black points) which have an error estimate < 1 degree. The Monte Carlo simulated contributions from mis-reconstructed atmospheric muons (dashed blue line) and atmospheric neutrinos (solid red line) are also shown. The bottom panel shows the ratio between data and simulation. The vertical line indicates the analysis cut Λ > −5.4.
decrease because of the requirement that the tracks are upgoing. For a source declination of -90 (0) degrees, A = 3.2 (1.8) ×107 GeV cm2 s. This means a total of 3.2(1.8) neutrinos would be detected and selected from a point source with a flux of 10−7 GeV−1cm−2s−1. For this flux model, the energy of 80% of the selected signal is in the range 3 < Eν < 700 TeV.
To constrain the systematic uncertainty on the acceptance, the atmospheric neutrino data have been compared to a simulation in which the efficiency of each OM is reduced. The maximal reduction for which data and simulation are still compatible corresponds to a 15% reduction in the acceptance for signal neutrinos with an E−2
ν spectral shape. Hence, a 15% systematic uncertainty on the acceptance is used in the limit calculations.
cumulative distribution angle (degrees) -2 10 10-1 1 10 102 0 0.2 0.4 0.6 0.8 1 2 ) (m eff A -5 10 -4 10 -3 10 -2 10 -1 10 1 10 (GeV) ν E 2 10 103 104 105 106 107 o < -45 δ < o -90 o < 0 δ < o -45 o < 45 δ < o 0
Fig. 2.— Performance of the detector for the selected signal events as determined from sim-ulation. The cumulative distribution of the angle between the reconstructed muon direction and the true neutrino direction is shown for selected signal events with an E−2
ν spectrum (left panel). The neutrino effective area Aeff
ν , averaged over three declination ranges, is shown as a function of the neutrino energy (right panel).
4. Search Method
Two distinct approaches to look for point-like neutrino sources have been used. In the full sky search, a search is made for an excess of events over the atmospheric neutrino background anywhere in the field of view. In addition, a candidate list search is made, where the presence of a signal is tested at the locations of 24 known pre-defined high energy gamma
ray sources which could be expected to emit neutrinos. They include supernova remnants, microquasars and BL Lac objects. While more restrictive in scope, the candidate list search requires less signal to reach a significant excess, compared to the all-sky search. The addition of the candidate search may therefore be thought of as a way to give extra a-priori weight to the preselected sources.
4.1. Event Likelihood
The search method is based on the likelihood of observing the events, which is defined as:
log Ls+b= X
i
log[µsig× F(βi(δs, αs)) + B(δi)] − µsig−Nbg (1) where the sum is over the neutrino candidate events, and F is a parametrization of the point spread function. This is defined as the probability density to find the reconstructed muon i an angle β away from the declination δs, and right ascension αs of the source; it is closely related to the angular resolution (see Figure 2). B(δ) is a smooth parametrization of the background rate derived from the observed declination distribution of the 2190 selected events. The mean number of selected signal events produced by the source is µsig. The term Nbg represents the total number of expected background events, which is constant and therefore does not influence the maximum likelihood fits or the likelihood ratio.
In the candidate list search, the likelihood is maximized for each candidate by numer-ically fitting the source intensity µsig to the events located within 20 degrees of the source, with the source coordinates fixed to the known position. In the full sky search, potentially significant clusters are first identified using a loose cone selection, which requires at least 4 events in a cone of 3 degrees diameter. For each cluster, the likelihood is maximized by fitting the source coordinates and the intensity, yielding maximum-likelihood estimates for these quantities.
The next step is to compute the test statistic, which is defined as the logarithm of the likelihood ratio:
Q = log Lmaxs+b −log Lb, (2)
where Lmax
s+b is the maximum value of the likelihood found in the fit and Lb is the likelihood computed for the background-only hypothesis (µsig= 0). A large (small) value of Q indicates that the data are compatible with the signal (background).
4.2. Statistical Interpretation
The statistical interpretation of the search result relies on simulated pseudo-experiments in which the background events are randomly generated by sampling the declination from the parametrization B and the right ascension from a uniform distribution. Events from a neutrino point source are simulated by adding events around the desired coordinates accord-ing to the point spread function. The systematic uncertainties on the angular resolution and orientation of the detector are incorporated by varying the simulated characteristics of the signal events within the assigned uncertainties.
Distributions of Q are obtained from the simulated experiments by applying the search method to each of them. Significances in the form of p-values are derived from the Q distribution for background-only pseudo-experiments. The distributions including simu-lated signal events are used to set flux limits following the Feldman-Cousins prescription (Feldman & Cousins 1998). The uncertainty in the acceptance A is accounted for in the limits by numerically integrating over the allowed range defined by the ±15% uncertainty.
5. Results
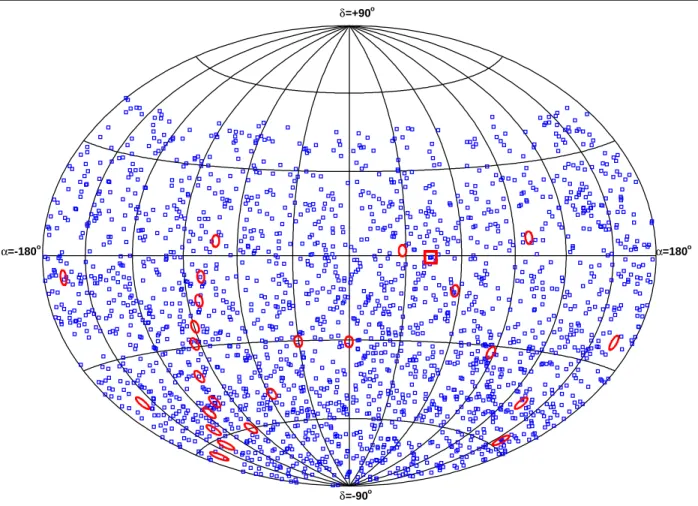
Figure 3 shows a sky map of the selected events in equatorial coordinates along with the locations of sources from the candidate list (circles) and of the most significant cluster found in the full-sky search (square).
In the full-sky search, no significant clusters of neutrino candidates have been found. The most signal-like cluster of events has a maximum likelihood estimate of the source position (αs, δs) = (43.21◦, −0.50◦). The fit assigns 3.4 events as signal events and finds a value of the test statistic Q = 6.8. Such a value, or larger (more signal like), occurs with a probability p = 88% anywhere in the field of view amongst background only pseudo-experiments. The result is thus compatible with the background only hypothesis.
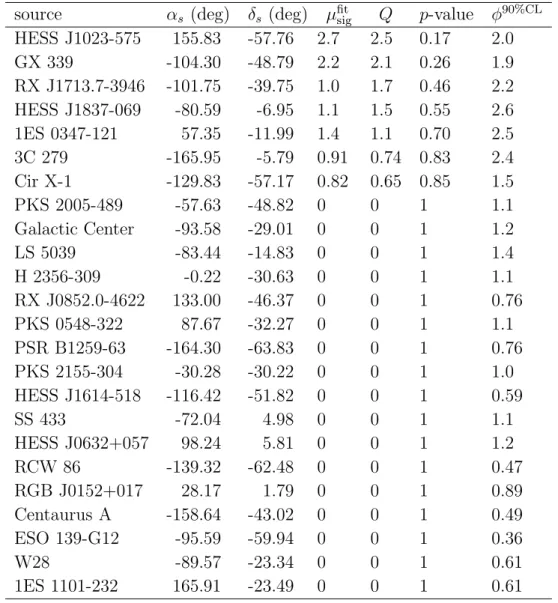
The results of the candidate list search are shown in Table 1. None of the candidate sources have a significant excess of events at their location. The most signal-like source candidate is HESS J1023-575, where 3(5) events are within 1(3) degrees of its position. For this cluster of events, Q = 2.5. In the absence of signal such a value or larger, has a probability of p = 17% to occur amongst the 24 source candidates.
o =-180 α o =180 α o =-90 δ o =+90 δ
Fig. 3.— Map in equatorial coordinates of the 2190 selected neutrino candidates. The position of the most significant cluster (see text) is indicated by the square. The circles denote the positions of the 24 sources from the candidate list.
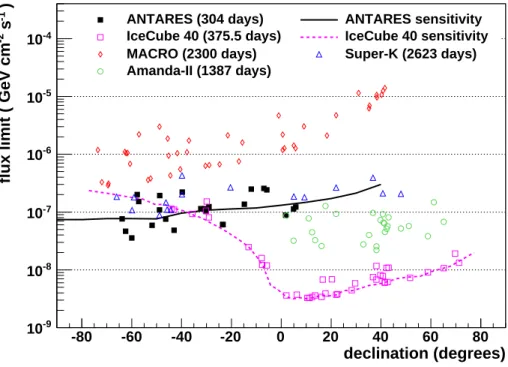
5.1. Neutrino Flux Upper Limits
As no significant point sources are observed, 90% confidence level limits are obtained for the intensity, φ90%CL, of an E−2
ν neutrino flux from each of the source candidates. They are listed in Table 1 and are shown in Figure 4 as a function of the source declination. Figure 4 also shows the sensitivity of this analysis, defined as the median value of the expected limit. It is in agreement with the median value of the actually observed limits. For the area of the sky that is always visible, the (δ < −48 degrees) sensitivity is about 7.5 × 10⁻⁸ (E ν/GeV)−2 GeV−1 s−1 cm−2. declination (degrees) -80 -60 -40 -20 0 20 40 60 80 ) -1 s -2
flux limit ( GeV cm
-9 10 -8 10 -7 10 -6 10 -5 10 -4 10
ANTARES (304 days) ANTARES sensitivity
IceCube 40 (375.5 days) IceCube 40 sensitivity
MACRO (2300 days) Super-K (2623 days)
Amanda-II (1387 days)
ANTARES (304 days) ANTARES sensitivity
IceCube 40 (375.5 days) IceCube 40 sensitivity
MACRO (2300 days) Super-K (2623 days)
Amanda-II (1387 days)
ANTARES (304 days) ANTARES sensitivity
IceCube 40 (375.5 days) IceCube 40 sensitivity
MACRO (2300 days) Super-K (2623 days)
Amanda-II (1387 days)
ANTARES (304 days) ANTARES sensitivity
IceCube 40 (375.5 days) IceCube 40 sensitivity
MACRO (2300 days) Super-K (2623 days)
Amanda-II (1387 days)
Fig. 4.— Limits set on the normalization φ of an E−2
ν spectrum of high energy neutri-nos from selected candidates (see Table 1). The points show the 90% C.L. limit at the declination of the candidate source. In addition to the present result, several previously published limits on sources in both the southern and northern hemisphere are shown from Ambrosio et al. (2001); Thrane et al. (2009); Abbasi et al. (2009) and Abbasi et al. (2011). Also shown are sensitivities (solid and dashed lines) for the current analysis and for the search from Abbasi et al. (2011) (see Abbasi et al. (2009); Thrane et al. (2009) for the sensitivities corresponding to those searches).
The present limits are more stringent than those obtained for the northern hemisphere by previous multi year experiments (also indicated in the figure) and are competitive with
source αs (deg) δs (deg) µfitsig Q p-value φ90%CL HESS J1023-575 155.83 -57.76 2.7 2.5 0.17 2.0 GX 339 -104.30 -48.79 2.2 2.1 0.26 1.9 RX J1713.7-3946 -101.75 -39.75 1.0 1.7 0.46 2.2 HESS J1837-069 -80.59 -6.95 1.1 1.5 0.55 2.6 1ES 0347-121 57.35 -11.99 1.4 1.1 0.70 2.5 3C 279 -165.95 -5.79 0.91 0.74 0.83 2.4 Cir X-1 -129.83 -57.17 0.82 0.65 0.85 1.5 PKS 2005-489 -57.63 -48.82 0 0 1 1.1 Galactic Center -93.58 -29.01 0 0 1 1.2 LS 5039 -83.44 -14.83 0 0 1 1.4 H 2356-309 -0.22 -30.63 0 0 1 1.1 RX J0852.0-4622 133.00 -46.37 0 0 1 0.76 PKS 0548-322 87.67 -32.27 0 0 1 1.1 PSR B1259-63 -164.30 -63.83 0 0 1 0.76 PKS 2155-304 -30.28 -30.22 0 0 1 1.0 HESS J1614-518 -116.42 -51.82 0 0 1 0.59 SS 433 -72.04 4.98 0 0 1 1.1 HESS J0632+057 98.24 5.81 0 0 1 1.2 RCW 86 -139.32 -62.48 0 0 1 0.47 RGB J0152+017 28.17 1.79 0 0 1 0.89 Centaurus A -158.64 -43.02 0 0 1 0.49 ESO 139-G12 -95.59 -59.94 0 0 1 0.36 W28 -89.57 -23.34 0 0 1 0.61 1ES 1101-232 165.91 -23.49 0 0 1 0.61
Table 1: Results of the candidate list search. The source coordinates and the Q and p-values are shown as well as the limits on the flux intensity φ90%CL; the latter has units 10−7GeV−1cm−2s−1. The rows are sorted in order of increasing p-value.
those set by the IceCube collaboration (Abbasi et al. 2011) for δ < −30◦. It should be noted that even though they all set limits on the intensity of an assumed E−2
ν spectrum, the experiments are sensitive in different energy ranges. For this spectrum, ANTARES detects most events at energies in a broad range around 10 TeV, which is the relevant energy range for several galactic sources (Crocker et al. 2005). Northern hemisphere limits shown from the IceCube experiment probe the neutrino flux predominantly in the region above 1 PeV (Abbasi et al. 2011).
The event selection and the search method have been cross-checked with an independent analysis using the same selection criteria and a search method based on the expectation-maximization algorithm (Dempster et al. 1977; Aguilar & Hernandez-Rey 2008). In this method, the angular spread of the signal events is a free parameter in the likelihood and the maximization is performed analytically. The results of both the full sky and the candidate list search are consistent with the results discussed earlier.
6. Autocorrelation Analysis
In a separate analysis, the cumulative distribution of the number of event pairs as a function of their angular separation has been studied using the neutrino candidate events. This autocorrelation analysis has been employed to search for features in the data such as an excess of tracks at an arbitrary level of angular separation. The study is independent of detector simulations and neutrino source models.
A reference autocorrelation distribution is determined by scrambling the data itself approximately one million times and averaging the resulting distributions. The comparison between the data and the reference distribution is performed following Li and Ma (1983).
The maximum excess above the reference distribution has a significance of 1.1 σ at angular scales smaller than 7 degrees. Such a deviation is expected from a collection of random background events with a (trial factor corrected) probability of 55%.
7. Conclusions
A search for cosmic sources of high energy neutrinos using the data taken with the ANTARES neutrino telescope during the first two years of operation has been presented. For the first half of the data considered, the detector was about half its final size. An estimate of the angular resolution constrained by data yields 0.5 ± 0.1 degrees (0.4 degrees for the 12-line detector), confirming the expectation that excellent angular resolution is achievable
using sea water as the detection medium. Neither the full sky search nor the candidate list search show a significant excess of events. Limits have been obtained on the high energy neutrino flux for a number of selected source candidates. For many candidate sources, the limits presented here are the most stringent to date.
The authors acknowledge the financial support of the funding agencies: Centre Na-tional de la Recherche Scientifique (CNRS), Commissariat ´a l’´energie atomique et aux ´energies alternatives (CEA), Agence National de la Recherche (ANR), Commission Eu-rop´eenne (FEDER fund and Marie Curie Program), R´egion Alsace (contrat CPER), R´egion Provence-Alpes-Cˆote d’Azur, D´epartement du Var and Ville de La Seyne-sur-Mer, France; Bundesministerium f¨ur Bildung und Forschung (BMBF), Germany; Istituto Nazionale di Fisica Nucleare (INFN), Italy; Stichting voor Fundamenteel Onderzoek der Materie (FOM), Nederlandse organisatie voor Wetenschappelijk Onderzoek (NWO), the Netherlands; Coun-cil of the President of the Russian Federation for young scientists and leading scientific schools supporting grants, Russia; National Authority for Scientific Research (ANCS), Ro-mania; Ministerio de Ciencia e Innovaci´on (MICINN), Prometeo of Generalitat Valenciana and MultiDark, Spain. We also acknowledge the technical support of Ifremer, AIM and Foselev Marine for the sea operation and the CC-IN2P3 for the computing facilities.
REFERENCES Abbasi, R., et al. 2009, Phys. Rev., D79, 062001 Abbasi, R., et al. 2011, ApJ, 732, 18
Ageron, M., et al. 2011, Nucl. Instr. Meth., 2011 (Accepted), arXiv:1104.1607 Agrawal, V., Gaisser, T.K., Lipari, P. & Stanev, T. 1996, Phys. Rev., D53, 1314 Aguilar, J. A. & Hernandez-Rey, J. J. 2008, Astropart. Phys., 29, 117
Aguilar, J. A., et al. 2007, Nucl. Instr. Meth., A570, 107 Aguilar, J. A., et al. 2010, Nucl. Instr. Meth., A622, 59 Aguilar, J. A., et al. 2011a, Phys. Lett., B696, 16 —. 2011b, Astropart. Phys., 34, 539
Amram, P.,et al. 2002, Nucl. Instr. Meth., A484, 369
Barr, G. D., Gaisser, T. K., Robbins, S., & Stanev, T. 2006, Phys. Rev., D74, 094009 Becker, J. K. 2008, Phys. Rept., 458, 173
Crocker, R. M., Melia, F. and Volkas.,R. R. 2005, ApJ, 622, L37
Dempster, A. P., Laird, N. M., Rubin, D.B. 1977, Royal Statistical Soc. Series B, 38, 1 Feldman, G. J., & Cousins, R. D. 1998, Phys. Rev., D57, 3873
Halladjian., G., 2010, PhD Thesis, http://antares.in2p3.fr/Publications Heck, D., et al. 1998, FZKA-6019
Heijboer, A. J. 2004, PhD Thesis, http://antares.in2p3.fr/Publications Kalmykov, N. N. & Ostapchenko, S. S. 1993, Phys. Atom. Nucl., 56, 346 Li, T. P. and Ma, Y. Q. 1983 ApJ272, 317
Nikolsky, S. I., Stamenov, I. N. and Ushev, S. Z. 1984, Sov. Phys. JETP, 60, 10 Thrane, E., et al. 2009, ApJ, 704, 503