Publisher’s version / Version de l'éditeur:
Vous avez des questions? Nous pouvons vous aider. Pour communiquer directement avec un auteur, consultez la première page de la revue dans laquelle son article a été publié afin de trouver ses coordonnées. Si vous n’arrivez pas à les repérer, communiquez avec nous à PublicationsArchive-ArchivesPublications@nrc-cnrc.gc.ca.
Questions? Contact the NRC Publications Archive team at
PublicationsArchive-ArchivesPublications@nrc-cnrc.gc.ca. If you wish to email the authors directly, please see the first page of the publication for their contact information.
https://publications-cnrc.canada.ca/fra/droits
L’accès à ce site Web et l’utilisation de son contenu sont assujettis aux conditions présentées dans le site LISEZ CES CONDITIONS ATTENTIVEMENT AVANT D’UTILISER CE SITE WEB.
Computer and Control in the Water Industry (CCWI) [Proceedings], pp. 1-6,
2005-09-01
READ THESE TERMS AND CONDITIONS CAREFULLY BEFORE USING THIS WEBSITE.
https://nrc-publications.canada.ca/eng/copyright
NRC Publications Archive Record / Notice des Archives des publications du CNRC :
https://nrc-publications.canada.ca/eng/view/object/?id=4320ccb6-58c0-40d3-bcd8-a72c0271c23f https://publications-cnrc.canada.ca/fra/voir/objet/?id=4320ccb6-58c0-40d3-bcd8-a72c0271c23f
NRC Publications Archive
Archives des publications du CNRC
This publication could be one of several versions: author’s original, accepted manuscript or the publisher’s version. / La version de cette publication peut être l’une des suivantes : la version prépublication de l’auteur, la version acceptée du manuscrit ou la version de l’éditeur.
Access and use of this website and the material on it are subject to the Terms and Conditions set forth at
Application of a fuzzy Markov model to plan the renewal of
large-diameter buried pipes: a case study
Application of a fuzzy Markov model to plan the
renewal of large-diameter buried pipes: a case study
Kleiner, Y.; Rajani, B.; Sadiq, R.
NRCC-48348
A version of this document is published in / Une version de ce document se trouve dans :
Computer and Control in the Water Industry (CCWI) 2005, Exeter, UK,
Sept. 5-7, 2005, pp. 1-6
APPLICATION OF A FUZZY MARKOV MODEL TO PLAN THE
RENEWAL OF LARGE-DIAMETER BURIED PIPES: A CASE STUDY
Yehuda Kleiner, Balvant Rajani and Rehan Sadiq
Institute for Research in Construction, National Research Council Canada (NRC) Ottawa, Ontario, Canada
yehuda.kleiner@nrc-cnrc.gc.ca; balvant.rajani@nrc-cnrc.gc.ca; rehan.sadiq@nrc-cnrc.gc.ca
Abstract
The lack of sufficient historical data on the deterioration of large-diameter buried transmission water mains is an obstacle to formulating an effective strategy for managing their failure risk. These historical data are required to model their rate of deterioration in order to anticipate and prevent future failures without resorting to frequent inspections that are both very costly and disruptive.
The National Research Council of Canada (NRC), with the financial support of the American Water Works Association Research Foundation (AwwaRF) has developed a new fuzzy-based approach. Fuzzy synthetic evaluation is used to discern the ‘condition rating’ of a pipe by aggregating the effects of various distress indicators observed (or estimated) during inspection. A rule-based fuzzy Markov approach, introduced in earlier publications, is used to model and predict the risk of pipe failure. This approach comprises three main concepts: (a) modeling the deterioration of a buried pipe as a fuzzy Markov process, (b) combining the possibility of failure with the fuzzy consequences to obtain the fuzzy risk of failure throughout the life of the pipe, and (c) using the fuzzy risk model to anticipate elevated risk levels and to make effective decisions on pipe renewal. These decisions include when to renew a deteriorated pipe, or alternatively, when to schedule the next inspection and condition assessment, and if renewal is required, what renewal alternative should be selected.
In this paper the approach is demonstrated through a detailed case study. Inspection data were obtained from a North American water purveyor on a large-diameter pressure cylinder concrete pipe (PCCP). The case study highlights the use of limited data, as well as the limitations and caveats that can be expected in the implementation of the model to improve renewal decisions.
Keywords
Large-diameter pipes, water transmission mains, deterioration modeling, condition rating, fuzzy sets, fuzzy Markov, failure risk, inspection scheduling, renewal planning.
1 INTRODUCTION
Low rates of failure, high costs of inspection/condition assessment and lack of robust inspection technologies are the main reasons why there is a dearth of historical data regarding the condition of large-diameter buried pipes. As the failure of such pipes can be disastrous, the risk needs to be evaluated and managed. The management of this failure risk requires a deterioration model to enable the forecast of the asset condition as well as the possibility of its failure. However, historical data required to understand and model this deterioration are scarce. The Markov deterioration process has been perhaps the most widely used approach to model the deterioration of infrastructure, as exemplified in [1] through [4]. Other types of statistical models include logistic regression [5], [6] and Baeysian updating [7]. In recent years, the application of soft computing methods to assess infrastructure deterioration has gained popularity (e.g., [8], [9], [10]). Soft computing methods include techniques such as artificial neural networks, genetic algorithms, belief networks, probabilistic reasoning and fuzzy-based techniques. Fuzzy-based techniques seem to be particularly suited to modeling the deterioration of infrastructure assets for which data are scarce and cause-effect knowledge is imprecise or vague.
Kleiner et al. [11], [12], [13] introduced a new approach to model the deterioration of buried pipes, using a fuzzy rule-based, non-homogeneous Markov process. This deterioration model yields the possibility mass function (as opposed to probability) of failure at every point along the life of the pipe. The possibility of failure is then coupled with the failure consequence to obtain the failure risk as a function of pipe age. The post-renewal deterioration rate is then assessed and a rational decision can be made on when to schedule the subsequent inspection/condition assessment, when to renew a deteriorated pipe, and how to select the most economical renewal alternative. In this paper the approach is demonstrated through a case study. Strengths and limitations are discussed along with data requirements and availability. The rest of this paper is organised as follows: Section 2 provides a brief introduction to the approach, Section 3 presents the case , section 4 presents a discussion and Section 5 provides a summary.
2 FAILRE RISK OF LARGE WATER MAINS – MODELING APPROACH
2.1
Fuzzy sets and fuzzy techniques
Fuzzy-based modeling was deemed an attractive approach because: a) the interpretation of pipe distress indicators, observed through inspection or non destructive evaluation (NDE), into a condition rating involves subjective judgment, and fuzzy sets with their notion of membership functions are appropriate for accommodating this subjectivity; b) practitioners have an intuitive understanding of the deterioration process in buried pipes (although many of the relationships between cause and effect are not well understood let alone quantified) and fuzzy techniques seem well suited to represent this intuition as well; c) failure of a large-diameter water transmission main is a relatively rare event and data on the consequences in terms of direct, indirect and social costs are scarce. The fuzzy approach is therefore well suited to exploit the qualitative understanding many practitioners have about the conditions that affect these costs
2.2
Encoding pipe condition as a fuzzy set using fuzzy synthetic evaluation
The Markovian deterioration process requires that the condition of the deteriorating asset be encoded as an ordinal condition state (e.g., State 1, State 2, or Excellent, Good, Fair, etc.). The condition assessment of a large buried pipe comprises two steps. The first step involves the inspection of the pipe using direct observation (visual, video) and/or NDE techniques (radar, sonar, ultrasound, sound emissions, eddy currents, etc.), which reveal distress indicators. The second step involves the interpretation of these distress indicators to determine the condition rating of the pipe. As stated earlier, this interpretation process, which is dependent upon the inspection technique, is often imprecise and can be influenced by subjective judgment. A method was developed [11] to interpret distress indicators into a condition rating, using a fuzzy synthetic evaluation technique. The condition rating is expressed as a fuzzy set (or possibility mass function), where the condition of the pipe is rated in terms of membership values to a seven grade scale: Excellent, Good, Adequate, Fair, Poor, Bad, Failed. For example, the condition rating (0, 0, 0.2, 0.7, 0.1, 0, 0) means 0.2, 0.7 and 0.1 memberships to condition states Adequate,
Fair and Poor respectively.
2.3
Fuzzy Markov based deterioration model
The deterioration of large-diameter transmission mains was modeled using a fuzzy rule-based, non-homogeneous Markov process [11]. This approach exploits the robustness of the Markov process and the flexibility of the rule-based fuzzy techniques and their ability to handle imprecise and vague data. In the proposed model the life of the pipe is discretized into time steps and the Markov process is applied at each time step in two stages. In the first stage, the deterioration rate at the specific time step is inferred from the asset age and condition state using a fuzzy rule-based algorithm. In the next stage, the condition state of the asset in the next time step is calculated from present condition state and deterioration rate. Essentially the deterioration process models the asset as it gradually undergoes change from better to worse condition states. This is done through memberships ‘flowing’ from higher to lower condition states. The process is formulated to mimic a reality in which a given asset at a given time cannot have significant membership values to more than two or three contiguous condition states. This deterioration model yields the possibility of failure at every time step along the life of the pipe. A first step to use the deterioration model is to train (calibrate) it on condition rating(s) of a specific pipe, obtained from one or more inspections. Once the deterioration model has been trained, it can be used to predict the future condition of the pipe.
2.4
Post-renewal condition improvement and subsequent deterioration
A pipe can be repaired or renewed (rehabilitated) when the need arises. A repair is assumed to be a very localized intervention that does not improve the condition rating of the pipe by a noticeable amount, and is not likely to change the deterioration rate of the pipe. Renewal is assumed to be an intervention that improves the condition of the pipe and possibly modifies its deterioration rate as well. Consequently, the deterioration rate obtained training the model on past inspections will be altered by a renewal but not a repair event.
Usually, several pipe renewal technologies are available each of which is assumed to have three specific attributes. The first is a condition improvement matrix, which determines how much the condition of the pipe will improve immediately after renewal. The second is a post-renewal deterioration rate matrix, which determines how fast the pipe will continue to deteriorate after renewal. The third is the cost associated with the renewal alternative. The condition improvement matrix can be populated based on hard field data, however until these types of data become available, this matrix is established from expert opinion. Similarly, the post-renewal deterioration rate matrix is also estimated from experience and expert opinion. Renewal costs can usually be obtained from manufacturers/contractors.
Once the condition improvement and the post-renewal deterioration rate matrices are established, a new fuzzy Markov-based deterioration process can be modeled, where the pipe continues to deteriorate from its post-renewal condition. If, for example, after post-renewal it takes 20 years for the pipe to deteriorate to a condition rating similar to its pre-renewal condition, it can be said that the renewal action ‘bought’ 20 years of additional life.
2.5
Fuzzy risk of failure
The risk of failure is determined jointly by the likelihood and the consequences of a failure. As stated earlier, failure of large-diameter transmission main is a relatively rare event and data on the consequences in terms of direct, indirect and social costs are difficult to come by. The fuzzy approach is therefore well suited to exploiting the qualitative understanding many practitioners have about the conditions that affect these costs. As the encoding process of failure consequences into fuzzy sets was beyond the scope of this research, it was assumed that these consequences could be described as a 9-grade (Extremely low, Very low, Quite low, Moderately low,
Medium, Moderately severe, Quite severe, Very severe, Extremely severe) fuzzy mass function.
Using a set of fuzzy rules, the fuzzy consequence mass function is coupled with the mass function that defines the possibility of failure, to obtain another mass function that describes the risk of failure as a 9-grade (Extremely
low, Very low, Quite low, Moderately low, Medium, Moderately high, Quite high, Very high, Extremely high)
fuzzy set. The risk mass function is calculated for every time step in the life of a pipe to obtain the fuzzy risk of failure throughout the life of the pipe. The future pipe condition is coupled with its fuzzy failure consequences to forecast the fuzzy risk of failure of the pipe. This is done using a set of rules.
2.6 Risk-based
decision-making
Maximum acceptable risk (MAR) is used as a decision criterion. A water utility, through a consensus-building process like Delphi, will define the MAR, while considering both the possibility of failure and the failure consequences. It is assumed that any decision to renew or rehabilitate a pipe segment or section will always be preceded by an inspection and condition assessment. Thus, if the deterioration model predicts that MAR is going to be reached at a given time, it follows that an inspection/condition assessment will be scheduled around that time. This inspection/condition assessment can have one of two outcomes:
• The observed condition of the pipe is better than predicted (the model overestimated the deterioration rate) and MAR has not yet been reached. In this case the deterioration model is re-calibrated to include the newly acquired data, then re-applied and the next inspection/condition assessment is scheduled for the new time at which MAR is predicted to be reached.
• The observed condition of the pipe is the same or worse than the model predicted and current risk is equal to or exceeds MAR. In this case renewal work has to be planned immediately and implemented as soon as possible.
When pipe renewal is required it is often necessary to select the most appropriate among several alternative renewal technologies. In the selection the user has to consider both the improvement that the renewal action will affect and the post renewal deterioration rate. The user may resort to the ‘time bought’ concept explained earlier to make this selection. If, for example, a renewal alternative that costs $100,000 buys 20 years of additional life (i.e., postpones subsequent renewal by 20 years until the time at which MAR is reached again), the normalized cost of this alternative can be thought of as $5,000 per year of extra life. The user will usually select the alternative with the lowest cost per year of extra life.
3 CASE
HISTORY
Arizona Public Service Company (APS) submitted selected information on 69 PCCP segments of 96” (2400 mm) in diameter and 98 PCCP segments of 114” (2900 mm) in diameter, all installed in 1978. Following installation, some of the pipe segments have been inspected twice and others thrice, using visual inspection,
Table 1 Distress indicators and condition ratings for 2400 mm (96”) PCCP installed in 1978
Year Inspection method
# wire
breaks Spalling Cracks Coloration
Pulse-echo sound
Condition rating
(using fuzzy synthetic evaluation)
1978 (0.9, 0.1, 0, 0, 0, 0, 0)
1997 Visual - None No cracks No stains Very firm ( 0.09, 0.85, 0.06, 0, 0, 0, 0)
1999 RFEC/TC 5 - - - - ( 0.06, 0.85, 0.09, 0, 0, 0, 0)
hammer tapping (pulse echo) to assess concrete core condition, and remote field eddy current (RFEC/TC) to detect number of wire breaks. Inspection records were examined and screened for missing or inconsistent data. observed distress indicators were interpreted into condition ratings (Table 1), as explained in Section 2.2. The pipe condition rating upon installation was unknown and therefore assumed to be (0.9, 0.1, 0, 0, 0, 0, 0).
3.1 Model
training
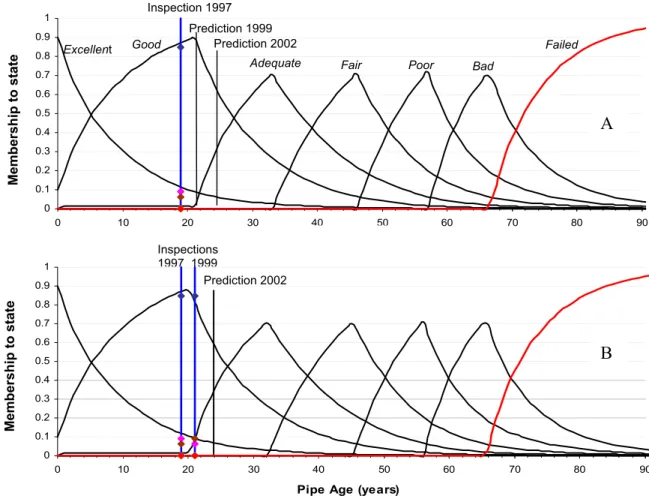
The pipe appeared to have deteriorated relatively slowly during the first 19 years, as well as during the subsequent five years. No detectable deterioration was observed between the second and third inspections, which is expected given the slow overall deterioration and the short period that had elapsed. Figure 1A illustrates the results obtained by training the deterioration model on the 1997 condition rating. The condition rating modeled for 1997 (at age 19) was (0.11, 0.88, 0.01, 0, 0, 0, 0) with sum of square deviations (SSD) at 0.003. The model
Prediction 1999 0 0.1 0.2 0.3 0.4 0.5 0.6 0.7 0.8 0.9 1 0 10 20 30 40 50 60 70 80
Pipe Age (years)
0 0.1 0.2 0.3 0.4 0.5 0.6 0.7 0.8 0.9 1 0 10 20 30 40 50 60 70 80 9
Pipe Age (years)
B
A
Inspections 1997 1999 Prediction 2002 0 Failed Bad Poor Fair Adequate Good Excellent Inspection 1997 Prediction 2002 90 Memb er sh ip to state Memb er sh ip to stateFigure 1. Training the deterioration model on (A) 1997 inspection and (B) 1997 and 1999 inspections.
forecasted the condition rating for 1999 (age 21) to be (0.09, 0.9, 0.01, 0, 0, 0, 0), which is quite close to the observed (Table 1) condition rating (SSD = 0.009). For 2002 (age 24) the forecast was (0.06, 0.66, 0.28, 0, 0, 0, 0) still quite close to the observed condition rating (SSD = 0.07). Figure 1B illustrates the results obtained by training the deterioration model on both 1997 and 1999 condition ratings. The fit was quite good (SSD = 0.023). With this calibration the model forecasted the condition rating for 2002 (age 24) to be (0.07, 0.58, 0.35, 0, 0, 0, 0), which is moderately close, with SSD = 0.139.
It appears that the extra inspection data actually degraded the accuracy of the forecast rather than improve it. This could possibly be attributed to the closeness of the inspections to each other both in time and in observed condition ratings. A more spread-out set of observations might have increased the robustness of the results, however, such data were not available. Another source of poor model performance can be a lack of synchronization (or equivalency) between two non-commensurate inspection techniques, such as visual inspection (1997 inspection) and RFEC (1999 and 2002 inspections). The model training allows the assignation of weights to inspection data to reflect the relative precision and reliability attributed to each inspection technique. However, here too available data are insufficient to determine the relative reliability of inspection techniques.
3.2 Risk-based
decision-making
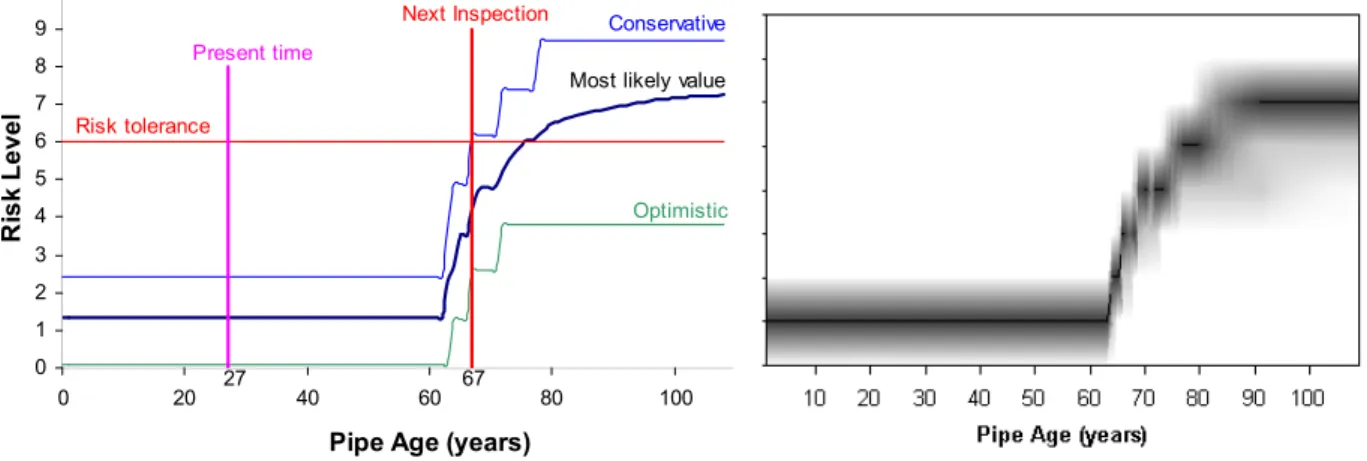
Data were not available from APS on the level of consequences attributed to the failure of the pipe. Failure consequences were therefore assumed to be between Quite low and Moderately low (with a higher inclination towards Moderately low), as represented by the fuzzy set (0, 0, 0.2, 0.8, 0, 0, 0, 0, 0). Figure 2 illustrates the fuzzy failure risk curve obtained by coupling the deterioration curve with the failure consequences.
The right side of Figure 2 depicts the fuzzy risk in greyscale, where the darker shades represent higher membership values (the darkest shade represents the most likely value). The left side of Figure 2 depicts the most likely risk value curve, bounded by a possibilistic confidence band, the level of which is selected by the user. If the utility’s maximum acceptable risk (MAR) is, say, level 6 (Moderately high), then, assuming a conservative approach, the next inspection will be scheduled at the age of about 67 years, when the MAR is expected to be reached. The condition rating of the new inspection will determine the subsequent course of action. If MAR is imminent or is exceeded (i.e., the model was either accurate or underestimated deterioration rate) then the pipe is renewed. If the model overestimated the deterioration rate then the new condition rating is used to re-calibrate it and subsequently determine the time for the next inspection.
Risk tolerance
Next Inspection
67
Most likely value Conservative Optimistic 27 Present time 0 1 2 3 4 5 6 7 8 9 0 20 40 60 80 100
Pipe Age (years)
R
isk L
e
vel
Figure 2. Fuzzy risk and scheduling the next inspection.
Post-intervention "failed" Renew al Next renew al 0.8 1.0 va lu e
Te decision maker would typically have to examine a few renewal alternatives once it is determined that the pipe needs to be renewed. For example, suppose that cement lining and post-tension are considered for the pipe at the age of 52 years, at a cost of $50,000. Suppose further that the condition improvement matrix and the post renewal deterioration rate matrix (Section 2.4) have been defined for this alternative, based on expert opinion. Figure 3 illustrates the resulting deterioration curves. At age 52 the condition rating of the pipe is predicted to be (0, 0, 0, 0.13, 0.37, 0.5, 0). The renewal alternative is expected to shift this condition rating to (0, 0.26, 0.6, 0.14, 0, 0, 0). Subsequent deterioration is expected to bring the pipe at age 83 to approximately the same condition
Pre-intervention "f ailed" G P P b A F f E 52 83 0.0 0.2 0.4 0.6 0 20 40 60 80 100 120 140
Pipe age (years)
M e m b e rshi p a E, G,….,B - Pre-intervention states e, g,….,b - Post-intervention states B
Figure 3. Deterioration curves before and after renewal (E=Excellent, G=Good, A=Adequate, F=Fair, P=Poor, B=Bad).
rating it had before renewal. This means the renewal alternative ‘bought’ 31 years of additional life at a cost of $50,000 or $1613/year. Additional renewal alternatives will be evaluated in the same way and, all else being equal, the alternative with the minimal cost per deferred year would be selected.
4 SUMMARY
Fuzzy-based techniques are particularly suited to modeling the deterioration of buried infrastructure assets, for which data are scarce, cause-effect knowledge is imprecise and observations and criteria are often expressed in vague terms. An approach to manage the renewal of large-diameter water transmission mains was demonstrated with the help of a case study. This approach can be summarized in four clearly defined steps:
1. Conduct pipe inspection/NDE, record distress indicators and interpret them into a pipe condition rating. 2. Use the pipe condition rating to train a fuzzy Markov-based deterioration model and generate risk projection
for the pipe life.
3. Compare maximum acceptable risk (MAR) to the risk projection. If the MAR has already been, or soon will be, exceeded then plan immediate renewal intervention (step 4).Otherwise schedule the next inspection for the time when MAR is expected to be exceeded.
4. Examine and compare renewal alternatives and select the optimal.
More research is needed on how to ‘align’ condition ratings that were determined for the same pipe, at different times, based on non-commensurate inspection technologies. More case studies of the type presented in this paper need to be conducted in order to build up confidence in the deterioration model. As well, a system to delineate fuzzy failure consequences is required.
Acknowledgement
This paper presents results of a research project, which was co-sponsored by the American Water Works Association Research Foundation (AwwaRF), the National Research Council of Canada (NRC) and water utilities from the United States, Canada and Australia.
References
[1] Madanat, S.M., Karlaftis, M.G., and McCarthy, P.S. (1997), “Probabilistic infrastructure deterioration models with panel data”, Journal of Infrastructure Systems, ASCE, 3(1), pp. 4-9.
[2] Wirahadikusumah, R., Abraham, D., and Isely, T. (2001), “Challenging issues in modeling deterioration of combined sewers”, Journal of Infrastructure Systems, ASCE, 7(2), pp. 77-84.
[3] Mishalani, R.G., and Madanat, S.M. (2002), “Computation of infrastructure transition probabilities using stochastic duration models”, Journal of Infrastructure Systems, ASCE, 8(4), pp. 139-148.
[4] Kleiner, Y. (2001), “Scheduling inspection and renewal of large infrastructure assets” Journal of
Infrastructure Systems, ASCE, 7(4), pp. 136-143.
[5] Ariaratnam, S.T., El-Assaly, A., and Yang, Y. (2001), “Assessment of infrastructure needs using logistic models”, Journal of Infrastructure Systems, ASCE, 7(4), pp. 160-165.
[6] Davies, J.P., Clarke, B.A., Whiter, J.T., Cunningham, R.J., and Leidi, A. (2001). “The structural condition of rigid sewer pipes: a statistical investigation”, Urban Water, 3, pp. 277-286.
[7] Ramia, A.P., and Ali, N. (1997). “Bayesian methodologies for evaluating rutting in Nova Scotia’s special B asphalt concrete overlays”, Canadian Journal of Civil Engineering, 24(4), pp. 1-11.
[8] Liang, M.T., Wu, J.H., and Liang, C.H. (2001). “Multiple layer fuzzy evaluation for existing reinforced concrete bridges”, Journal of Infrastructure Systems, ASCE, 7(4), pp. 144-159.
[9] Chao, C-J., and Cheng, F.P. (1998). “Fuzzy pattern recognition model for diagnosing cracks in RC structures”, Journal of Computing in Civil Engineering, ASCE, 12(2), pp. 111-119.
[10] Sadiq, R., Rajani, B.B., and Kleiner, Y. (2004). “A fuzzy based method of soil corrosivity evaluation for prediction of water main deterioration”, Journal of Infrastructure Systems, ASCE, 10(4), pp. 149-156. [11] Kleiner, Y., Rajani, B., and Sadiq, R. (2004) “Risk management of large-diameter water transmission
mains”, Denver, Col. American Water Works Association Research Foundation – to be published.
[12] Kleiner, Y., Rajani, B., and Sadiq, R. (2004), “Modeling failure risk in buried pipes using fuzzy Markov deterioration process”, ASCE International Conference on Pipeline Engineering and Construction (San Diego, CA). August.
[13] Kleiner, Y., Rajani, B.B. and Sadiq, R. (2004). “Management of failure risk in large-diameter buried pipes using fuzzy-based techniques”, 4th International Conference on Decision Making in Urban and Civil