ReseaRch PaPeR
Characteristics of ultrasonic acoustic emissions from walnut
branches during freeze–thaw-induced embolism formation
Jun Kasuga1,2,3, Guillaume Charrier1,2,4, Matsuo Uemura5 and Thierry Améglio1,2,* 1 Institut National de la Recherche Agronomique, UMR 547 PIAF, F-63100 Clermont-Ferrand, France 2 Clermont Université, Université Blaise Pascal, UMR 547 PIAF, F-63100 Clermont-Ferrand, France
3 Department of Agro-Environmental Science, Obihiro University of Agriculture and Veterinary Medicine, Obihiro 080-8555, Japan 4 Department of Botany, University of Innsbruck, A-6020 Innsbruck, Austria
5 Cryobiofrontier Research Center, Faculty of Agriculture, Iwate University, Morioka 020-8550, Japan
*To whom correspondence should be addressed. E-mail: Thierry.Ameglio@clermont.inra.fr Received 10 July 2014; Revised 10 December 2014; Accepted 16 December 2014
Abstract
Ultrasonic acoustic emission (UAE) methods have been applied for the detection of freeze–thaw-induced embolism formation in water conduits of tree species. Until now, however, the exact source(s) of UAE has not been identi-fied especially in angiosperm species, in which xylem tissues are composed of diverse types of cells. In this study, UAE was recorded from excised branches of walnut (Juglans regia cv. Franquette) during freeze–thaw cycles, and attempts were made to characterize UAEs generated by cavitation events leading to embolism formation according to their properties. During freeze–thaw cycles, a large number of UAEs were generated from the sample segments. However, the cumulative numbers of total UAE during freeze–thawing were not correlated with the percentage loss of hydraulic conductivity after thawing, suggesting that the sources of UAE were not only cavitation leading to embolism formation in vessels. Among the UAEs, cumulative numbers of UAEs with absolute energy >10.0 fJ strongly correlated with the increase in percentage loss of hydraulic conductivity. The high absolute energy of the UAEs might reflect the formation of large bubbles in the large lumen of vessels. Therefore, UAEs generated by cavitation events in vessels during freeze–thawing might be distinguished from other signals according to their magnitudes of absolute energy. On the other hand, the freezing of xylem parenchyma cells was followed by a certain number of UAEs. These results indicate the possibility that UAE methods can be applied to the detection of both freeze–thaw-induced embolism and supercooling breakdown in parenchyma cells in xylem.
Key words: Embolism formation, freezing stress, loss of hydraulic conductivity, ultrasonic acoustic emission, vessel, walnut,
xylem parenchyma.
Introduction
Low temperature is a major environmental factor that restricts the geographical distribution and productivity of plants (Parker, 1963; Sakai and Larcher, 1987; Xin and Browse, 2000). In particular, subfreezing temperature causes a
complex stress, generated not only by temperature stress itself but also by dehydration stress and mechanical stress due to ice crystal formation (Levitt, 1972; Yamazaki et al., 2008). To expand their distribution into cold areas and to survive under
© The Author 2015. Published by Oxford University Press on behalf of the Society for Experimental Biology. All rights reserved. For permissions, please email: journals.permissions@oup.com
Abbreviations: HTE, high-temperature exotherm; LTE, low-temperature exotherm; PLC, percentage loss of hydraulic conductivity; UAE, ultrasonic acoustic emission.
severe freezing stress in winter, some plants have developed increased cold-hardiness through adaptive processes (Sakai and Larcher, 1987; Larcher, 1995).
To survive in cold areas, plants have improved the cold-hardiness of their living cells. However, the effects of freezing on living cells are not the only stresses on plants. Freeze–thaw cycles also induce embolism in water conduits, disturbing the water uptake of above-ground tissues and thus causing serious problems (Pratt et al., 2005). Continuity of the water column is essential to carry water from roots to leaves (the cohesion–tension hypothesis; Dixon, 1914). However, embo-lism generated by the formation of gas bubbles in water con-duits breaks this continuity, resulting in failure of the water transport system. In the field, freeze–thaw-induced embolism is a common event and has been observed in many tree spe-cies during winter and early spring (Ewers, 1985; Sperry et al., 1988; Sperry and Sullivan, 1992; Lo Gullo and Salleo, 1993; Hacke and Sauter, 1995; Cochard et al., 1997; Améglio et al., 2002; McCulloh et al., 2011). The failure of the water trans-port system during winter might restrict the availability of water for the resumption of growth in spring. Therefore, it is thought that vulnerability to freeze–thaw-induced embolism is a key factor determining the geographical distribution of trees in cold areas (Langan et al., 1997; Pockman and Sperry, 1997; Mayr et al., 2003, 2006, 2014; Charrier et al., 2013).
Several methods have been employed for the assessment of embolism formation in water conduits of plants: (i) xylem hydraulic conductivity measurement before and after remov-ing emboli (Vogt, 2001; Domec and Gartner, 2002; Mayr and Cochard, 2003); (ii) the use of dye to distinguish embolized conduits from conducting segments (Mayr and Cochard, 2003; Mayr et al., 2007; Hietz et al. 2008); and (iii) cryo-scan-ning electron microscopic observations of embolized vessels (Canny, 1997; Utsumi et al., 1998; Ball et al., 2006; Mayr
et al., 2007). However, these methods are destructive and could induce artefacts (Wheeler et al., 2013). Therefore, infor-mation can only be obtained about the water status of the sample at one specific point in time. As non-destructive meth-ods of directly observing cavitation events in living plants, (iv) magnetic resonance imaging (Holbrook et al., 2001); and (v) X-ray tomography (Charra-Vaskou et al., 2012a; Brodersen et al., 2013; Suuronen et al., 2013) are now avail-able. However, both methods are utilized for small plants or small parts of plants in the laboratory. An alternative method of assessing embolism formation is (vi) recording ultrasonic acoustic emissions (UAEs). The cavitation events leading to embolism formation cause the sudden release of tension in the lumen of water conduits, resulting in UAEs with highest amplitudes in the range of 100–300 kHz (Tyree and Sperry, 1989). Therefore, UAEs allow the detection of cavitation events and estimation of the loss of hydraulic conductivity due to embolism formation. This method is also non-destruc-tive, and therefore allows real-time assessment of embolism formation not only in the laboratory but also in the field. Acoustic emission analyses have been carried out to inves-tigate the progression of embolism in water conduits under drought stress (Lo Gullo and Salleo, 1991; Ikeda and Ohtsu,
1992; Jackson and Grace, 1996; Jackson et al., 1999; Perks
et al., 2004; Hölttä et al., 2005; Rosner et al., 2006; Ogaya and Peñuelas, 2007; Johnson et al., 2009; Mayr and Rosner, 2011) and under freezing stress (Raschi et al., 1989; Kikuta and Richter, 2003; Mayr et al., 2007; Mayr and Sperry, 2010; Mayr and Zublasing, 2010; Charrier et al., 2014).
However, the cumulated number of UAEs is not always proportional to the loss of hydraulic conductivity in the xylem (Rosner et al., 2006; Mayr and Rosner, 2011). A pos-sible reason is that a source(s) other than cavitation in water conduits produces UAEs. To distinguish the UAEs related to embolism formation from other signals, analyses of waveform characteristics have been progressed using coniferous trees (Rosner et al., 2006; Mayr and Rosner, 2011; Wolkerstorfer
et al., 2012), and a correlation between the energy of UAEs and xylem lumen dimensions has been observed (Mayer and Rosner, 2011; Wolkerstorfer et al., 2012; Ponomarenko et al., 2014; Rockwell et al., 2014). Angiosperm species have more complex secondary xylem tissues compared with conifer-ous trees in which tracheids assume the roles of both water transport and mechanical support, suggesting that further careful interpretation of UAEs is required for angiosperm species. Recently, the existence of correlations between tive cumulated UAEs during a freeze–thaw cycle and the rela-tive percentage loss of hydraulic conductivity (PLC) after the freeze–thaw cycle, and between ψ50 (the negative pres-sure required for 50% loss of water conductivity) and T50 (the subfreezing temperature generating 50% of cumulated UAEs), in angiosperm species was reported (Charrier et al., 2014). However, the study also indicated the presence of a seasonal shift in T50 during cold acclimation. Acclimation of the hydraulic system has not been observed (Charra-Vaskou
et al., 2012b), suggesting that part of these signals might orig-inate from a source(s) other than vessels. Further clarifica-tion of embolism formaclarifica-tion through UAE analyses requires interpretation of the UAE origins. Using excised branches of walnut (Juglans regia cv. Franquette), in this study, the rela-tionship between the generation of UAEs during various type of freeze–thaw cycles (i.e. changing the number of freeze– thaw cycles and the minimum temperatures) and the PLC after freeze–thawing was clarified and the characteristics of UAEs related to cavitation events in vessels were investigated.
Materials and methods
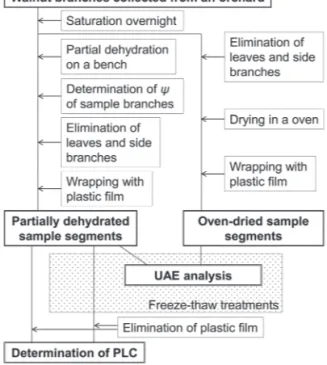
Many different experiments were performed, and are summarized in Fig. 1.
Plant materials
Samples were harvested from walnut trees (J. regia L. cv. Franquette), grown in an orchard at the INRA UMR-PIAF research station in Clermont-Ferrand, France, during the foliation season (May– October in 2010 and 2011). In the present study, walnut branches harvested during the foliation season were used because sample branches with leaves are easily saturated and dehydrated to desired ψ values. In addition, these sample branches experienced no freez-ing event before the experiment subsequent to the previous winter. Branches with a basal diameter up to 2 cm were excised from adult trees and immediately transported to the laboratory. The cut ends of the branches were recut at least three times under water to release
xylem tension gradually and to minimize the effects of introduction of air into the xylem by the cut (Wheeler et al., 2013). Afterward, the branches were covered with black plastic bags and saturated at room temperature overnight. The saturated branches were partially dehy-drated on a bench in the poorly illuminated laboratory to designated ψ values. The ψ values of leaves were measured with a Scholander-type pressure chamber (PMS Instrument Company, Albany, OR, USA) and these values are considered as those of whole branches because the transpiration rate of the samples could be assumed to be low under poor illumination. To calculate the mean ψ values, at least three replications were performed for each ψ measurement. After the desired ψ value was obtained, sample segments ~50 cm long were cut from the branches, and the leaves and the side branches were removed. The samples were tightly wrapped with plastic film to pre-vent further dehydration. The volume of xylem tissue in each sample was calculated from the diameter of xylem tissues at both cut ends and the sample length by simplification of the branch shape as a cyl-inder. Completely dried sample segments were prepared in a drying oven at 80 °C for 72 h.
Freeze–thaw treatments
Sample segments wrapped with plastic film were exposed to freeze– thaw cycles in a temperature-controlled chamber (MK999, Binder GmbH, Tuttlingen, Germany). Three kinds of freeze–thaw cycle(s) were employed. (i) For one cycle of freeze–thawing to different mini-mum temperatures (–10, –25, or –40 °C), the samples were kept at 5 °C for 1 h and then cooled linearly at a rate of 15 °C h−1 to the
des-ignated temperature. After equilibration at this temperature for 1 h, the samples were rewarmed to 5 °C at a rate of 15 °C h−1 and
equil-ibrated again at 5 °C for 1 h. (ii) For repeated freeze–thaw cycles, the temperature of the chamber was controlled between 5 °C and –10 °C. Samples were equilibrated at 5 °C for 1 h, cooled to –10 °C over 1 h (at a rate of 15 °C h−1), equilibrated at –10 °C for 1 h, and
rewarmed to 5 °C over 1 h (at a rate of 15 °C h−1). This freeze–thaw
cycle was repeated up to 15 times. After the designated number of freeze–thaw cycles, samples were equilibrated at 5 °C for 1 h. (iii) For one cycle of stepwise freeze–thawing, after equilibration at 5 °C for 1 h, samples were cooled to –10, –25, and –40 °C in a stepwise man-ner at a rate of 15 °C h−1. At each step, samples were equilibrated
for 2 h. After equilibration at –40 °C, the samples were rewarmed to 5 °C at a rate of 15 °C h−1, and equilibrated at 5 °C for 1 h.
Detection of acoustic emissions
Ultrasonic emission analyses were performed with a μDiSP system and 150 kHz resonance sensors (R15/C, 80–400 kHz) connected to a 20/40/60 dB pre-amplifier set to 40 dB (all compo-nents: Mistras Group SA, Sucy-en-Brie, France) using partially dehydrated sample segments and oven-dried sample segments wrapped with plastic film. The manufacturer ensures an excellent temperature stability of the sensors between –65 °C and 175 °C. Approximately 4 cm2 of bark and plastic film of each sample
from the lower portion of the branches (opposite sides of the tension wood) was removed with a razor blade and the debarked surface was covered with silicone grease to prevent further tran-spiration. The sensors were tightly attached to the debarked por-tion of the samples using clamps. The threshold was set to 45 dB and the peak definition time, hit definition time, and hit lockout time were set at 200, 400, and 2 μs, respectively. The detection and analysis of UAEs were performed with AEwin software (Mistras Holdings Corporation, Princeton, NJ, USA), whereby the time, counts, amplitude, and absolute energy of the hits were regis-tered. Concurrent with UAE measurement, the air temperature in the temperature-controlled chamber and the xylem temperature of the sample branches were measured using copper–constantan thermocouples.
Evaluation of the level of embolism
The level of embolism was evaluated as the PLC using a XYL’EM flow-meter instrument (Bronkhorst, Montigny-Les-Cormeilles, France). After removal of the plastic film covering the sample seg-ments, 15 cm long samples were cut from the internodal portion of partially dehydrated branches under water. The basal cut end of samples was connected to the XYL’EM instrument with silicone tubes. The initial conductivity, Ki, was measured with a pressure
difference of 5 kPa using 10 mM KCl and 1 mM CaCl2 solution,
which was degassed and filtered through a 0.2 μm filter (Whatman, Maidstone, UK) in advance. The segments were then flushed at a pressure of 150 kPa for 10 min to eliminate gas bubbles from ves-sels, and the hydraulic conductivity of the segments was determined again. The flushing was repeated until the conductivity reached a threshold (Km). The PLC value was calculated as
PLC=100 (×Km−Ki) /Km (1)
The values of ψ50 (the pressure required for 50% loss of water
conductivity without a freeze–thaw cycle) and ψ50F (the pressure
required for 50% loss of water conductivity after one cycle of freeze– thawing between 5 °C and –10 °C) were estimated from curve fitting with a sigmoidal function:
PLC=(A D− ) / {1+eB(y−C)}+D
(2) where A and D represent the asymptotes of the function, B is the sigmoidal gain, and C is the ψ value of the inflection point. In the present study, the maximum and minimum PLC values were fixed at 100% (A parameter) and 0% (D parameter), respectively. The other parameters in Equation 2 were estimated by minimizing the sum of squares using a solver function of Excel 2010 (Microsoft, Redmond, WA, USA).
Statistical analysis
The values of PLC, cumulative number of UAEs, and UAE qual-ity parameters are presented as means ±SEs. The normalqual-ity of the distribution of the data was tested in a Shapiro–Wilk test. For data that had a normal distribution (PLC values and the cumulative number of UAEs), parametric multiple comparisons were made in a Tukey’s honestly significant difference test. For data not distributed normally (UAE quality parameters), non-parametric multiple com-parisons were made in a Steel–Dwass test.
Fig. 1. Experimental procedure flowchart. UAE, ultrasonic acoustic emission; PLC, percentage loss of hydraulic conductivity.
Results
Freeze–thaw-induced embolism and UAEs induced in sample segments with different water potentials
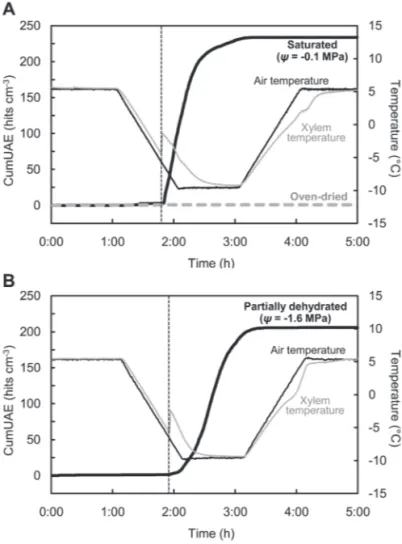
Typical patterns of UAE generation from saturated sample segments (ψ= –0.1 MPa) and partially dehydrated sample seg-ments (ψ= –1.6 MPa) during one freeze–thaw cycle between 5 °C and –10 °C are shown in Fig. 2. In both cases, UAEs were generated during the cooling process. Thereafter, UAEs contin-ued to be registered throughout the freezing process. However, no or few UAEs were observed during the thawing process. A similar pattern of UAE generation was observed in all par-tially dehydrated samples regardless of water potential, as well as in other experiments described below (Fig. 5; Supplementary
Figs S1–S3 available at JXB online). In contrast, no UAEs were detected from oven-dried sample segments (Fig. 2A).
Figure 3 indicates the PLC of partially dehydrated sample segments with or without a freeze–thaw cycle between 5 °C and –10 °C. In samples without a freeze–thaw cycle, a dis-tinct increase in PLC was recorded from a ψ of –1.0 MPa, and ψ50 was observed at a ψ of –2.0 MPa. In the case of sam-ple segments after one freeze–thaw cycle between 5 °C and –10 °C, the increase in PLC was initiated at a higher water potential than in the case of sample segments without freeze– thaw treatment (Fig. 3). The increase was observed at slightly negative ψ, and ψ50F was observed at a ψ of –0.9 MPa. The shaded area in Fig. 3 shows the difference in PLC with and without freeze–thaw treatment, which suggests conductivity loss only by the effects of the freeze–thaw cycle. The maxi-mum effect of the freeze–thaw cycle on PLC was observed in a range between –1.4 MPa and –1.6 MPa. Thus, in subse-quent experiments (repeated freeze–thaw cycles, one cycle of freeze–thawing to –25 °C and –40 °C, and one cycle of step-wise freeze–thawing), sample segments with a ψ in this range (ψ= –1.6 MPa) were used as partially dehydrated samples.
To evaluate the effect of ψ on the properties of UAEs from sample segments, the counts, amplitude, and absolute energy of signals were compared within three different ψ ranges (from –0.1 to –0.5 MPa, from –1.3 to –1.7 MPa, and from –2.6 to –3.0 MPa) (Table 1). Referring to Fig. 3, it was deter-mined that <20% of hydraulic conductance was lost after one freeze–thaw cycle between 5 °C and –10 °C in the higher ψ range (–0.1 MPa to –0.5 MPa). The effect of the freeze–thaw treatment was most severe in the middle ψ range (–1.3 MPa to –1.7 MPa), and almost all vessels lost their hydraulic func-tions before the freeze–thaw treatment in the lower ψ range (–2.6 MPa to –3.0 MPa). For all parameters, significant dif-ferences were observed among the three ψ ranges, of which the middle ψ range had the highest mean values (Table 1). In particular, the mean absolute energy in the middle ψ range was >1.6 times the values in the other ψ ranges.
Fig. 2. Ultrasonic acoustic emission (UAE) generation from a walnut branch segment saturated (ψ= –0.1 MPa), oven-dried, or dehydrated to a water potential (ψ) of –1.6 MPa (partially dehydrated) during one cycle of freeze–thawing between 5 °C and –10 °C. Typical curves in eight sample segments tested are plotted for each condition. The cumulative number of UAEs was divided by the volume of the xylem in the sample segments. (A) Cumulative number of total UAEs from saturated and oven-dried sample segments. Thick black line, UAEs from a saturated sample; dashed grey line, UAEs from an oven-dried sample; thin black line, air temperature in a temperature-controlled chamber; thin grey line, xylem temperature of the saturated sample; dotted thin black line, initiation of freezing in the saturated sample. (B) Cumulative number of total UAEs from a partially dehydrated sample segment. Thick black line, UAEs from a partially dehydrated sample; thin black line, air temperature in a temperature-controlled chamber; thin grey line, xylem temperature of the partially dehydrated sample; dotted thin black line, initiation of freezing in the partially dehydrated sample.
Fig. 3. Percentage loss of hydraulic conductivity (PLC) in walnut branch segments dehydrated to different water potentials (ψ) and exposed to one cycle of freeze–thawing between 5 °C and –10 °C. Black diamonds, before freeze–thawing; white triangles, after freeze–thawing. Sigmoidal curves were fitted to the PLC values depending on ψ for each freeze– thaw condition. The shaded area represents the difference before and after freeze–thaw treatment, and indicates the effect of the freeze–thaw process.
The relationship between ψ of branches and the cumula-tive number of total UAEs from sample segments treated with one freeze–thaw cycle between 5 °C and –10 °C is presented in Fig. 4A. In contrast to changes in PLC, no significant differences between each ψ range were observed between 0 and –3.0 MPa.
The cumulative number of total UAEs was separated into four classes (0–0.1, 0.1–1.0, 1.0–10.0, and >10.0 fJ) on the basis of the absolute energy of each hit (Fig. 4B–E). After
classification, no significant differences were observed in the cumulative number of UAEs among each ψ range up to 10.0 fJ. In the case of UAEs with absolute energy >10.0 fJ, some significant differences in cumulative number of UAEs among each ψ range were observed, and the mean values of the cumulative number of UAEs had a bell-shaped pat-tern similar in shape to the upper limit of the shaded area in Fig. 3.
Table 1. Characteristics of freeze-induced ultrasonic acoustic emissions (UAEs) from walnut branch segments at different water
potentials, subjected to one freeze–thaw cycle
The counts (the number of crossings of the detection threshold), amplitude, and absolute energy of UAE induced by one cycle of freeze–thawing between 5 °C and –10 °C from sample segments dehydrated to a water potential (ψ) range of –0.1 to –0.5, –1.3 to –1.7, or –2.6 to –3.0 MPa are indicated.
Ψ range (MPa) Counts Amplitude (dB) Absolute energy (fJ) n
–0.1 to −0.5 5.19 ± 0.03 a 51.00 ± 0.02 a 0.93 ± 0.06 a 59 907 –1.3 to −1.7 6.50 ± 0.02 b 52.24 ± 0.02 b 1.52 ± 0.11 b 116 705 –2.6 to −3.0 4.94 ± 0.04 c 50.92 ± 0.04 a 0.66 ± 0.04 a 24 138
n, number of signals analysed.
Values are the mean ±SE.
Values within a column followed by the same letter are not significantly different (P<0.05).
Fig. 4. Cumulative ultrasonic acoustic emission (UAE) derived from one cycle of freeze–thawing between 5 °C and –10 °C from walnut branch segments dehydrated to different water potentials (ψ). (A) Cumulative number of total UAEs. (B–E) Cumulative number of UAEs classified on the basis of absolute energy. The range of absolute energy is shown in the upper right corner of each graph. The cumulative number of UAEs was divided by the volume of xylem in the sample segments. Numbers of samples are indicated below the ψ ranges. Each bar and error bar represent the mean ±SE. For the ψ range from –2.0 MPa to –2.5 MPa, each point represents an individual measurement. Bars with a different letter are significantly different (P<0.05).
Embolism and UAEs induced by repeated freeze–thaw cycles
The levels of embolism in partially dehydrated sample seg-ments (ψ= –1.6 MPa) were estimated by PLC measurement after repeated freeze–thaw cycles. Before the freeze–thaw cycles, the PLC of sample segments dehydrated to a ψ of –1.6 MPa was 38.2 ± 10.1% (data not shown). As shown in previous sections, almost all vessels lost their hydraulic con-ductivities after one freeze–thaw cycle to –10 °C when the sample segments were partially dehydrated to a ψ of –1.6 MPa (Table 2). Similarly, PLC values of ~100% were observed after two or five freeze–thaw cycles (Table 2).
During repeated freeze–thaw cycles, UAEs continued to be generated even in the 15th freeze–thaw cycle, although the total number of UAEs in each freeze–thaw cycle decreased in association with the increase in cycle number (Table 2; Supplementary Fig. S1 at JXB online). Total cumulative num-bers of UAEs generated in response to different minimum temperatures were classified into four categories according to the absolute energy of each hit (0–0.1, 0.1–1.0, 1.0–10.0, and >10.0 fJ) in a similar manner to Fig. 4. After classifica-tion, UAEs with high absolute energy tended to be observed at a higher rate in the first cycle compared with other cycles (Table 2). For UAEs with absolute energy >10.0 fJ, 57% of the cumulative number of UAEs during 15 freeze–thaw cycles was registered in the first freeze–thaw cycle, and very few UAEs were observed after the sixth freeze–thaw cycle (Table 2).
Embolism and UAEs induced by different minimum freezing temperatures
After one freeze–thaw cycle to each of –10, –25, and –40 °C, almost all hydraulic conductivity in partially dehydrated sam-ple segments (ψ= –1.6 MPa) was lost (Table 3). In contrast, the cumulative number of total UAEs tended to increase in association with the decrease in minimum temperature (Table 3). The number of UAEs varied greatly between –10 °C and –25 °C, and changed slightly, but not significantly, between –25 °C and –40 °C. The total cumulative numbers of UAEs generated in response to different minimum tem-peratures were then classified into four categories according to the absolute energy of each hit. From 0 to 1.0 fJ, the cumu-lative number of UAEs in each range had a trend similar to that of total UAEs. For UAEs having absolute energy >1.0 fJ, however, the difference between each minimum temperature became smaller, and no significant differences were detected among each minimum temperature for UAEs with absolute energy >10.0 fJ. This result suggests that UAEs with such high energy were mainly generated at a temperature above –10 °C.
To confirm the generation of UAEs with high energy at a temperature above –10 °C, sample segments were cooled in a stepwise manner (Supplementary Fig. S3 at JXB online), and the cumulative number of UAEs generated in each step was recorded (Table 4). In the case of total UAEs, signals were detected mainly in cooling steps from 5 °C to –10 °C (UAE Table 2.
Loss of hydraulic conductivity and cumulative ultrasonic acoustic emission (UAE) derived from 15 cycles of freeze–thawing betwe
en 5 °C and –10 °C from walnut branch
segments dehydrated to a water potential of –1.6 MPa The cumulative number of UAEs was divided by the volume of xylem in the sample segments.
Fr eeze–thaw cycles 1 2 3 4 5 6 7 8 9 10 11 12 13 14 15 PLC (%) 95.4 ± 3.8 a 99.1 ± 0.9 a ND ND 98.7 ± 0.8 a ND ND ND ND ND ND ND ND ND ND CumUAE (hits cm −3)
Absolute energy (fJ) Total
225.8 ± 17.8 a 127.2 ± 17.4 b 130.0 ± 26.8 b 77.6 ± 9.9 b 59.2 ± 9.1 c,d 45.5 ± 9.8 c,d,e 35.9 ± 9.0 c,d,e 30.6 ± 8.5 c,d,e 27.1 ± 7.5 c,d.e 24.0 ± 6.8 c,d,e 19.9 ± 6.7 c,d,e 18.1 ± 6.0 e 17.6 ± 5.3 e 15.8 ± 5.1 e 14.7 ± 4.7 e 0–0.1 105.8 ± 12.5 a 70.0 ± 10.4 a,b,c 78.3 ± 20.5 a,b 46.4 ± 7.1 b,c,d 36.0 ± 6.5 c,d 28.2 ± 6.6 d 22.2 ± 5.7 d 18.8 ± 5.0 d 16.2 ± 4.2 d 14.2 ± 3.7 d 11.8 ± 3.7 d 10.6 ± 3.0 d 10.4 ± 2.8 d 9.4 ± 2.6 d 8.9 ± 2.4 d 0.1–1.0 90.0 ± 6.0 a 46.6 ± 6.3 b 44.0 ± 7.3 b,c 26.7 ± 3.1 c,d 20.4 ± 2.7 e 15.4 ± 3.2 d,e 12.3 ± 3.2 d,e 10.6 ± 3.3 d,e 9.8 ± 3.1 d,e 8.8 ± 2.9 d,e 7.4 ± 2.7 e 6.7 ± 2.7 e 6.4 ± 2.3 e 5.8 ± 2.2 e 5.2 ± 2.1 e 1.0–10.0 25.1 ± 1.6 a 9.3 ± 1.5 b 6.8 ± 1.4 b,c 4.1 ± 0.7 c,d 2.5 ± 0.4 d 1.8 ± 0.2 d 1.3 ± 0.2 d 1.2 ± 0.3 d 1.1 ± 0.3 d 0.9 ± 0.3 d 0.7 ± 0.3 d 0.7 ± 0.3 d 0.7 ± 0.3 d 0.6 ± 0.3 d 0.6 ± 0.3 d >10.0 4.9 ± 0.2 a 1.4 ± 0.2 b 0.9 ± 0.1 b,c 0.5 ± 0.1 b,c 0.3 ± 0.0 c 0.2 ± 0.0 c 0.1 ± 0.0 c 0.1 ± 0.0 c 0.1 ± 0.0 c 0.0 ± 0.0 c 0.0 ± 0.0 c 0.0 ± 0.0 c 0.1 ± 0.0 c 0.0 ± 0.0 c 0.0 ± 0.0 c Values ar
e the mean ±SE for eight r
eplicates. Values within a r ow followed by a dif fer ent letter ar e significantly dif fer ent ( P <0.05).
CumUAE, cumulative number of UAEs; ND, not determined; PLC, per
centage loss of hydraulic conductivity
.
counts, 6.64 ± 0.03; amplitude, 52.60 ± 0.02) and from –10 °C to –25 °C (UAE counts, 3.26 ± 0.01; amplitude, 48.92 ± 0.01). From –25°C to –40°C, only a few UAEs were detected (UAE counts, 2.59 ± 0.04; amplitude, 47.86 ± 0.03), and few UAEs were observed during the thawing process (UAE counts, 5.06 ± 0.25; amplitude, 52.38 ± 0.18). Then, the total cumula-tive numbers of UAEs were classified on the basis of absolute energy of each hit. Although generation patterns of UAEs with energy <1.0 fJ had a trend similar to that of total UAEs, the highest number of UAEs with energy >1.0 fJ was detected from 5 °C to –10 °C among each step. In particular, for UAEs with energy >10.0 fJ, 84% of signals were detected from 5 °C to –10 °C.
Relationship between exothermal phenomena in walnut sample segments and UAEs during freezing A typical pattern of UAE generation from partially dehy-drated sample segments (ψ= –1.6 MPa) during one freeze– thaw cycle to –40 °C is shown in Fig. 5A. In this figure, the difference between xylem temperature and air temperature is also indicated. The curve for this temperature difference has two types of exothermal peaks, even though these peaks
overlap to some degree, during the cooling process. The first rapid increase in xylem temperature was observed at about –5 °C (termed the high-temperature exotherm; HTE), and the second increase in xylem temperature occurred at about –20 °C (termed the low-temperature exotherm; LTE). The derivative of the curve of the cumulative number of UAEs and the difference between xylem temperature and air tem-perature during cooling to –40 °C are shown in Fig. 5B. The generation of UAEs was initiated concurrently with HTE ini-tiation, the maximum number of UAEs was recorded after the HTE peak, and a slight increase in the number of reg-istered UAEs was followed by the LTE peak (Fig. 5B). For UAEs with energy >10.0 fJ, almost all signals were recorded in association with HTE (Fig. 5C).
Discussion
Vessels of walnut have a mean diameter of 60–160 μm (Améglio et al., 2002). Water conduits with a diameter larger than 30 μm are highly vulnerable to freeze–thaw-induced embolism (Davis et al., 1999). In winter, nearly 100% PLC is commonly observed in walnut trees in the field (Améglio
et al., 2002). In this study, artificial freeze–thaw treatments
Table 3. Loss of hydraulic conductivity and cumulative ultrasonic acoustic emission (UAE) derived from one cycle of freeze–thawing
with different minimum temperatures (–10, –25, or –40 °C) for walnut branch segments dehydrated to a water potential of –1.6 MPa The cumulative number of UAEs was divided by the volume of xylem in the sample segments.
Minimum temperature (°C)
–10 –25 –40
PLC (%) 95.4 ± 3.8 a 97.7 ± 1.1 a 99.9 ± 0.0 a CumUAE (hits cm−3) Absolute energy (fJ)
Total 225.8 ± 17.8 a 723.8 ± 125.6 b 859.6 ± 119.6 b 0–0.1 105.8 ± 12.5 a 454.8 ± 85.8 b 591.5 ± 82.9 b 0.1–1.0 90.0 ± 6.0 a 220.3 ± 37.2 b 225.9 ± 31.9 b 1.0–10.0 25.1 ± 1.6 a 42.8 ± 4.9 b 35.0 ± 6.6 a,b >10.0 4.9 ± 0.7 a 6.9 ± 1.4 a 7.2 ± 1.7 a
Values are the mean ±SE for eight replicates.
Values within a row followed by a different letter are significantly different (P<0.05). CumUAE, cumulative number of UAEs; PLC, percentage loss of hydraulic conductivity.
Table 4. Cumulative ultrasonic acoustic emission (UAE) derived from stepwise freeze–thawing from walnut branch segments
dehydrated to a water potential of –1.6 MPa (hits cm−3)
The cumulative number of UAEs was divided by the volume of xylem in the sample segments. Absolute energy (fJ) Step
5 °C to –10 °C –10 °C to –25 °C –25 °C to –40 °C –40 °C to 5 °C Total 189.0 ± 34.7 a 721.1 ± 158.6 b 26.7 ± 10.4 a 2.0 ± 0.7 a 0–0.1 89.7 ± 13.6 a 523.7 ± 112.5 b 22.3 ± 8.9 a 1.6 ± 0.5 a 0.1–1.0 73.2 ± 15.3 a 183.1 ± 43.5 b 4.2 ± 1.5 a 0.4 ± 0.2 a 1.0–10.0 21.2 ± 5.8 a 13.5 ± 3.6 a 0.2 ± 0.0 b 0.0 ± 0.0 b >10.0 4.8 ± 1.2 a 0.9 ± 0.2 b 0.1 ± 0.0 b 0.0 ± 0.0 b
Values are the mean ±SE for eight replicates.
Values within a row followed by a different letter are significantly different (P<0.05).
induced embolism formation even in sample segments with ψ slightly lower than 0 MPa (Fig. 3). The PLC of sample segments partially dehydrated at a ψ of –1.6 MPa without a freeze–thaw treatment was ~38%, which was higher than the PLC estimated from the sigmoidal curve in Fig. 3. A level of native embolism might have remained in some samples even after saturation treatment.
To clarify the relationship between freeze–thaw-induced embolism and UAE, the effects of sample ψ, repeated freeze– thaw cycles, and freezing temperatures were investigated. In
each experiment, UAEs were first registered concurrent with the initiation of freezing of the sample segments (Figs 2, 5A; Supplementary Figs S1–S3 at JXB online). Across samples with different ψ, no correlation between ψ and the cumula-tive number of total UAEs was observed (Figs 3, 4A). Even in the ψ range from –0.1 MPa to –0.5 MPa, in which >80% of vessels retained their hydraulic function after one freeze–thaw cycle to –10 °C, significant numbers of UAEs were generated (Fig. 4A). Repeated freeze–thaw cycles and lower freezing temperatures resulted in increases in the cumulative number of total UAEs (Tables 2–4), although one freeze–thaw cycle from 5 °C to –10 °C was sufficient for sample segments to lose most of their hydraulic conductivity (Tables 2, 3). Relaxation of tension in water conduits due to cavitation events in the freezing sap is one of the most likely origins of UAEs during freeze–thawing (Tyree and Sperry, 1989; Mayr et al., 2007; Charrier et al., 2014). However, the discrepancy between the increase in the cumulative number of UAEs and embolism formation indicates that some UAEs originated from sources other than the vessel lumen.
To distinguish UAEs generated by cavitation events in ves-sels from UAEs of other origins, the parameters of individ-ual freeze–thaw-induced UAEs were investigated for sample segments with three different ψ ranges (Table 1). Significant differences were observed for the parameters of counts, amplitude, and absolute energy among the three ψ ranges. High values of absolute energy were observed particularly in the ψ range from –1.3 MPa to –1.7 MPa (Table 1), in which the maximum loss of hydraulic conductivity by a freeze– thaw cycle was observed (Fig. 3). Under drought stress, a correlation between the energy of UAEs and xylem lumen dimensions has been observed (Mayr and Rosner, 2011; Ponomarenko et al., 2014), probably because larger water conduits store higher total elastic energy (Ponomarenko et al., 2014). In freeze–thaw conditions, the formation of larger gas bubbles is expected in larger water conduits (Cruiziat et al., 2002). The larger bubbles might induce the release of higher tension, resulting in signals of higher energy. Compared with coniferous trees with narrow tracheids, the absolute energy for walnut branch segments with a ψ range from –1.3 MPa to –1.7 MPa was ~10 times that detected for P. contorta twigs partially dehydrated at a ψ of –3 MPa (Mayr and Sperry, 2010).
When UAEs were split into four groups depending on their absolute energy, the group with the highest absolute energy (>10.0 fJ) was significantly correlated to PLC (Supplementary Fig. S4 at JXB online). It is predicted that these UAEs were probably generated by cavitation events preceding embolism formation during freeze–thaw cycles. Therefore, the progress of freeze–thaw-induced embolism could be estimated using the level of absolute energy of UAEs. However, some tech-nical features of the UAE analysis techniques (e.g. attenua-tion along the sample, simultaneous arrival times of several independent signals at the sensor, and the lockout time of the acquisition system after a signal has ended) might result in some UAEs being missed. Especially in a heterogeneous material such as wood, the material’s attenuation strongly influences UAE detection (Mayr and Rosner, 2011). Thus, it Fig. 5. Effects of one cycle of freeze–thawing between 5 °C and –40 °C
on ultrasonic acoustic emission (UAE) generated from walnut branch segments dehydrated to a water potential (ψ) of –1.6 MPa. (A) UAE generation from sample segments during one cycle of freeze–thawing. A typical curve in eight sample segments tested is plotted. Thick black line, UAE; thin black line, air temperature in the temperature-controlled chamber; thin grey line, xylem temperature; thin light grey line, thermal difference between the xylem temperature and air temperature; dotted black line, initiation of freezing in the partially dehydrated sample. (B) Derivative of the curve of cumulative numbers of UAE (thick black line) and the difference between the xylem temperature and air temperature (thin black line) during cooling to –40 °C. HTE, high-temperature exotherm; LTE, low-temperature exotherm. (C) Derivative of the curve of cumulative numbers of UAE with absolute energy >10.0 fJ.
would be better to think that the UAEs reaching the sensor are indicators of events occurring within the wood although not all cavitation events can be detected. Approximately 40% and 15% of UAEs with absolute energy >10.0 fJ were also detected after the first cycle of freeze–thawing from 5 °C to –10 °C in the repeated freeze–thaw treatment (Table 2) and after the first step at –10 °C in the stepwise freeze–thaw treat-ment (Table 4), respectively. Thresholds separating the dif-ferent UAE groups (0.1, 1.0, and 10.0 fJ) were assigned by default for descriptive purposes, and should result in the mix-ing of signals from different sources. More suitable values for the recognition of UAEs that reflect embolism generation might be established by further studies. Nevertheless, correla-tion between detectable UAEs and hydraulic conductivity is significant (Supplementary Fig. S4).
What are the origins of UAEs other than cavitation events in vessels? In the present study, excised branches were used in experiments without the removal of the bark and cambium. It is thus possible that some UAEs originated from these tis-sues (Kikuta, 2003). In a preliminary experiment, however, no significant difference in the cumulative number of total UAEs during a freeze–thaw cycle from 5 °C to –10 °C was observed between sample segments with intact bark and debarked segments (data not shown). Therefore, bark was not a major origin of UAEs. No UAEs were detected from oven-dried walnut sample segments (Fig. 2A), similar to results reported for coniferous trees (Mayr et al., 2007; Mayr and Zublasing, 2010). The lack of UAEs from oven-dried sample segments indicates that cell walls do not induce any acoustic activity. The main components of walnut secondary xylem are wood fibres, vessels, axial parenchyma, and ray paren-chyma. In particular, >60% of the walnut secondary xylem is composed of wood fibres (unpublished data). The cavita-tion events in wood fibres could generate UAEs. Utsumi et al. (1998) reported cavitation and refilling with water not only in vessels but also in wood fibres in some angiosperm trees.
When sample segments partially dehydrated to a ψ of –1.6 MPa were cooled to –40 °C, an increase in the number of registered UAEs was observed after the appearance of the LTE for the segments at about –20 °C. The UAEs following the LTE did not contain those with energy >10.0 fJ (Fig. 5C). Although some temporal differences were observed between the LTE peak and the peak of the derivative of the curve of the cumulative number of UAEs, the LTE indicates the onset of the freezing process (Fig. 5B). The LTE for xylem tissues containing xylem parenchyma cells that adapt to subfreez-ing temperatures via a freezsubfreez-ing avoidance mechanism (deep supercooling) corresponds to breakdown of the supercooling state of intracellular water in xylem parenchyma cells, while the HTE indicates freezing of water in apoplastic spaces including vessels and wood fibres (Fujikawa and Kuroda,
2000; Neuner et al., 2010). Fukami et al. (2011) detected
UAEs from bamboo leaves accompanied by freezing of liv-ing cells that adapt to subfreezliv-ing temperatures via a freezliv-ing avoidance mechanism. Given that no UAEs were generated from winter leaves of angiosperm trees that adapt to sub-freezing temperatures by extracellular sub-freezing during the cooling process, Fukami et al. (2011) speculated that UAE
generation is related to supercooling breakdown in plant cells. Ristic and Ashworth (1994) and Kuroda et al. (1999) observed protoplasm contraction and cavitation of the intra-cellular spaces of xylem ray parenchyma cells of angiosperms after cooling of the xylem tissues to a low subfreezing tem-perature employing transmission electron microscopy and cryo-scanning electron microscopy, respectively. The cavita-tion events in xylem parenchyma cells might generate UAEs. Weiser and Wallner (1988) reported that there are more acoustic emissions from tree species with xylem ray paren-chyma cells that are supercooled at subfreezing temperatures than from those with xylem parenchyma cells that were not supercooled. A seasonal variation in the relationship between freeze–thaw-induced UAEs and temperature, which may be attributed to the winter acclimation of parenchyma cells, was also observed for walnut trees (Charrier et al., 2014).
In this study, UAEs were generated only in the freezing process during freeze–thaw cycles regardless of the tempera-ture regime (Figs 2, 5A; Supplementary Figs S1–S3 at JXB online). This trend also applies to UAEs with energy >10.0 fJ, which probably originated from cavitation events in ves-sels (see Table 4). Similar results in which UAE generation was observed only during freezing have been reported for coniferous trees (Mayr et al., 2007; Mayr and Zublasing, 2010) and other angiosperm trees (Raschi et al., 1989; Kikuta and Richter, 2003; Charrier et al., 2014). These results seem to contradict the current thaw–expansion hypothesis for freeze–thaw-induced embolism formation (Davis et al., 1999; Lemoine et al., 1999; Utsumi et al., 1999; Hacke and Sperry,
2001; Cruiziat et al., 2002; Pittermann and Sperry, 2003).
The hypothesis states that small gas bubbles form in water conduits because of the lower solubility of gas in ice when the sap freezes (Sevanto et al., 2012). These bubbles would expand when the pressure of the surrounding sap becomes sufficiently negative to counter the bubble-collapsing force of surface tension during thawing (Cruiziat et al., 2002). The generation of UAEs should therefore be expected in both freezing and thawing processes as the formation of gas bubbles and expansion of these bubbles releases tension in the water column. However, given the manner of UAE gen-eration, cavitation events (formation of gas bubbles) might occur during freezing with the generation of UAEs, whereas embolism (i.e. the complete filling of conduits with air) takes place on thawing without the generation of UAEs (Kikuta and Richter, 2003). Furthermore, the difference in ψ at the interface between supercooled water and frozen ice might induce air-seeding from air-filled spaces, releasing vessel ten-sion (Mayr et al., 2007). For pure water, the difference in ψ between supercooled water and ice corresponds to approxi-mately –5 MPa at –5 °C (Hansen and Beck, 1988). This ten-sion, much lower than the vulnerability threshold (ψ50) of walnut vessels (–2.0 MPa; Fig. 3), might displace the air–water menisci in xylem pits (Charrier et al., 2014). The different manners of UAE generation from saturated sample segments of walnut versus coniferous trees may reflect the occurrence of air-seeding in angiosperm species. Walnut branch seg-ments emitted a considerable amount of UAEs even without significant tension (Fig. 4A), as was also observed in rachides
of walnut (Kikuta and Richter, 2003). In contrast, few or no UAEs were observed from saturated twigs of coniferous trees during freeze–thawing (Mayr et al., 2007; Mayr and Sperry, 2010; Mayr and Zublasing, 2010). Even when xylem conduits are full, there are more air-filled spaces such as the pith and empty fibres in the xylem for angiosperm species than for conifers. Anatomical properties of angiosperm xylem can facilitate air-seeding. Finally, the results presented here are in agreement with the recently published hypothetical mecha-nism of freeze–thaw-induced embolism formation (Charrier
et al., 2014). Combinatorial studies of UAE analyses and other assessments, such as centrifuge experiments (Mayr and Sperry, 2010), X-ray tomography (Charra-Vaskou et al.,
2012a; Brodersen et al., 2013; Suuronen et al., 2013), and
magnetic resonance imaging (Holbrook et al., 2001), would further clarify freeze–thaw-induced embolism formation.
Supplementary data
Supplementary data are available at JXB online.
Figure S1. Ultrasonic acoustic emission (UAE) genera-tion from a walnut branch segment dehydrated to a water potential (ψ) of –1.6 MPa during 15 cycles of freeze–thawing between 5 °C and –10 °C
Figure S2. Ultrasonic acoustic emission (UAE) genera-tion from a walnut branch segment dehydrated to a water potential (ψ) of –1.6 MPa during one cycle of freeze–thawing between 5 °C and –25 °C.
Figure S3. Ultrasonic acoustic emission (UAE) generation from a walnut branch segment dehydrated to a water poten-tial (ψ) of –1.6 MPa during stepwise freeze–thawing.
Figure S4. Relationdhip between cumulative number of ultrasonic acoustic emissions (UAEs) and percentage loss of hydraulic conductivity (PLC) induced by one freeze–thaw cycle.
Acknowledgements
This work was partly supported by the Institut National de la Recherche Agronomique (INRA)—Department of Agronomy and Environment, a post-doctoral grant from Blaise Pascal University (Clermont II), and a Grant-in-Aid from the Japan Society for the Promotion of Science (22–5901 to JK). This project was also funded by the French and Austrian research agencies (ANR and FWF) in the project I826-B25 ‘Acoufreeze’. The authors thank Mr C. Bodet and Mr C. Serre (INRA UMR-PIAF) for technical assistance. We would like to thank the two anonymous reviewers for their comments and suggestions on the first draft that greatly improved this manuscript.
References
Améglio T, Bodet C, Lacointe A, Cochard H. 2002. Winter embolism, mechanism of xylem hydraulic conductivity recovery and springtime growth patterns in walnut and peach trees. Tree Physiology 22, 1211–1220.
Ball MC, Canny MJ, Huang CX, Egerton JJG, Wolfe J. 2006. Freeze/thaw-induced embolism depends on nadir temperature: the heterogeneous hydration hypothesis. Plant, Cell and Environment 29, 729–745.
Brodersen CR, McElrone AJ, Choat B, Lee EF, Shackel KA, Matthews MA. 2013. In vivo visualizations of drought-induced embolism spread in Vitis vinifera. Plant Physiology 161, 1820–1829.
Canny MJ. 1997. Vessel contents during transpiration: embolisms and refilling. American Journal of Botany 84, 1223–1230.
Charra-Vaskou K, Badel E, Burlett R, Cochard H, Delzon S, Mayr S. 2012a. Hydraulic efficiency and safety of vascular and non-vascular components in Pinus pinaster leaves. Tree Physiology 32, 1161–1170. Charra-Vaskou K, Charrier G, Wortemann R, Beikircher B, Cochard H, Améglio T, Mayr S. 2012b. Drought and frost resistance of trees: a comparison of four species at different sites and altitudes. Annals of Forest
Science 69, 325–333.
Charrier G, Améglio T, Cochard H. 2013. Evaluation of the impact of frost resistances on potential altitudinal limit of trees. Tree Physiology 33, 891–902.
Charrier G, Charra-Vaskou K, Kasuga J, Cochard H, Mayr S, Améglio T. 2014. Freeze–thaw stress. Effects of temperatures on hydraulic conductivity and ultrasonic activity in ten woody angiosperms.
Plant Physiology 164, 992–998.
Cochard H, Peiffer M, Le Gall K, Granier A. 1997. Developmental control of xylem hydraulic resistances and vulnerability to embolism in
Fraxinus excelsior L.: impacts on water relations. Journal of Experimental
Botany 48, 655–663.
Cruiziat P, Cochard H, Améglio T. 2002. Hydraulic architecture of trees: main concepts and results. Annals of Forest Science 59, 723–752. Davis SD, Sperry JS, Hacke UG. 1999. The relationship between xylem conduit diameter and cavitation caused by freezing. American Journal of
Botany 86, 1367–1372.
Dixon HH. 1914. Transpiration and the ascent of sap in plants . London: MacMillan, 81–100.
Domec JC, Gartner BL. 2002. How do water transport and water storage differ in coniferous earlywood and latewood? Journal of
Experimental Botany 53, 2369–2379.
Ewers F. 1985. Xylem structure and water conduction in conifer trees, dicot trees, and lianas. IAWA Bulletin 6, 309–317.
Fujikawa S, Kuroda K. 2000. Cryo-scanning electron microscopic study on freezing behavior of xylem ray parenchyma cells in hardwood species.
Micron 31, 669–686.
Fukami R, Yamamoto K, Okushima L, Kuriyama A, Ishikawa M. 2011. Deep supercooling and freezing behaviors in the leaf blade and leaf sheath of a cold hardy bamboo, Sasa kurilensis, analyzed using cryomicroscopy. Cryobiology and Cryotechnology 57, 71–76 (in Japanese).
Hacke U, Sauter JJ. 1995. Vulnerability of xylem to embolism in relation to leaf water potential and stomatal conductance in Fagus sylvatica f. purpurea and Populus balsamifera. Journal of Experimental Botany 46, 1177–1183. Hacke UG, Sperry JS. 2001. Functional and ecological xylem anatomy.
Perspectives in Plant Ecology, Evolution and Systematics 4, 97–115.
Hansen J, Beck E. 1988. Evidence for ideal and non-ideal equilibrium freezing of leaf water in frost hardy ivy (Hedera helix) and winter barley (Hordeum vulgare). Botanica Acta 101, 76–82.
Hietz P, Rosner S, Sorz J, Mayr S. 2008. Comparison of methods to quantify loss of hydraulic conductivity in Norway spruce. Annals of Forest
Science 65, 502.
Holbrook NM, Ahrens ET, Burns MJ, Zwieniecki MA. 2001. In vivo observation of cavitation and embolism repair using magnetic resonance imaging. Plant Physiology 126, 27–31.
Hölttä T, Vesala T, Nikinmaa E, Perämäki M, Siivola E, Mencuccini M. 2005. Field measurements of ultrasonic acoustic emissions and stem diameter variations. New insight into the relationship between xylem tensions and embolism. Tree Physiology 25, 237–243.
Ikeda T, Ohtsu M. 1992. Detection of xylem cavitation in field-grown pine trees using the acoustic emission technique. Ecological Research 7, 391–395.
Jackson GE, Grace J. 1996. Field measurements of xylem cavitation: are acoustic emissions useful? Journal of Experimental Botany 47, 1643–1650.
Jackson GE, Irvine J, Grace J. 1999. Xylem acoustic emissions and water relations of Calluna vulgaris L. at two climatological regions of Britain. Plant Ecology 140, 3–14.
Johnson DM, Meinzer FC, Woodruff DR, Mcculloh KA. 2009. Leaf xylem embolism, detected acoustically and by cryo-SEM, corresponds to
decreases in leaf hydraulic conductance in four evergreen species. Plant,
Cell and Environment 32, 828–836.
Kikuta, S. 2003. Ultrasound acoustic emissions from bark samples differing in anatomical characteristics. Phyton 43, 161–178.
Kikuta SB, Richter H. 2003. Ultrasound acoustic emissions from freezing xylem. Plant, Cell and Environment 26, 383–388.
Kuroda K, Ohtani J, Kubota M, Fujikawa S. 1999. Seasonal changes in the freezing behavior of xylem ray parenchyma cells in four boreal hardwood species. Cryobiology 38, 81–88.
Langan SJ, Ewers FW, Davis SD. 1997. Xylem dysfunction caused by water stress and freezing in two species of co-occurring chaparral shrubs.
Plant, Cell and Environment 20, 425–437.
Larcher W. 1995. Physiological plant ecology: ecophysiology and stress
physiology of functional groups . Berlin: Springer-Verlag.
Lemoine D, Granier A, Cochard H. 1999. Mechanisms of freeze-induced embolism in Fagus sylvatica L. Trees 13, 206–210.
Levitt J. 1972. Responses of plants to environmental stresses . New York: Academic Press.
Lo Gullo MA, Salleo S. 1991. Three different methods for measuring xylem cavitation and embolism: a comparison. Annals of Botany 67, 417–424. Lo Gullo MA, Salleo S. 1993. Different vulnerabilities of Quercus ilex L. to freeze- and summer drought-induced xylem embolism: an ecological interpretation. Plant, Cell and Environment 16, 511–519.
Mayr S, Cochard H. 2003. A new method for vulnerability analysis of small xylem areas reveals that compression wood of Norway spruce has lower hydraulic safety than opposite wood. Plant, Cell and Environment 26, 1365–1371.
Mayr S, Cochard H, Améglio T, Kikuta SB. 2007. Embolism formation during freezing in wood of Picea abies. Plant Physiology 143, 60–67. Mayr S, Rosner S. 2011. Cavitation in dehydrating xylem of Picea abies: energy properties of ultrasonic emissions reflect tracheid dimensions. Tree
Physiology 31, 59–67.
Mayr S, Schmid P, Laur J, Rosner S, Charra-Vaskou K, Dämon B, Hacke UG. 2014. Uptake of water via branches helps timberline conifers refill embolized xylem in late winter. Plant Physiology 164, 1731–1740. Mayr S, Schwienbacher F, Bauer H. 2003. Winter at the alpine timberline. Why does embolism occur in Norway spruce but not in stone pine? Plant Physiology 131, 780–792.
Mayr S, Sperry J. 2010. Freeze–thaw-induced embolism in Pinus
contorta: centrifuge and ultrasonic experiments validate the
‘thaw-expansion hypothesis’ but conflict with ultrasonic emission data. New
Phytologist 185, 1016–1024.
Mayr S, Wieser G, Bauer H. 2006. Xylem temperatures during winter in conifers at the alpine timberline. Agricultural and Forest Meteorology 137, 81–88.
Mayr S, Zublasing V. 2010. Ultrasonic emissions from conifer xylem exposed to repeated freezing. Journal of Plant Physiology 167, 34–40. McCulloh KA, Johnson DM, Meinzer FC, Lachenbruch B. 2011. An annual pattern of native embolism in upper branches of four tall conifer species. American Journal of Botany 98, 1007–1015.
Neuner G, Xu B, Hacker J. 2010. Velocity and pattern of ice propagation and deep supercooling in woody stems of Castanea sativa, Morus nigra and Quercus robur measured by IDTA. Tree Physiology 30, 1037–1045. Ogaya R, Peñuelas J. 2007. Seasonal ultrasonic acoustic emissions of Quercus ilex L. trees in a Mediterranean forest. Acta Physiologiae
Plantarum 29, 407–410.
Parker J. 1963. Cold resistance in woody plants. Botanical Review 29, 123–201.
Perks MP, Irvine J, Grace J. 2004. Xylem acoustic signals from mature Pinus
sylvestris during an extended drought. Annals of Forest Science 61, 1–8.
Pittermann J, Sperry J. 2003. Tracheid diameter is the key trait determining the extent of freezing-induced embolism in conifers. Tree
Physiology 23, 907–914.
Pockman WT, Sperry JS. 1997. Freezing-induced xylem cavitation and the northern limit of Larrea tridentata. Oecologia 109, 19–27.
Ponomarenko A, Vincent O, Pietriga A, Cochard H, Badel É, Marmottant P. 2014. Ultrasonic emissions reveal individual cavitation bubbles in water-stressed wood. Journal of the Royal Society Interface 11, 20140480.
Pratt RB, Ewers FW, Lawson MC, Jacobsen AL. 2005. Mechanisms for tolerating freeze–thaw stress of two evergreen chaparral species: Rhus
ovata and Malosma laurina (Anacardiaceae). American Journal of Botany
92, 1102–1113.
Raschi A, Scarascia Mugnozza G, Surace R, Valentini R, Vazzana C. 1989. The use of ultrasound technique to monitor freezing and thawing of water in plants. Agriculture, Ecosystems and Environment 27, 411–418. Ristic Z, Ashworth EN. 1994. Response of xylem ray parenchyma cells of red osier dogwood (Cornus sericea L.) to freezing stress: microscopic evidence of protoplasm contraction. Plant Physiology 104, 737–746. Rockwell FE, Wheeler JK, Holbrook NM. 2014. Cavitation and its discontents: opportunities for resolving current controversies. Plant
Physiology 164, 1649–1660.
Rosner S, Klein A, Wimmer R, Karlsson B. 2006. Extraction of features from ultrasound acoustic emissions: a tool to assess the hydraulic vulnerability of Norway spruce trunkwood? New Phytologist 171, 105–116. Sakai A, Larcher W. 1987. Frost survival of plants: responses and
adaptation to freezing stress . Berlin: Springer-Verlag.
Sevanto S, Holbrook NM, Ball MC. 2012. Freeze/thaw-induced embolism: probability of critical bubble formation depends on speed of ice formation. Frontiers in Plant Science 3, 107.
Sperry JS, Donnelly JR, Tyree MT. 1988. Seasonal occurrence of xylem embolism in sugar maple (Acer saccharum). American Journal of Botany 75, 1212–1218.
Sperry JS, Sullivan JEM. 1992. Xylem embolism in response to freeze– thaw cycles and water stress in ring-porous, diffuse-porous, and conifer species. Plant Physiology 100, 605–613.
Suuronen JP, Peura M, Fagerstedt K, Serimaa R. 2013. Visualizing water-filled versus embolized status of xylem conduits by desktop x-ray microtomography. Plant Methods 9, 11.
Tyree MT, Sperry JS. 1989. Characterization and propagation of acoustic emission signals in woody plants: towards an improved acoustic emission counter. Plant, Cell and Environment 12, 371–382.
Utsumi Y, Sano Y, Fujikawa S, Funada R, Ohtani J. 1998. Visualization of cavitated vessels in winter and refilled vessels in spring in diffuse-porous trees by cryo-scanning electron microscopy. Plant Physiology 117, 1463–1471.
Utsumi Y, Sano Y, Funada R, Fujikawa S, Ohtani J. 1999. The progression of cavitation in earlywood vessels of Fraxinus mandshurica var
japonica during freezing and thawing. Plant Physiology 121, 897–904.
Vogt KU. 2001. Hydraulic vulnerability, vessel refilling, and seasonal courses of stem water potential of Sorbus aucuparia L. and Sambucus
nigra L. Journal of Experimental Botany 52, 1527–1536.
Weiser RL, Wallner SJ. 1988. Freezing woody plant stems produces acoustic emissions. Journal of the American Society for Horticultural
Science 113, 636–639.
Wheeler JK, Huggett BA, Tofte AN, Rockwell FE, Holbrook NM. 2013. Cutting xylem under tension or supersaturated with gas can generate PLC and the appearance of rapid recovery from embolism. Plant,
Cell and Environment 36, 1938–1949.
Wolkerstorfer SV, Rosner S, Hietz P. 2012. An improved method and data analysis for ultrasound acoustic emissions and xylem vulnerability in conifer wood. Physiologia Plantarum 146, 184–191.
Xin Z, Browse J. 2000. Cold comfort farm: the acclimation of plants to freezing temperatures. Plant, Cell and Environment 23, 893–902. Yamazaki T, Kawamura Y, Minami A, Uemura M. 2008. Calcium-dependent freezing tolerance in Arabidopsis involves membrane resealing via synaptotagmin SYT1. The Plant Cell 20, 3389–3404.