DOCUMF1NT
SToZ0T0tT ROOM
36-4-2RES',.ARCH LA'.R"?ATCRY OF ELECTRONICS --MASSACHUU.'I TTS INSTITUTE OF TECHNOLOGY CAMBgIDGE 89, MASSACHUSETTS, U.S.A.
AVERAGE RESPONSES TO CLICKS IN MAN
RECORDED BY SCALP ELECTRODES
CHRIS DANIEL GEISLER
TECHNICAL REPORT 380
NOVEMBER 4, 1960
r.W
I ory!,
MASSACHUSETTS INSTITUTE OF TECHNOLOGY
RESEARCH LABORATORY OF ELECTRONICS
CAMBRIDGE, MASSACHUSETTS
#5
_
The Research Laboratory of Electronics is an interdepartmental laboratory of the Department of Electrical Engineering and the Department of Physics.
The research reported in this document was made possible in part by support extended the Massachusetts Institute of Technology, Research Laboratory of Electronics, jointly by the U. S. Army (Sig-nal Corps), the U.S. Navy (Office of Naval Research), and the U.S. Air Force (Office of Scientific Research, Air Research and Develop-ment Command), under Signal Corps Contract DA36-039-sc-78108, Department of the Army Task 3-99-20-001 and Project 3-99-00-000.
MASSACHUSETTS INSTITUTE OF TECHNOLOGY RESEARCH LABORATORY OF ELECTRONICS
Technical Report 380 November 4, 1960
AVERAGE RESPONSES TO CLICKS IN MAN RECORDED BY SCALP ELECTRODES
Chris Daniel Geisler
Submitted to the Department of Electrical Engineering, M. I. T., October 29, 1960 in partial fulfillment of the requirements for the degree of Doctor of Science.
Abstract
Electric potentials were recorded from scalp electrodes in response to different sensory stimuli and, in particular, to clicks. These electric responses are usually too small to be detected in the electroencephalogram. The use of an average-response computer enables us to study those components of the responses that are time-locked to the delivery of sensory stimuli. The present study deals with the characterization of average responses to acoustic-click stimuli in man. These responses were compared
with evoked responses in subhuman species, and tentatively identified as "secondary" responses.
First, we investigated the effects of the biological structures that separate the brain from a recording site on the scalp. We concluded that average responses recorded on the scalp reflect average responses that can be recorded on the cortex directly beneath.
Then, we investigated various characteristics of average responses to clicks. We deter-mined the places on the scalp from which these responses can be recorded and the changes in the waveform of the average responses that occur as a function of changes in stimulus parameters. Our findings parallel certain findings on click responses obtained from the cortex of experimental animals.
In a series of control experiments, we eliminated the possibility that the average responses that we recorded from human scalp were produced by generators outside the brain.
We conclude that the average click responses obtained from the human scalp are probably "secondary" cortical responses. This conclusion is based, in part, on two
series of experiments: One in which the effects of multisensory stimulation were inves-tigated, and another in which the effects of sleep upon average responses to clicks were studied.
The last section of this report contains data obtained from two )es of experiment in which these responses were related to the performance of certa,, sensory tasks. In the first type, the responses became detectable at stimulus intensities close to the subject's absolute "psychophysical threshold." In the second type, the amplitude and
waveform of these average responses were found to remain essentially invariant, regard-less of whether the subject was performing a specific auditory or visual task.
TABLE OF CONTENTS
GLOSSARY v
I. INTRODUCTION: EVOKED RESPONSES RECORDED FROM
MAMMALIAN BRAINS 1
1. 1 Evoked Responses Recorded from the Cerebral Cortex of the Cat 2 a. Evoked Responses Recorded under Deep Barbiturate Anesthesia 2 b. Characteristics of Click Responses Obtained from the Cat's
Auditory Projection Cortex 4
c. Evoked Responses Recorded from Other than Projection
Areas of the Cortex 8
1. 2 Evoked Responses Recorded from the Cerebral Cortex of
Mammals Other than the Cat 10
1.3 Evoked Responses Recorded from Man 13
1.4 The Purpose of this Study 15
II. ELECTRIC POTENTIALS RECORDED FROM THE SCALP 17
2. 1 Mathematical Model of Electric Potentials Existing in the Head 18
a. Formulation of the Model 18
b. Calculation of Potential Fields 22
2. 2 Experimental Investigation of Electric Potentials Existing in the Head 23
a. Experimental Design 24
b. Experimental Results 25
2.3 Conclusion 28
III. BASIC EXPERIMENTAL AND DATA-PROCESSING TECHNIQUES 31
3. 1 Basic Experimental Techniques 31
a. Basic Equipment 31
b. Basic Experimental Procedure 36
3.2 Basic Data-Processing Technique: Averaging 37
a. A Mathematical Model for Averaging 37
b. Experimental Test of the Model 41
c. Conclusion: Appropriateness of the Model 47
IV. AVERAGE RESPONSES TO CLICKS OBTAINED FROM HUMAN
SCALP 48
4. 1 Average Responses Recorded from Different Electrode
Locations on the Human Scalp 50
4. 2 Changes in the Average Responses Caused by Variation of
Stimulus Parameters 74
a. Average Responses as a Function of Click Intensity 75 b. Average Responses as a Function of Repetition Rate 82
4.3 Summary 90
CONTENTS
V. CONTROL EXPERIMENTS 92
5. 1 Demonstration of the Electrophysiological Nature of
the 30-msec Response Components 92
5. 2 Elimination of Scalp Musculature as the Source of the
30-msec Response Components 95
5. 3 Elimination of Distant Electrophysiological Sites as the
Source of the 30-msec Response Components 98
5.4 Conclusion 99
VI. THE NATURE OF THE AVERAGE CLICK RESPONSES
OBTAINED FROM THE HUMAN SCALP 101
6. 1 Average Responses to Multisensory Stimuli 101
a. Average Responses to Shock Stimuli 102
b. Average Responses to Pairs of Clicks 107
c. Average Responses to Shock-Click Pairs 109
d. Average Responses to Other Types of Multisensory
Stimuli 123
e. Summary 125
6.2 Average Responses to Clicks Presented During Natural Sleep 126 a. Potentials Recorded from the Scalp of Sleeping Subjects 126
b. Design of Experiments 127
c. Experimental Results 134
d. Summary 137
6.3 Conclusion 137
VII. AVERAGE RESPONSE CORRELATES OF SENSORY PERFORMANCE
IN MAN 139
7. 1 Measurement of Auditory Thresholds by Average Response
Techniques 141
a. Previous Electrophysiological Methods Used to Measure
Auditory Thresholds 141
b. Experimental Results Obtained in this Study 142 7. 2 Average Responses and Psychophysical "State" 144
a. Previous Electrophysiological Experiments 144
b. Experimental Results Obtained in this Study 145
7.3 Suggestions for Future Experiments 149
Appendix 151
Acknowledgment 153
References 154
GLOSSARY
Definition
Correlation Function The mathematical definition of the correlation func-tion R(T) is the expected value or statistical average of x(t) · X(t+T). The statistical average, in turn, is defined in terms of the whole ensemble of output waveforms that could be generated by the random process. However, the random process in the model in Section III generates not an ensemble of outputs, but only a single one. To obtain the auto-correlation function of this single output, we must make the ergodic hypothesis. That is, we assume that the wave shape under consideration is "typical"
of the random process outputs and that time aver-ages along the single sample output are the same as statistical averages computed on all possible
outputs of the random process. More specifically, we assume that
R(T) =E[x(t)x(t+T)] = lim T T/
T-oo -T/2
X(t)X(t+T) dt.
The abbreviation of electroencephalogram, is used in this study to refer to the electrical activity recorded with scalp electrodes, and is used inter-changeably with such expressions as "extracrani-ally recorded potentials" and "potentials recorded with scalp electrodes."
Electrophysiological Threshold
Evoked Response
Intensity Function
K-complex
Noise Level
The lowest intensity of sensory stimuli at which evoked "responses" (defined by the experimenter) are "consistently" (also defined by the experi-menter) detectable
Generally considered to be the electric potentials produced in a preparation (or subject) by the pres-entation of a stimulus to it
A graph presenting the amplitude of evoked responses as a function of stimulus intensity A monophasic, biphasic or triphasic evoked response recorded from human subjects that is characterized chiefly by its long onset latency (approximately 100 msec) and by the fact that it can be recorded from extensive portions of the scalp
A measure of the approximate peak-to-peak ampli-tude of the "ripple-voltage" component of an aver-age response, and hence a measure of the uncertainty in the amplitude of the average response. (See section 3. 2 for a more complete discussion.)
v Term
GLOSSARY (continued) Primary Response Psychophysical Threshold Secondary Response Sign Convention Spontaneous Activity Wide-sense Stationary Random Process
A response evoked by a single-modality stimulus in the corresponding "classical projection areas" of the cortex
The lowest intensity of sensory stimuli at which a human subject "consistently" (defined by the experi-menter) reports that he is able to detect the stim-uli. Actual values of psychophysical threshold to clicks given in this study are based on measure-ments taken once (or several times) during an eight-month period (the method is described in section 3. 1)
Also called "widespread response," a response evoked by a single-modality stimulus in cortical areas other than the corresponding projection areas (See section 1. c.)
A change in recorded electric potential for which the active electrode is negative with respect to the reference electrode is plotted upwards in all figures in this study (except for Fig. 19).
Electric activity that exists in the absence of delib-erate sensory stimulation. In the model used for average responses recorded from human scalp (see section 3. 2), the spontaneous activity was assumed to be completely independent of deliberate sensory stimulation.
A random process whose sample functions have a time-invariant mean and variance, even though the probability density may change with time. See Communications Biophysics Group of Research Laboratory of Electronics and W. M. Siebert (87) for a brief introductory treatment of random proc-esses and suggested readings.
vi
I. INTRODUCTION: EVOKED RESPONSES RECORDED FROM MAMMALIAN BRAINS
The electrical behavior of the nervous systems of the higher mammals has been under extensive investigation since cathode-ray oscilloscopes came into widespread use. The early experimenters recorded this electrical activity with rather large electrodes from animals that were deeply anesthetized and surgically prepared. The experimental procedures have been gradually refined so that at the present time experimeters can record the activity of single cells with implanted microelectrodes while the host animal
is awake and alert.
The extension of these techniques to human subjects, obviously, has been restricted and only very limited intercranial investigations have been carried out on humans. As a natural consequence, the activity recorded by electrodes located on the scalps of sub-jects has been the primary source of direct information about the electrical activity of the normal human brain. Usually, the recorded activity is so complex that specific
electrical events evoked by sensory stimuli are not observable and only the gross over-all patterns have been studied. However, with the development of new data-processing techniques, small response events evoked by specific stimuli may be consistently
detected in the EEG. It is these small response events recorded from the human scalp with which this study is concerned.
One difficulty in the interpretation of the EEG is that it is by no means clear just what activity of the brain has been recorded by the scalp electrodes. The separation of the scalp from the active sites means that no single point of the brain is very close to a scalp electrode. Rather, a considerable area of cortical surface is almost equidistant from such an electrode, a spatial arrangement which means that the potentials produced in an extended volume of the cortical mantle will be recorded at the scalp. In addition to cortically produced activity, subcortical activity may contribute to the EEG. Spread of electrical activity from other, more distant, parts of the body may also be a contri-buting factor. However, due to the fact that the cortex is much closer to the scalp than other parts of the brain, it is expected that cortically produced potentials will make up a preponderant part of the activity recorded by scalp electrodes. Also, since the corti-cal mantle essentially covers the rest of the brain, subcorticorti-cally produced potentials that are recordable at the scalp will also be recordable on the cortex. With the expecta-tion, then, that evoked potentials that can be recorded from the cortex will be reflected in the responses recorded from the scalp, let us turn our attention first to the cortex. Because of the known similarities between the cortices of man and other mammals, such as the cat and the monkey, the many experiments performed on the cortices of these experimental animals are of great interest and provide a natural starting point for this investigation. Since acoustic stimuli were employed almost exclusively in this study, we shall concentrate our attention upon the experiments involving responses evoked by auditory stimuli.
1. 1 EVOKED RESPONSES RECORDED FROM THE CEREBRAL CORTEX OF THE CAT The extent of cerebral cortex associated with the auditory system is not clearly understood. Different investigators have described different cortical regions and sub-regions as being related to auditory and other types of stimuli; these descriptions depend upon the particular treatment of the experimental animal. A schematic diagram of the cat's cortex as seen from the left side is shown in Fig. 1 and the cortical locations from which investigators have reported evoked responses to various types of sensory stimuli
are indicated in Fig. 2.
a. Evoked Responses Recorded under Deep Barbiturate Anesthesia
A typical experiment has been reported by Walzl and Woolsey (1). Examining cats under heavy pentobarbital anesthesia, they recorded click responses from a fairly well-localized region, bounded dorsally by the suprasylvian sulcus and extending in the ventral direction. This area is of particular interest because it contains most of the cortical projections of the medial geniculate body, a thalamic nucleus known to be of primary importance in the auditory system. Consequently, this cortical area, shown in Fig. 2, is sometimes referred to as the "auditory projection cortex." Other workers, using the
Fig. 1. Schematic diagram of the cerebral cortex of the cat showing the sulci and gyri.
2
AUDITORY PROJECTION AREAS
SUPRASYLVIAN AUDITORY AREA
M (MERLIS LOMBROSO )
1 A I
El SOMATIC AREAS
M VISUAL AREAS
C SECONDARY AUDITORY AREA
(BUSER)
M INTERACTION AREAS
Fig. 2. Schematic diagram of the cerebral cortex of the cat showing various regions from which evoked responses to sensory stimuli have been observed.
criterion of tonotopic organization, have further divided this region into two major areas, called AI and AII. Both of these auditory projection areas, however, constitute the locus of responsive cortex that is usually reported by workers using click stimuli. Kiang (2), using several different techniques, has shown that there are indeed functional differences between AI and AII, although his delineation of the two areas is different from that of most workers.
A second type of evoked response was reported in 1943 by Ades (3). After first mapping the responsive area to click stimuli, Ades put small patches of strychnine on this responsive area and subsequently observed responses in the posterior ectosylvian gyrus, an area that lies outside the responsive area that was first mapped. Usually, a still unresponsive area separated this strychnine-activated area, labeled "Ep" in Fig. 2, from the projection areas. In present usage, the term "classical auditory cortex"
usually refers to the combination of the three areas, AI, All, and Ep.
The area near the rostral tip of the anterior suprasylvian sulcus is characterized by sensitivity to both acoustic and somatic stimulation. It must also be noted that responses to excitation of the contralateral vestibular nerve may be recorded in this vicinity (4).
The fact that at least three separate types of stimuli can evoke responses from the same area has led some writers to differentiate it from the other auditory areas and to give it the special designation AIII (5) (not shown in Fig. 2).
Adrian (6) was among the first to record cortical potentials evoked by somatic stimuli. Under moderately deep anesthesia, induced by several chemical agents, he used touch, pressure, and movement to evoke electrical potentials. The locus of responsive points found by Adrian, as well as by others, is shown in Fig. 2 as areas
SI and SII. Analogously to what happens in the auditory system, the "primary somatic cortex" is not uniform in its responses. Very briefly, mechanical stimulation of the posterior parts of the animal's body gives largest responses in the rostral part of SI, while stimulation of the anterior parts of the body gives largest responses in the ventral portions of SI. The fact that SII contains a different somatotopic organization and that it is sometimes separated from SI by a band of unresponsive cortex has justified its separate designation.
The cortex of deeply anesthetized animals has also been examined for responses to light flashes. Marshall, Talbot, and Ades (7) outlined the "visual areas" shown in Fig. 2 as responsive to brief light flashes. In addition, they note a localized responsive area bordering on the suprasylvian sulcus. Doty (8), also recording from cats anesthetized with nembutal, recorded responses over essentially the same areas found by Marshall. Also, Doty subdivides the total responsive area on the basis of differences in waveform and latency of the evoked responses.
b. Characteristics of Click Responses Obtained from the Cat's Auditory Projection Cortex
Responses to click stimuli may be recorded from the cat's auditory projection areas by means of a wire electrode placed on the surface of the cortex. An evoked response, recorded by just such an electrode, is shown in Fig. 3. This response, which was
C
D
Fig. 3. Tracing of a typical response obtained from the auditory projection areas of the cat. The beginning of the trace marks the time of the stimulus: B, C and D are the peaks usually observed. The relative sizes of the three peaks vary from location to location on the cortex. (After J. Macy, Jr. (9); from data by M. Rosenzweig.)
evoked by an acoustic click (10), is typical of click responses that may be recorded from the auditory projection areas of the cat. The most characteristic deflection of the
response is the large surface-positive deflection labeled "C". [The responses are necessarily recorded between two electrodes. For "monopolar" recordings, one
4
·i
electrode is located on the surface of the cortex and the other in a distant location. Hence, the electrical polarity of the various deflections in the cortical responses is with respect to this distant electrode, termed simply the reference electrode. "Bipolar" records, on the other hand, are recorded from two closely spaced electrodes.] The amplitude of deflection "C" may vary over wide ranges, the variation depending on the experimental conditions, but its latency, measured to the peak, is usually found to be between 8 msec and 15 msec. The negative deflection which follows, labeled "D", is much more variable in nature than the initial positive deflection and may have very dif-ferent sorts of waveforms; under some experimental conditions it may not even be present. The diphasic waveform composed of components C and D together is what is usually referred to as the "diphasic" click response. The initial negative deflection, labeled "B" in Fig. 3, is quite small and is not always detectable.
The characteristics of these responses to auditory clicks have been well described by such workers as Bremer (11). He has utilized many different experimental tools to
explore the nature of the electrically active sites that produce these responses. He has applied minute quantities of strychnine to the surface of the cortex, for example, and observed a remarkable increase in the amplitudes of both the initial surface-positive deflection and the following negative deflection. Since the direct effect of the strychnine was, presumably, confined to a small volume of the cortical mantle, it is suggested that the sites producing these augmented responses are located in the same volume and hence in the cortical mantle. Other techniques, such as thermocoagulation of cortical volumes and resection of the cortical mantle, were also carried out by Bremer, and led him to the conclusion that "the two components of the diphasic surface-responses of the unanes-thetized acoustic area are both the expression of the reaction of cortical elements to the
different impulses streaming from the thalamus" (11).
The waveforms of the cortical responses evoked by repetitions of identical click stimuli are not identical: Although the corresponding components of the various
responses may have approximately the same latencies, the amplitudes are often quite different (12). To describe these responses, various statistics concerning the size of the cortical responses evoked under differing experimental conditions have been
com-piled. Harris (13), in one study, measured the amplitude and latency of the surface-positive deflections of responses evoked by slowly repeated clicks of various intensities. Two curves constructed from her data are shown in Fig. 4. Both the amplitude and latency of the surface-positive deflection of the click responses are plotted as functions of click intensity. From Fig. 4, we see that the amplitude of the responses evoked by 70-db clicks is quite small and that larger responses are evoked by more intense clicks. The response amplitude is seen to grow monotonically for the first 40 db above thresh-old ("threshthresh-old" is defined here as the stimulus intensity at which the experimenter can detect visually the presence of the evoked response 50 per cent of the time), but above 40 db the amplitude of the responses does not reflect a further increase in click inten-sity. Response latency, measured to the peak of the positive deflection, is also shown
U E 2 w 0 IL w U) 2 w IL 4 0 z 4 w W _J 4 W Z -C 0 W 15 10 W 0 Z 4 5 · 13 70 60 50 40 30 20 10 0
STIMULUS INTENSITY IN DB BELOW CLICK REFERENCE LEVEL
Fig. 4. Amplitude and peak latency of the surface-positive component of click responses. These responses were recorded from the auditory projection cortex of an anesthetized cat. Each point is the median value of 15 con-secutive responses. The stimuli were separated by time intervals of several seconds. Monopolar recording. (After W. A. Rosenblith (14); from data by K. S. Harris (13)).
for various click intensities. Essentially constant at the higher intensities, the latency increases appreciably when the stimulus intensity approaches threshold value.
Measurements have also been made on responses evoked by more rapidly repeated stimuli. W. D. Keidel, U. O. Keidel, Kiang, and Frishkopf (15) presented clicks at the rate of 10 per second and recorded responses from the auditory projection area. In cats anesthetized with Dial anesthesia, they found that the responses to the initial clicks of
a click train had larger amplitudes than "steady-state" responses evoked by later clicks in the same train. They report that the surface-positive deflection of the steady-state responses had an average amplitude that increased with click intensity. In one of the two cats used, rapid growth of the average amplitude was limited to the first 30 db above threshold intensity.
The size of the evoked responses recorded by gross electrodes from the auditory areas of the cat has been interpreted by Goldstein and Kiang (16) as reflecting the degree
of synchrony of the contributing neural units. They added random noise to click stimuli and found that, as had been shown previously, the neural responses evoked by constant-intensity clicks, whether measured at the level of the auditory nerve or on the cortex, were reduced in amplitude as the intensity of the "masking" noise was increased. Now if the responses to clicks recorded by gross electrodes can be thought of as the
6
summated effect of synchronized responses evoked from many neural units, and if the noise can be thought of as evoking the responses of neural units in a random fashion, such experimental results would be expected. For since both clicks and random noise have wideband spectra, and hence presumably excite the same populations of neural units, a click in the presence of masking noise would evoke a synchronized response from fewer units that it would in the absence of the noise. As the noise intensity is
increased, more and more neural units would respond to the noise randomly and hence would not be free to contribute to a synchronized response. For very high noise levels, no detectable click response would be expected. The decrease, and eventual disappear-ance, of the click-response amplitude with increasing noise level, which was experi-mentally observed by Goldstein and Kiang, supports this interpretation. Certainly, the
response to masked clicks cannot be considered as the linear. combination of responses to clicks and to noise.
UO 100
, 80 ---- CAT 446 UNANESTHETIZED
80 " - --- CAT 446 DIAL ANESTHETIZED
n. CAT 459 UNANESTHETIZED
U X-X---- -- CAT 459 NEMBUTAL ANESTHETIZED
60
0
C~
~~LrCLICKS/SEC
Fig. 5. Relative peak-to-peak amplitudes of average responses evoked by repeated clicks plotted as a function of repetition rate before and after anesthetiza-tion by barbiturates. Recording is from concentric bipolar electrodes in the middle ectosylvian gyrus. Stimulus intensity, 35 db above threshold inten-sities observed at low rates; spinal sections were utilized for immobiliza-tion. (After M. H. Goldstein, Jr., N. Y-S. Kiang, and R. M. Brown (17)).
The fact that the steady-state responses found by Keidel and his co-workers were smaller than those evoked by the initial clicks of a train indicates that the time interval between successive clicks is an important stimulus parameter. Goldstein, Kiang, and Brown (17) have investigated this parameter by studying the responses that are evoked by repetitive click stimuli presented at various rates. Figure 5 shows the relative peak-to-peak amplitude of the average responses obtained by these workers. Although the amplitude of the average cortical response decreases with rate, detectable responses are obtained for rates as high as 100 per second in the anesthetized cat, and for rates as high as 200 per second in the unanesthetized cat.
as high as 200 per second in the unanesthetized cat.
c. Evoked Responses Recorded from Other than Projection Areas of the Cortex
Most of the experiments reported above were performed on cats that had been heavily anesthetized, usually through the use of barbiturates. In addition to immobilizing the animal, the anesthesia served the function of reducing the "spontaneous" activity of the cortex so that the evoked responses could be easily detected. In recent years, it has become apparent that depth of anesthesia not only changes the spontaneous acitivity, but has also a profound effect upon the evoked responses. Not only is the amplitude and waveform of the responses changeable with depth of anesthesia, as indicated in Fig. 5
(see also figures in Goldstein et al. (17)), but the extent of cortex from which responses can be recorded is also affected.
The effect of anesthesia upon the locus of responsive cortex is well illustrated by the experiments of Lombroso and Merlis (18). From a small area of the suprasylvian gyrus, shown in Fig. 2, these experimenters recorded responses having approximately the same amplitude and latency as those recorded from the auditory projection areas.
The distinctness of the two areas was indicated by a band of relatively unresponsive cor-tex that usually separated the two areas. The level and type of anesthesia was found to be of crucial importance. Under "light to moderate" Nembutal anesthesia, the
supra-sylvian responses were sometimes absent, although frequently seen. Under light Dial anesthesia, however, these responses were much more stable than they were under Nembutal. Increasing the depth of anesthesia, whether Dial or Nembutal was used, tended to abolish the suprasylvian responses. On the other hand, the responses recorded from the auditory projection areas were still observable under heavy anesthesia,
although somewhat diminished in amplitude. The distinctiveness of this suprasylvian area, as compared with the projection cortex, is further indicated by the fact that its responsiveness depended greatly upon the integrity of the contralateral cochlea. Unanesthetized-curarized and encdphale isold preparations also yielded responses from the suprasylvian cortex.
Recording from cats immobilized either by Flaxedil or by surgical sectioning of the brain stem or spinal cord, Desmedt and Mechelse (19) reported still another area that was responsive to acoustic clicks. This area, called AIV, lies ventral to the projection areas and is separated from them by an area of unresponsive cortex. The latency of the responses recorded in AIV was comparable with those recorded from the projec
-tion areas. In contrast to the projection cortex, however, area AIV also responded to light flashes, a fact that indicates that the areas probably have a difference in function.
It remained for Buser to demonstrate the true complexity of evoked response activ-ity. Using unanesthetized cats, immobilized by Flaxedil, Buser and Borenstein (20) recorded some sort of evoked potentials from virtually all over the convexity of the cor-tex, no matter whether somatic shocks, acoustic clicks, or light flashes were given as the stimuli. Buser's "secondary" responses (as he calls the responses from areas other than the projection areas) were found to be more variable in nature than the
"primary" responses (those recorded from the projection areas). The secondary responses usually had longer latencies and smaller amplitudes that the primary
responses. Moreover, it was found that barbiturate anesthesia depressed these second-ary responses, a fact that perhaps accounts for their omission in the reports of early investigators. Chloralose anesthesia, by contrast, was found to augment the secondary responses.
Buser and Borenstein also found that some cortical areas not only showed responses to the diverse stimuli employed, but exhibited clear interactions between the responses
evoked by stimuli of different sensory modalities. The distinctive nature of these inter-actions has led to a very important characterization of the various cortical areas. Not all of the areas that responded to different sensory stimuli showed an interaction between the responses, but only certain restricted areas. Under curarization, or light chloralose anesthesia, three interaction areas were delineated (see Fig. 2). The interaction area between the auditory and visual projection areas showed interaction between responses to click and flash stimuli; the area between the primary visual and somatic areas showed interplay between flash and shock responses; and the third area exhibited interactions between shock and click response. In the interaction areas, the cortical response to a particular stimulus was always greatly inhibited by a preceding stimulus of the comple-mentary modality. In the projection areas, however, the primary responses were little affected by preceding secondary responses, but reduced the amplitude of secondary responses that followed.
In a study in which chloralose anesthesia was used, Albe-Fessard and Rougeul (21) found further interesting results. Using electric shocks to various limbs as stimuli, they also recorded responses over a great deal of the cortical surface. Under deep chloralose, the secondary, or so-called nonspecific, responses were found to be largest in several discrete areas located along the suprasylvian gyrus and in the anterior lateral gyrus. In addition to having latencies that were 15-20 msec longer, the secondary poten-tials had essentially bilateral representation, with responses from symmetrical points on the two hemispheres being almost identical. This bilateralness was in clear contrast to the predominance of contralateral representation that existed in the primary somatic areas.
In another study of curarized, but unanesthetized, cat, Buser and Borenstein (22) found secondary click responses over a great deal of the suprasylvian gyrus (see Fig. 2). These secondary responses, bilateral in nature, had onset latencies that exceeded 15 msec; furthermore, the secondary responses were found to exhibit much greater variability than the responses recorded from the auditory projection areas. The largest secondary responses were seen under very light chloralose anesthesia and tended to disappear when the cortical activity showed "arousal" patterns resulting either from reticular stimulation or painful stimuli. Secondary responses were not detectable during patterns of electrocortical activity that corresponded presumably to "deep sleep," although the large amplitude of the spontaneous activity in that instance may simply have
9
obscured the responses. It is significant to point out that large secondary responses were also obtained when the electrocortical activity was classified as "awake" activity though not as "aroused." In contrast, the primary responses recorded during all of these changes in the animal's "state," showed much less variability.
Finally, in a very recent study of cats that had been deeply anesthetized with chloral-ose, Thompson and Sindberg (23) found acoustic-response fields on the somatic cor-tex, the anterior lateral gyrus, and the middle ectosylvian gyrus. Onset latencies of
15-30 msec characterized these secondary responses. Responses with much longer latencies were also recorded from part of the visual areas.
It is plain, then, from these many experiments, that the responses evoked by audi-tory stimuli from the cortex of the cat can be quite complex. Not only are responses of some sort recordable from almost all points on the cortical mantle, but various cortical areas exhibit different response characteristics. The functional significance of these different areas is obscure.
1.2 EVOKED RESPONSES RECORDED FROM THE CEREBRAL CORTEX OF MAMMALS OTHER THAN THE CAT
Acoustic responses have been obtained from the brains of many other animals besides the cat. Guinea pigs, dogs, and monkeys have been among the mammals investigated, and although the morphology of their cortices is quite different, similar responses have been obtained from homologous areas in each species. Mark (24) has recorded average responses evoked by click stimuli from the cortex of the anesthetized guinea pig. The largest responses were obtained from a fairly well-localized region of cortex and had essentially the same deflections as those shown in Fig. 3. A surface-positive peak with a latency of approximately 15 msec was followed by a large negative response. The amplitude of the response components varied with click intensity: A rapid increase in component amplitudes was found for the first 20-40 db above threshold intensities. Thus the intensity function of the anesthetized guinea pig is similar to that shown for the
anesthetized cat in Fig. 4. The addition of random noise reduced the amplitude of the responses evoked by clicks.
Tunturi (25) has recorded evoked responses from the cortex of the dog. Using vari-ous acvari-oustic stimuli, he recorded responses over a cortical area homologvari-ous to that of the auditory projection areas in the cat. Surface-positive response deflections that had onset latencies of approximately 10 msec were evoked by abrupt stimuli; a surface-negative deflection followed the positive one.
Let us now turn our attention to the monkey. The brain of the monkey is morpho-logically more similar to the human brain than are those of the other mammals. For instance, both the monkey brain and the human brain possess well-developed temporal lobes and concomitant Sylvian fissures.
Poliak (26) has shown that the monkey's medial geniculate body projects mainly to the rostral portions of the superior temporal gyrus. Only a few fibers reach the
10
Fig. 6. Schematic diagram of the cerebral cortex of the monkey showing the sulci and gyri.
(PRIBRAM, ROSNER a ROSENBLITH) POSTCENTRAL SOMATIC AREA SOMATIC AREAS (ALBE-FESSARD ET AL.)
Fig. 7. Schematic diagram of the cerebral cortex of the monkey showing various regions from which evoked responses to sensory stimuli have been observed.
11
convexity of the temporal lobe, most of them terminating in the superior temporal plane, the portion of the gyrus which lies within the Sylvian fissure (see Fig. 6).
As with the cat, acoustic responses may be recorded from the auditory projection area. Ades and Felder (27), using deep pentobarbital anesthesia, resected the subcen-tral gyrus and frontal operculum and found well-localized "diphasic " responses on the superior temporal gyrus. While the responsive locus described by these workers is limited to the superior temporal plane, it covers much less area than does Poliak's projection area.
As was found in the cat, the level and type of anesthesia used is a significant factor in the electrophysiological events that are recorded from a monkey's brain. Pribram, Rosner and Rosenblith (28), in addition to recording click responses from all surfaces bounding the Sylvian fissure, found responses on a widespread area of the cortical con-vexity, as shown in Fig. 7. Dial, administered in large doses, was the anesthetic used, and obviously it had quite a different effect upon the monkey's cortex than did Nembutal. The peak latencies of the first positive deflection of the responses recorded by Pribram and his co-workers varied from 12 msec to 27 msec, the shortest ones being recorded on or about the projection region. Kennedy (29) has also recorded similar responses under Dial anesthesia, but feels that the mechanism generating the widespread response is different from that generating responses in the projection areas. Her conclusion is based on the fact that the application of strychnine patches, the neural isolation of the piece of cortex recorded from, and even the removal of large portions of the projection area failed to greatly influence the widespread responses.
Responses evoked by somatic stimuli have also been recorded from the monkey's cortex. One of the first of such studies was reported by Woolsey, Marshall, and
Bard (30), who used deep pentobarbital anesthesia. Figure 7 shows the locus of cortex, labeled SI, from which they recorded responses to slight manipulations of the hairs and
skin of the whole body. A second responsive area, analogous to that found in the cat, was also found under barbiturate anesthesia (31). This area lies on the frontal opercu-lum of the Sylvian fissure.
As might be expected, when chloralose anesthesia is employed, responses to somatic stimuli may be recorded from a more extensive area of cortex. Albe-Fessard, Roche-Miranda, and Oswaldo-Cruz (32), using electric shock stimuli under chloralose, recorded responses from several places outside of the postcentral region, as shown in Fig. 7.
In addition to previously observed responses on the precentral gyrus, bilateral responses of short latency were recorded from an area, identified with area SII, lying partly on the superior temporal gyrus. "Nonspecific" responses were recorded from
both the superior frontal gyrus and the superior parietal gyrus and showed a bilateral representation that differed plainly from the predominantly contralateral representation observed in the postcentral somatic area. In addition, the nonspecific responses exhib-ited longer latencies than the responses recorded from the postcentral region.
It seems, therefore, safe to conclude that the limited response areas that have
12
0-previously been reported for the monkey's cortex are due, in part, to the use of anes-thetics like Nembutal which suppress widespread responses. The use of chloralose, at least for the somatic system, allowed the recording of bilateral responses from areas of the cortex outside of the postcentral region. It is well to remember that the non-specific, or secondary responses, had longer latencies than the primary responses.
Responses to sensory stimuli have thus been recorded from the cortices of many different mammals. The same diphasic response has been evoked in the auditory projec
-tion area of each species reported here: The first large deflec-tion is surface-positive with a peak latency of approximately 15 msec, and it is followed by a negative deflection. "Secondary" responses have also been recorded from widespread areas of the monkey's and cat's cortices.
1.3 EVOKED RESPONSES RECORDED FROM MAN
Experiments recording evoked responses directly from the human brain are limited in number and scope. Yet, in conjunction with surgical procedures, electrodes have been introduced into the brains of waking subjects (33). Chatrian, Petersen, and Lazarte (34), for example, have recorded with electrodes located within the brain. Using clicks, they recorded responses from monopolar electrodes located deep within the Sylvian fissure in five patients. A deflection with a peak latency of between 8 msec and 24 msec was the first component reported. It is noteworthy that this peak latency in human subjects does not differ appreciably from that reported for the initial positive deflection in experimental animals. Other components were found to follow the earliest deflections with more or less consistency.
Most investigators, however, find it impossible to record intracranially from human subjects. Fortunately, the intactness of a subject's skull and scalp does not prevent electrophysiological investigations of the activity of his brain. For when electrodes are placed on the scalp, potentials produced by brain tissue are observed between any pair of them.
This phenomenon is well known and various characteristics of the recorded poten-tials provide valuable clinical clues to the localization and nature of brain abnormalities.
Normally, the potentials are small, approximately 50-100 I1v (peak-to-peak), and it is, in general, difficult to determine the specific parts of the brain which generate them; but useful information has been gained from study of them.
As early as 1939, H. Davis, P. A. Davis, Loomis, Harvey, and Hobart (35) reported that auditory stimuli produced electric responses that could be recorded from the scalp of certain subjects. The usual response consisted of a deflection, negative with respect to the ear-lobes or mastoid, beginning 50-100 msec after the onset or cessation of a tone. This deflection was followed by a slower positive wave. As similar responses could also be evoked by light flashes and electric shocks, these responses were not con-sidered to reflect the activity of the auditory cortex directly. It was found that as the subject went to sleep, these responses, which were called "K-complexes," grew larger;
13
amplitudes as large as 100 itv were sometimes obtained.
However, the presence of the continual activity that is recorded by scalp electrodes, whether or not the subject is being stimulated deliberately, not only makes it difficult to characterize responses to specific stimuli, but may even prevent their detection. For, if electrical activity unrelated to the sensory stimuli presented is much greater than the responses evoked, the responses will not even be seen in the usual displays.
Various methods have been employed in an attempt to resolve small specific responses out of the more general EEG activity. Dawson (36) and others have attempted resolution of specific responses by photographic means. With this technique, extra-cranial potentials following each stimulus are recorded photographically. These indi-vidual photographs are then superimposed and the whole set of them re-photographed. Waveforms that consistently occur after each stimulus tend to "reinforce" themselves
on the photographic plate, and form heavy lines. Time-locked responses then become observable even in the midst of comparatively large amounts of unrelated activity. Time-locked responses have also been obtained by electronic averaging computers such as the
Average Response Computer built by Barlow (37). Digital averaging machines, one example of which is the ARC-1 (38), developed at Lincoln Laboratory, M. I. T., and in use, at present, in the Communications Biophysics Group, of the Research Laboratory of Electronics, M. I. T., are also being used to detect specific responses in the recorded EEG activity.
Using his photographic superposition technique, Dawson (36) succeeded in detecting extracranial responses to electric stimulation of the ulnar nerve. His responses were reported to be recordable from small regions of the scalp lying approximately over the central sulcus. Stimulation of the nerve, first at the wrist, and then at the elbow, resulted in a decrease in onset latency of 6 msec, a time interval that corresponds to the conduction time required for nerve pulses to travel from the wrist to the elbow. When the thigh was stimulated, the locus of responses shifted toward the midline, in accord with the accepted map of the somato-sensory cortex in man (39). For stimulation of the elbow, the response, 20 v with respect to a distant electrode, was initially positive with an average onset latency of 20 msec.
Bates (40), using the same photographic averaging technique, recorded extracranial responses beginning 20-35 msec after rapid hand movements. In another study, using the same technique, Larsson (41) systematically studied extracranially recorded responses to electric stimulation of the ulnar nerve. He found a well-localized response, onset latency approximately 20 msec, as well as a later, more widespread response with an onset latency of approximately 100 msec. The early response, identified with the activity of the sensory-motor cortex, was unaltered at stimulus rates up to 20 per second, whereas the later response disappeared for rates greater than 5 per second.
Responses of the visual system in man have also been recorded with the use of elec-trodes placed on the scalp. Cobb and Morton (42), using photographic averaging tech-niques, obtained responses to intense flashes from the occipital region of the scalp.
14
These responses had onset latencies of approximately 25 msec. Brazier (43), using an average response computer, obtained average responses to light flashes that were char-acterized by onset latencies of approximately 30 msec. Cobb and Dawson (44), also using an electronic averaging device, obtained average responses to brief flashes of high-intensity light from the occipital region. Here again, onset latencies of approxi-mately 25 msec were reported. Abe (45), extending Dawson's photographic averaging technique to the auditory system, reported click responses of relatively long latency from all over the human scalp.
One of the most interesting studies of average responses was done by Calvet and his co-workers (46). These investigators modulated the intensity of an oscilloscope trace by applying the potentials recorded from the scalp to the control grid of the cathode-ray tube. They used a standard sweep, triggered by the stimuli, and photographed each trace. The individual traces were then superimposed photographically and a photocell translated the intensities on the composite photograph into a line graph of amplitude vs time. Average responses to visual, somatic, and auditory stimuli were found in this way. The auditory responses that are of most interest here were recorded from
wide-spread locations on the scalp. The onset latencies were from 15 msec to 25 msec, and the amplitudes were found to grow with intensity. For rates of more than 2-3 per
sec-ond, the amplitude of these responses was reported to decrease.
Finally, average responses have been recorded from human scalp in our laboratory with the use of the ARC-1 computer (38). Using click stimuli, Geisler, Frischkopf, and
Rosenblith (47), have found widespread responses having a peak latency of approximately 30 msec. These responses were first detected near the subject's psychophysical thresh-old, and were found to vary in amplitude with the intensity and rate of the clicks.
1.4 THE PURPOSE OF THIS STUDY
The need for a systematic study of responses recorded from the human brain is clear. Since the use of intracranial electrodes is plainly out of the question, we have used the averaging technique, which provides us with the needed experimental tool whereby average evoked responses can be extracted from the potentials recorded with
scalp electrodes.
It is the purpose of this study to continue the investigation (47), already begun, into the characteristics of average responses evoked by various patterns of click stimuli. We have systematically manipulated such experimental parameters as electrode location,
and the rate and intensity of the click stimuli. The systematic changes in the average responses that were obtained under these differing conditions, although of interest in themselves, gain in significance when they are compared with responses obtained from
experimental animals. The primary aim of the present study, therefore, is the charac-terization of the average responses obtained from the human scalp and their
identifica-tion in terms of the responses that have been recorded from lower mammals.
Psychophysical data obtained from human subjects are plentiful but, because of
15
obvious difficulties, comparatively little is known about electrophysiological correlates of human sensory performance. However, the method of averaging provides a mean of obtaining evoked responses from normal, alert humans. To discover correlations that may exist between evoked-response data recorded from the scalp of a human subject and psychophysical data obtained from the same observer, is, therefore, a further aim of this study.
16
II. ELECTRIC POTENTIALS RECORDED FROM THE SCALP
The usefulness of electroencephalography stems from the fact that the electrical activity recorded from the scalp of human subjects reflects, in some sense, the activity of the brain beneath. Electrically active sites in the brain set up potential fields that, because of the finite conductivity of the brain and its physiological surroundings, extend even to the surface of the scalp. Yet electrodes on the surface of the scalp are sepa-rated from the active sites by the many layers of dura, skull, muscle and scalp. Unfor-tunately the effects of these layers, which have different conductivities, are little understood and it becomes difficult to specify the quantitative relationships between the potential fields recorded at the scalp and the fields that actually exist in the brain.
Some insight into the nature of the fields generated within the brain has been gained by the use of implanted electrodes. Many hospitals, in conjunction with treatment of certain patients, routinely record potentials from the depths of the human brain. Yet the electrical activity which is recorded is so complex in nature that it is difficult to interpret. First of all, it is difficult to specify the correlations that exist between poten-tials that are recorded from different electrodes within the brain. Second, even if such correlations could be found, the locus of active sites producing the correlated activity would be unknown.
Unlike most patients, however, those with certain types of epilepsy are well suited for an investigation of electrical fields set up in the head. The unique quality of the potentials recorded from these subjects is the presence of sporadic events that have huge, easily identifiable wave shapes. These events are of such magnitude that the fields set up by them may often be detected by quite distant electrodes. The measurement of the amplitude of such events at various places inside and on the head should provide an indication of the potential fields set up in the head by the active epileptic sites.
Abraham and Ajmone-Marsan (43) have conducted just such an investigation. Using subjects who had previously been diagnosed as "temporal lobe" epileptics, these experi-menters recorded simultaneously from electrodes located on the scalp, on the cortex
(extradural), and in the cortical depths.
Epileptic discharges were recorded from these various electrodes and compared with one another. Since "primary" epileptic discharges may cause "secondary" discharges
in other parts of the brain, it is necessary to exercise care in determining the potentials that are due simply to the fields of the primary discharges. Hence, taking care to
include only those epileptic abnormalities that were synchronously recorded from the various electrodes and were similar to one another in wave shape, these experimenters found that specific waveforms recorded from the scalp did indeed reflect cortical epi-leptic potentials when such activity was spread over an appreciable area of cortex. A ratio of 5 to 1 was often observed between the amplitudes recorded with cortical and scalp electrodes, but larger amplitude ratios were frequently seen. In fact, when the epileptic discharge was recorded from only one of two closely spaced cortical electrodes,
17
a fact that indicates a discharge sharply localized on the cortex, the potentials recorded from the scalp electrodes did not even show a corresponding event. These authors con-cluded that the extent of the area of cortex from which epileptic potentials may be recorded is an important determinant of the potential fields recorded at the scalp. They also recorded the epileptic events with depth electrodes and observed amplitudes com-parable with those of the corresponding events recorded from the scalp.
In other attempts to characterize the potential fields in the head, mathematical mod-els have been developed. Brazier (49) has used the model of a voltage dipole immersed in a sphere of homogeneous conducting material and has calculated the potential fields that exist on the surface of the sphere because of the presence of the dipole. Although clinically useful interpretations of scalp potentials have been gained by such models, their applicability is limited because the different layers overlying the brain have not been taken into account.
These studies have provided some insight into the nature of the electric fields existing within the heads of human subjects, but the information provided by scalp poten-tials about the electric fields existing within the heads of human subjects is still rudi-mentary.
This section deals with two different investigations that were undertaken to describe further the nature of the potential fields existing in the head. A mathematical model, which takes into account the different layers of conducting media surrounding the brain, will be presented first. Experimental data in the form of average evoked responses obtained from various locations in the heads of monkeys will then be reported and gen-eral conclusions drawn.
2. 1 MATHEMATICAL MODEL OF ELECTRIC POTENTIALS EXISTING IN THE HEAD
a. Formulation of the Model
In a mathematical description of the potential fields set up in the head the nature of the electrically active sites within the brain must first be known. Therefore, as a first step let us consider the electric generators located within the brain. And because the cortex is closest to the scalp, let us direct our attention to the generators located in the cortical mantle of the brain and neglect, for the moment, the midbrain and other under-lying structures.
The nature of the electrical activity evoked within the cortical mantle is described in the work of Bishop and Clare (50). Working on cats, these experimenters inserted very fine electrodes into and through the mantle of the striate cortex and recorded poten-tials evoked by stimulation of the optic nerve. The response of the cortex to electric pulse stimulation of the optic nerve were measured between two electrodes, one on the surface of the cortex, and the other directly underneath it, just below the cortical mantle. This cortical response consisted typically of from three to five successive
18
surface-positive spikes and an underlying slower wave of approximately 5-msec dura-tion, also surface positive. A surface-negative wave and other components followed to make up the total response. Of special interest are the potentials obtained by these investigators from tiny bipolar electrodes, which had between 0.1 mm and 0.2 mm verti-cal separation between the electrodes. As these electrodes were lowered vertically through the cortex, different components of the evoked response were seen to vary in amplitude independently. Near the cortical surface, the bipolar electrode did not record the first spikes, but large-amplitude fifth spikes were seen. Near the bottom of the cortical mantle, on the other hand, the first spikes of the responses were large, the fifth spikes small. Such potential distributions could not be the result of electrical fields induced by distant sites, and hence the cortex must contain the active sites. Other measurements reported in this same work confirm the observation that different com-ponents of the evoked responses to optic-nerve stimulation are generated at different, but overlapping, depths within the cortex. This conclusion may also be extended to the auditory projection cortex of cats; on the basis of his work, Bremer (11) has concluded that the "diphasic" cortical response to clicks is produced in the cortical mantle.
A mathematical representation for these active sites within the cortex is the model of a volume distribution of dipoles. These dipoles would all be oriented perpendicularly to the cortical surface, and different volumes of dipoles would produce different
com-ponents of the total response. All of the dipoles producing a single component would be fixed in spatial distribution and orientation but would be synchronously varying in ampli-tude. The potentials produced inside the cortex by such distributions of dipoles could
be made to match closely the experimentally observed potentials.
We are particularly interested in the fields produced at the surface of the scalp, how-ever, and are therefore mote interested in the potentials existing outside of the cortex than within it. Since dipole distributions within the cortical mantle are adequate models
for the active sites as measured inside the cortex, they are certainly adequate models for these cortical generators as measured by the fields produced in the conducting media surrounding the cortex. Moreover, the cortex is physically so thin that for the calcula-tion of potential fields as far distant from the cortical mantle as the scalp, two-dimensional dipole sheets would probably be adequate models of the active cortical sites. Unhappily, the mathematical complexity involved in the use of even geometrically simple dipole sheets is great. We, therefore, shall adopt the model of a single equivalent dipole for the active sites in the cortex. Such a model is certainly not realistic but does approximate the activity of a small area of the cortical mantle, particularly if that cortical area is more or less planar in nature.
The active sites in subcortical structures are not so easily localized as they are in the cortical mantle, and so are more difficult to represent by equivalent dipole volumes. On the other hand, these subcortical sites are located farther from the surface of the scalp than is the cortex, so that an equivalent dipole model for them may be quite adequate, at least as measured by the fields produced at the scalp.
19
-3.v 3.0 2.0 I-0 -j z w 0 a_ I.0 o0 -I.0 -2.0 308 200 100 00 ANGLE 8 (a) -3. 100 200 30°
~~~~'
7-b= 10 o a= 9.5 a = 9 I I I I I I 30° 20 100 0 l100 ANGLE 8 20 30 (b) U.t 0.5 0 -J 0. z La 0. z aI
300 200 100 00 ANGLE 8 (C) /yj
x b= 10 c =10. 10° 20 300 20 I-0 -1 z w 0 a. vJ I I I I I . ,, IP I O A nr
x _ --A g- - r 11 I ^\Fig. 21g. Average responses to contralateral clicks recorded from various scalp electrodes (Subject, M. W., H-596). Stimulus conditions: clicks, left ear, -45 db, 15/sec. Response conditions: reference electrode, nose; number of responses, 2000.
65
x LL -W N-E In z0 66 .I a) in E r0 r~e 0 z , i
---3.5 3.0 2.5 0 12. 0 Q. I.C 0.5 C, a).5 -j I-z o a. z x = 9.5 10 = 10.5 300 20° 100 0O 10 20° 30° 300 200 100 0° 10 20 ° 30° ANGLE 8 ANGLE 8 (d) (e)
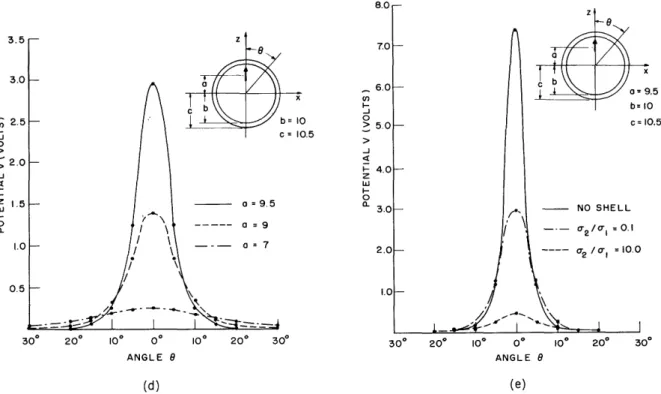
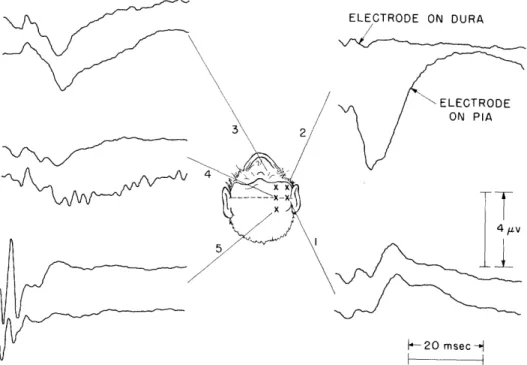
Fig. 8. (a) Potential fields that exist on the surface of a homogeneous conducting sphere caused by a radially oriented dipole located at different points along the Z-axis. Each point on the curves was computed from Eq. 1 with enough terms of the
Legendre expansion used to achieve at least two-place accuracy. (b) Potential fields that exist on the surface of a homogeneous conducting sphere caused by a tangentially oriented dipole located at different points along the Z-axis. Each point on the curves was computed from Eq. 2 to at least two-place accuracy. (c) Potential fields that exist on the outer surface of a sphere-shell config-uration caused by a radially oriented dipole located at different points along the Z-axis. The conductivity, a-2, of the homogeneous conducting shell is 10 times the conductivity, a-1 of the homogeneous sphere. Each point on the curves was computed from Eq. 3 to at least two-place accuracy. (d) Same potential fields as in (c). The conductivity, a-2' of the homogeneous conducting shell is 1/10 the conductivity, a-1, of the homogeneous sphere. Each point on the curves was computed as in (c). (e) Summary of potential fields that exist on the outer sur-face of various sphere-shell configurations caused by a fixed, radially oriented dipole. With no shell, the field existing at the surface of the sphere is shown. With shell, the field existing at the shell's outer surface is shown. The homo-geneous shell has a conductivity, a-2, and the homogeneous sphere has a con-ductivity, a-1.
21
_ _