arXiv:1610.02350v2 [nucl-ex] 15 Nov 2016
X. Yan,1,∗ K. Allada,2, 3 K. Aniol,4 J.R.M. Annand,5T. Averett,6 F. Benmokhtar,7 W. Bertozzi,2 P.C. Bradshaw,6
P. Bosted,3 A. Camsonne,3 M. Canan,8 G.D. Cates,9 C. Chen,10 J.-P. Chen,3 W. Chen,1 K. Chirapatpimol,9
E. Chudakov,3 E. Cisbani,11, 12 J.C. Cornejo,4F. Cusanno,13,† M.M. Dalton,9, 3 W. Deconinck,2 C.W. de Jager,3, 9
R. De Leo,14 X. Deng,9A. Deur,3H. Ding,9P. A. M. Dolph,9C. Dutta,15D. Dutta,16L. El Fassi,16S. Frullani,13, 12
H. Gao,1 F. Garibaldi,13, 12 D. Gaskell,3S. Gilad,2 R. Gilman,3, 17 O. Glamazdin,18 S. Golge,8L. Guo,19, 20
D. Hamilton,5 O. Hansen,3D.W. Higinbotham,3 T. Holmstrom,21 J. Huang,2, 19 M. Huang,1 H. F Ibrahim,22
M. Iodice,23 X. Jiang,17, 19 G. Jin,9 M.K. Jones,3 J. Katich,6 A. Kelleher,6 W. Kim,24 A. Kolarkar,15
W. Korsch,15J.J. LeRose,3X. Li,25 Y. Li,25 R. Lindgren,9 T. Liu,1 N. Liyanage,9 E. Long,26H.-J. Lu,27
D.J. Margaziotis,4 P. Markowitz,20 S. Marrone,14 D. McNulty,28 Z.-E. Meziani,29 R. Michaels,3 B. Moffit,2, 3
C. Mu˜noz Camacho,30S. Nanda,3A. Narayan,16 V. Nelyubin,9 B. Norum,9 Y. Oh,31 M. Osipenko,32D. Parno,33
J.-C. Peng,34 S. K. Phillips,35 M. Posik,29 A. J. R. Puckett,2, 19 X. Qian,36 Y. Qiang,1, 3 A. Rakhman,37
R. Ransome,17 S. Riordan,9 A. Saha,3,† B. Sawatzky,29, 3 E. Schulte,17 A. Shahinyan,38 M. H. Shabestari,9
S. ˇSirca,39 S. Stepanyan,3 R. Subedi,9 V. Sulkosky,2, 3 L.-G. Tang,10 W. A. Tobias,9 G. M. Urciuoli,13
I. Vilardi,14 K. Wang,9 B. Wojtsekhowski,3 Y. Wang,34 X. Yan,27 H. Yao,29 Y. Ye,27 Z. Ye,10 L. Yuan,10
X. Zhan,2 Y. Zhang,40Y.-W. Zhang,40 B. Zhao,6Y.X. Zhao,27X. Zheng,9 L. Zhu,34, 10 X. Zhu,1 and X. Zong1
(The Jefferson Lab Hall A Collaboration)
1
Duke University, Durham, NC 27708 2
Massachusetts Institute of Technology, Cambridge, MA 02139 3Thomas Jefferson National Accelerator Facility, Newport News, VA 23606
4
California State University, Los Angeles, Los Angeles, CA 90032 5
University of Glasgow, Glasgow G12 8QQ, Scotland, United Kingdom 6College of William and Mary, Williamsburg, VA 23187
7
Duquesne University, Pittsburgh, PA 15282 8
Old Dominion University, Norfolk, VA 23529 9University of Virginia, Charlottesville, VA 22904
10
Hampton University, Hampton, VA 23187 11
INFN, Sezione di Roma, I-00185 Rome, Italy 12
Istituto Superiore di Sanit`a, I-00161 Rome, Italy 13
INFN, Sezione di Roma, I-00161 Rome, Italy 14
INFN, Sezione di Bari and University of Bari, I-70126 Bari, Italy 15University of Kentucky, Lexington, KY 40506
16
Mississippi State University, MS 39762
17Rutgers, The State University of New Jersey, Piscataway, NJ 08855 18
Kharkov Institute of Physics and Technology, Kharkov 61108, Ukraine 19
Los Alamos National Laboratory, Los Alamos, NM 87545 20Florida International University, Miami, FL 33199
21
Longwood University, Farmville, VA 23909 22
Cairo University, Giza 12613, Egypt 23INFN, Sezione di Roma Tre, I-00146 Rome, Italy 24
Kyungpook National University, Taegu 702-701, Republic of Korea 25
China Institute of Atomic Energy, Beijing, People’s Republic of China 26Kent State University, Kent, OH 44242
27
University of Science and Technology of China, Hefei 230026, People’s Republic of China 28University of Massachusetts, Amherst, MA 01003
29
Temple University, Philadelphia, PA 19122 30
Universit´e Blaise Pascal/IN2P3, F-63177 Aubi`ere, France 31Seoul National University, Seoul, South Korea 32
INFN, Sezione di Genova, I-16146 Genova, Italy 33
Carnegie Mellon University, Pittsburgh, PA 15213 34University of Illinois, Urbana-Champaign, IL 61801
35
University of New Hampshire, Durham, NH 03824 36
Physics Department, Brookhaven National Laboratory, Upton, NY 37Syracuse University, Syracuse, NY 13244
38
Yerevan Physics Institute, Yerevan 375036, Armenia 39
University of Ljubljana, SI-1000 Ljubljana, Slovenia
The unpolarized semi-inclusive deep-inelastic scattering (SIDIS) differential cross sections in 3
He(e, e′π±)X have been measured for the first time in Jefferson Lab experiment E06-010 per-formed with a 5.9 GeV e− beam on a 3He target. The experiment focuses on the valence quark region, covering a kinematic range 0.12 < xbj < 0.45, 1 < Q2 < 4 (GeV/c)2, 0.45 < zh < 0.65, and 0.05 < Pt < 0.55 GeV/c. The extracted SIDIS differential cross sections of π±production are compared with existing phenomenological models while the3He nucleus approximated as two pro-tons and one neutron in a plane wave picture, in multi-dimensional bins. Within the experimental uncertainties, the azimuthal modulations of the cross sections are found to be consistent with zero.
I. INTRODUCTION
One of the main goals in nuclear and particle physics is to unravel ultimately the nucleon structure in terms of quarks and gluons, the fundamental degrees of freedom of quantum chromodynamics (QCD). Due to the non-perturbative nature of QCD at hadronic scales, it is not possible yet to calculate the structures of hadrons directly from first principles of QCD. The lepton-nucleon/nucleus deep inelastic scattering is an important experimental ap-proach and has been widely employed for more than 40 years. During the last decade or so, both experimental and theoretical studies have revealed the nontrivial ef-fects of quark intrinsic transverse momentum, especially spin-related, probed by the SIDIS processes.
In polarized and unpolarized SIDIS processes, az-imuthal modulations of cross sections were found to be sizable [1–4]. The intrinsic transverse momenta of the quarks are expected to play an important role in the observed modulations [5, 6]. To incorporate the intrin-sic transverse momentum carried by the partons in the description of the SIDIS processes, Transverse Momen-tum Dependent (TMD) Parton Distribution Functions (PDFs) and Fragmentation Functions (FFs) were pro-posed [7, 8]. TMD PDFs and FFs include dependence on the transverse momentum of the partons in addi-tion to the longitudinal momentum used in the tradi-tional one-dimensional PDFs and FFs, and can provide more complete understanding of the nucleon structure. A TMD factorization formalism was developed, incorpo-rating the TMD PDFs and FFs [9–12]. Within the TMD factorization framework, plus additional simplifications and assumptions, the 18 structure functions comprising the SIDIS differential cross section, are expressed as the convolutions of TMD PDFs and FFs [13] (naive x-z fac-torization). TMD PDFs and FFs have been parameter-ized and utilparameter-ized in the phenomenological studies of the world data of SIDIS and e+e− annihilation [14–17]. An
example showing the power of this factorization scheme is the agreement between the model description and the experiment for the Sivers and Collins effects [14]. The Sivers effect emerges from the convolution of the Sivers TMD PDF and the unpolarized TMD FF. The Collins effect is from the convolution of the transversity TMD PDF and the Collins TMD FF. Sivers and Collins effects
∗Corresponding author: xy33@phy.duke.edu
†Deceased
are related to different azimuthal modulations in SIDIS differential cross sections with transversely polarized nu-cleon [13,14]. Nontrivial azimuthal modulations in un-polarized SIDIS processes arise from the convolution of unpolarized TMD PDF and FF with factors involving the quark intrinsic transverse momentum, known as the Cahn effect [18], and the convolution of the Boer-Mulders function and the Collins function, known as the Boer-Mulders effect [8]. Various TMD PDFs provide valuable anatomy of the nucleon structure. For instance, the Boer-Mulders TMD PDF describes the distribution of trans-versely polarized quarks inside an unpolarized nucleon [14].
While factorization originates in the high energy limit (Q ≫ ΛQCDor Q ≫ Mnucleon) [19,20], and at low Q2the
description using hadronic degrees of freedom are more widely used [21], the applicability of the quark-parton model with factorization in modest Q2 ranges has been
observed in quark-hadron duality [22, 23]. One needs to note that at modest Q2 ranges, higher-twist terms
suppressed by powers of (1/Q) would be larger than those in the range of large Q2, and could bring non-negligible
effects [15].
While SIDIS measurements on the proton have been carried out by a number of experiments [14–17, 22–27] and more data will be available, SIDIS data on the neu-tron are rather limited. Since there is no stable neuneu-tron target, using a polarized 3He target as an effective
po-larized neutron target for experimental studies related to the spin structure of the neutron is uniquely advan-tageous, due to the dominant neutron spin contribution to the 3He spin [28]. The SIDIS experiment E06-010 in
Hall A of Jefferson Lab was carried out with a 5.9 GeV polarized electron beam and a transversely polarized3He
target, between October 2008 and February 2009. The experiment covered a kinematic range 0.12 < xbj < 0.45,
1 < Q2 < 4 (GeV/c)2, 0.45 < z
h < 0.65, and 0.05 <
Pt < 0.55 GeV/c. Studies on the data of E06-010 for
single-spin asymmetries (SSAs) and double-spin asym-metries (DSAs) have been carried out [29–32]. These first SIDIS asymmetry results from3He as an effective
neu-tron target were related to TMD PDFs such as transver-sity, Sivers, pretzelotransver-sity, trans-helicity (gq1T) and TMD FFs such as Collins.
The unpolarized SIDIS differential cross section, while the spin dependent azimuthal modulations are canceled, still involves nontrivial modulations from the Cahn and Boer-Mulders effects. The unpolarized SIDIS differential cross section in the quark-parton model as well as the
parameterization of the related TMD PDFs and FFs are presented in section II. As in the studies of the world data [5, 15–17], the SIDIS cross section is expressed in the functional form based on the quark-parton model with naive x-z factorization, and the transverse momen-tum dependence described as a Gaussian distribution. In global analyses fitting different types of data (multiplic-ities and/or asymmetries) in different kinematic ranges, very different values were extracted for the width of the quark intrinsic transverse momentum, hk2
⊥i. Namely
hk2
⊥i is at the level of 0.2 GeV2 in [5, 17], at the level
of 0.5 GeV2 in [16] and less than 0.05 GeV2 in [15].
While the multiplicities and asymmetries from experi-ments have been fitted with ratios of combinations of the theoretical cross sections, as in the studies of the world data [5,15–17], the corresponding study for the absolute cross sections is rather limited.
In addition to the fact that the absolute cross sections provide more complete information than multiplicities and asymmetries (ratios of combinations of the polarized and unpolarized cross sections), TMD evolution also has much stronger effect on the absolute cross sections [33]. In recent years, the unpolarized SIDIS processes have
attracted considerable interest due to providing special insights into the TMD evolution effect [34].
In this paper, using the E06-010 experimental data, we present the first extraction of the unpolarized SIDIS differential cross sections from a3He target, comparisons
with different models, the study of azimuthal modula-tions in the extracted cross secmodula-tions, and the constraints on the phenomenological parameters from the data in this study. In this paper, the units GeV/c and GeV are not discriminated for conciseness of expressions.
II. QUARK-PARTON MODEL AND SIDIS
PARAMETERIZATION
The processes of interest are the unpolarized SIDIS e(l) + N (P ) → e′(l′) + π±(P
h) + X(PX), where the
vari-ables in the parentheses are the four-vector momenta, e the beam electron, N the target nucleon, e′ the
scat-tered electron being detected, π± the detected hadron
(charged pion) and X the final state particles not being detected. The unpolarized SIDIS differential cross sec-tion is expressed as dσ dxbjdydzhdφSdPt2dφh = α 2 2Q2x bjy h
A · FUU+ B · FUUcosφhcos φh+ C · FUUcos 2φhcos 2φh
i
, (1)
where α is the electromagnetic fine-structure constant, A = (1 + (1 − y)2), B = 2(2 − y)√1 − y, C = 2(1 − y),
xbj = Q2/(2P ·q), y = (P ·q)/(P ·l), zh= (P ·Ph)/(P ·q),
q = l − l′ and Q2 = −q2 [13, 15–17]. φ
S is the
az-imuthal angle of the nucleon spin direction, and can be integrated out in the unpolarized SIDIS process yield-ing an additional 2π factor for the FUU’s. The reference
frame and the definition of the azimuthal angle φh
be-tween the lepton scattering plane and the hadron plane follow the “Trento Conventions” as in [35]. The trans-verse momentum of the detected hadron is denoted as Pt.
The structure function FUU involves a convolution of
the unpolarized TMD PDF fq(xbj, k⊥) and TMD FF
Dq(zh, p⊥), where k⊥ is the intrinsic transverse
momen-tum of the parton and p⊥ the transverse momentum of
the fragmenting hadron with respect to the parton. The structure function FUUcosφh at the lowest twist (twist-3), consists of a Cahn contribution and a Boer-Mulders con-tribution. The structure function FUUcos 2φh consists of a twist-2 Boer-Mulders contribution and a twist-4 Cahn contribution. The Cahn contributions involve the con-volution of the unpolarized TMD PDF fq(xbj, k⊥) and
TMD FF Dq(zh, p⊥). The Boer-Mulders contributions
involve the convolution of the Boer-Mulders TMD PDF ∆fq↑(xbj, k⊥) = −h⊥1(xbj, k⊥) · k⊥/Mp and the Collins
TMD FF ∆Dq↑(zh, p⊥) = 2p⊥· H1⊥(zh, p⊥)/(zhMh). A
unit vector is defined for convenience as h ≡ Pt/|Pt|.
The structure functions are given below with the mo-mentum conservation condition Pt = zhk⊥+ p⊥.
FUU = X q e2 qx Z d2k ⊥fq(xbj, k⊥)Dq(zh, p⊥), (2) FUUcosφh|Cahn= −2 X q e2 qx Z d2k ⊥ k⊥· h Q fq(xbj, k⊥)Dq(zh, p⊥), (3) FUUcosφh|BM= X q e2qx Z d2k⊥ k⊥ Q Pt− zhk⊥· h p⊥ ∆fq↑(xbj, k⊥)∆Dq↑(zh, p⊥), (4) FUUcos 2φh|BM= X q e2qx Z d2k⊥ Ptk⊥· h + zh[k2⊥− 2(k⊥· h)2] 2k⊥p⊥ ∆fq↑(xbj, k⊥)∆Dq↑(zh, p⊥), (5) FUUcos 2φh|Cahn= 2 X q e2 qx Z d2k ⊥ 2(k⊥· h)2− k⊥2 Q2 fq(xbj, k⊥)Dq(zh, p⊥). (6)
Phenomenologically, the Gaussian ansatz is often utilized in TMD parameterizations. The unpolarized TMD PDF fq(xbj, k⊥) and unpolarized TMD FF Dq(zh, p⊥) are
ex-pressed as fq(xbj, k⊥) = fqc(xbj)e−k 2 ⊥/hk 2 ⊥i/(πhk2 ⊥i), (7) Dq(zh, p⊥) = Dcq(zh)e−p 2 ⊥/hp 2 ⊥i/(πhp2 ⊥i), (8) where fc
q(xbj) is the collinear PDF, Dcq(zh) the collinear
FF, hk2
⊥i and hp2⊥i the Gaussian widths as
phenomenolog-ical parameters. In addition, the widths hk2
⊥i and hp2⊥i
in different studies have different forms of kinematical dependence: xbj dependence for hk⊥2i and/or zh
depen-dence for hp2
⊥i [15–17]. The knowledge about the flavor
dependence of hk2
⊥i and hp2⊥i is limited [36], and flavor
independence has been assumed in most of the studies. The Boer-Mulders TMD PDF and Collins TMD FF are parameterized as in [15].
III. EXPERIMENT
The experiment E06-010, as introduced in section I
and published studies of this experiment [29–32], pro-duced data sets with a polarized 5.9 GeV electron beam and a transversely polarized 3He gas target. The
scat-tered electrons were recorded by the BigBite spectrom-eter and the electroproduced pions (π±) were recorded
by the High Resolution Spectrometer (HRS). To study the unpolarized SIDIS processes, the data with opposite polarization states were combined. The charge difference between the two opposite beam polarizations for the en-tire experiment was less than 10ppm [32]. The net 3He
polarization after data combination is less than 0.5%. In the experiment, the target system consisted of a 40-cm-long glass cell containing about 10 atm of3He
po-larized by spin-exchange optical pumping [37]. The di-rection of the3He polarization was flipped every 20
min-utes. At each flip, the percentage of the3He polarization
was measured and recorded. The temperature and den-sity of the3He gas in the target cell was monitored and
recorded in the data together with the information from the detectors.
The BigBite spectrometer consisted of a single dipole magnet, eighteen planes of multiwire drift chambers in three groups and a scintillator plane between the lead-glass preshower and shower calorimeters. The knowledge of the magnetic field and the information from the drift chambers, were used to reconstruct the tracks of charged particles. The trigger was formed by summing the sig-nals from the preshower and shower calorimeters. The preshower and shower energy deposition with the recon-structed momentum were utilized for the particle identi-fication (PID) in BigBite [38].
The HRS was configured for hadron detection. The trigger was provided by two scintillator planes. Four detectors in the HRS were used for PID: a CO2 gas
ˇ
Cerenkov detector for electron identification, an aerogel ˇ
Cerenkov detector for pion identification, a ring imag-ing ˇCerenkov (RICH) detector for π±, K±, and proton
identification, and two layers of lead-glass calorimeter for electron-hadron separation [38–40].
IV. DATA ANALYSIS
The data analysis for the unpolarized SIDIS differen-tial cross section is more complicated than that for the asymmetry studies due to the need of a thorough under-standing and description of the experimental acceptance as well as a good control of the systematic uncertainties, some of which were less important due to the cancellation in the asymmetry studies. Dedicated developments and updates of the detector models in the simulation enabled a good description of the experimental acceptance, and have been successfully used in single electron channels as well as coincidence SIDIS channels. Detailed studies of the systematic uncertainties have been carried out thor-oughly for the cross section extraction and the overall systematic uncertainty is mostly under 10%. In addition, radiative corrections, exclusive tail subtractions and bin-centering corrections have been applied. The additional studies important for the analysis of the SIDIS cross
sec-tion beyond the asymmetry studies of this experiment [29–32,39] are presented below.
A. Monte Carlo simulations
For a full description of the experimental acceptance of E06-010, a model for the BigBite spectrometer used in E06-010 for electron detection has been developed and incorporated into the SIMC package [41] which was ini-tially developed for Hall C experiments and used for the semi-inclusive studies in Hall C [22]. It was adapted for this experiment [42]. It contains a realistic description of various detectors including the HRS used in the ex-periment E06-010 for hadron detection. The energy loss, multi-scattering, pion decay processes have also been in-cluded in the SIMC package.
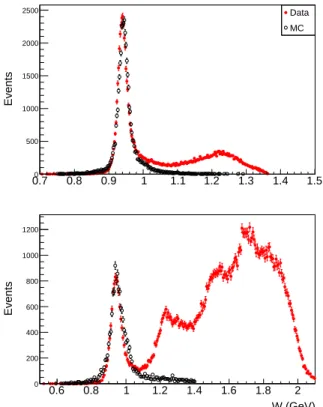
The detector model of BigBite was tested by using the calibration runs of elastic electron-proton (EP) scattering at incident electron beam energies of 1.23 and 2.4 GeV (Fig. 1), as well as the inclusive DIS channel from the3He
production data at 5.9 GeV (Fig. 2) by using the single BigBite trigger. Inclusive DIS data from H2 reference
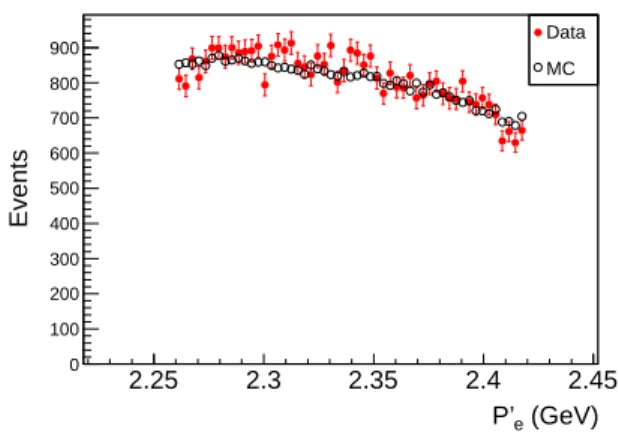
runs and3He production runs at 5.9 GeV with the single
HRS trigger have been used to test the description of the HRS experimental acceptance (Figs. 3 and4).
B. Data corrections and cross section extraction
Corrections need to be applied to the raw data for cross section extraction, namely the efficiency correction, con-tamination/background subtraction, acceptance correc-tions, radiative corrections and bin-centering corrections. The PID of electrons in BigBite was based on the com-bination of a cut in the preshower energy deposition and a 2D cut in the ratio of total shower energy deposition and the reconstructed momentum in order to suppress the π− contamination. The PID cuts were optimized by
minimizing the loss of electron events and maximizing the suppression of the π−contamination. The portions of
the remaining π− contamination and the loss of electron
events were estimated based on fitting and discriminating the π−and electron signals in the preshower calorimeter.
The data after the PID cuts were corrected by subtract-ing the remainsubtract-ing π− contamination and compensating
for the loss of electron events. The remaining π−
con-tamination contributed from less than 0.1% to 6% to the signal after the PID cuts, with descending range of elec-tron momentum. The loss of elecelec-tron events varied from 2% to 30% with descending range of electron momentum. The π0, from the electroproduction, decays into
two photons. The high energy photons create the photon-induced electron contamination through the pair-production process. The percentage of this contamina-tion in the total electron events was determined by com-paring the positron yield in the BigBite with the reversed magnetic field and the electron yield in the BigBite in
0.7 0.8 0.9 1 1.1 1.2 1.3 1.4 1.5 Events 0 500 1000 1500 2000 2500 Data MC W (GeV) 0.6 0.8 1 1.2 1.4 1.6 1.8 2 Events 0 200 400 600 800 1000 1200
FIG. 1. (color online). Invariant mass (W ) bin comparison for 1.23 GeV (top panel) and 2.4 GeV (bottom panel) beam elastic EP calibration run using BigBite. The error bars rep-resent the statistical uncertainties. The red solid circles are from the data. The black open circles are from the simulation. The simulation only covers the elastic EP scattering channel and compares well with the proton W peak while the peaks from higher resonances only appear in the data.
the production runs. The photon-induced electron con-tamination was then subtracted. The photon-induced electron contamination contributed 2% in high electron momentum range and up to 40% in low electron momen-tum range, in the total electron events of the BigBite spectrometer.
The PID of π± in the HRS was based on the
combi-nation of gas ˇCerenkov, aerogel ˇCerenkov and lead glass calorimeter signals. The loss of π± events (∼5%),
nega-tively charged non-pion hadron and electron contamina-tion to π− events (<0.5%) and positively charged
non-pion hadron contamination to π+ events (<1%) have
been evaluated and included in the correction.
The experimental acceptance was described by the Monte Carlo simulation with the BigBite and HRS mod-els, both of which have been checked by single electron channels. The acceptance correction was based on the Monte Carlo simulation with the same kinematic cuts as applied to the data. The number of events in each bin from the simulation weighted by the theoretical cross sec-tion Nsim divided by the non-weighted simulation with
the same kinematic cuts in the same bin Nphs, becomes
(GeV) e P’ 1.6 1.7 1.8 1.9 2 2.1 2.2 2.3 Events 0 500 1000 1500 2000 2500 Data MC
FIG. 2. (color online). Scattered electron momentum (P′ e) bin comparison of3
He inclusive DIS channel in BigBite. The error bars represent statistical uncertainties. The red solid circles are from the data. The black open circles are from the simulation. (GeV) e P’ 2.25 2.3 2.35 2.4 2.45 Events 0 100 200 300 400 500 600 700 800 900 Data MC
FIG. 3. (color online). Scattered electron momentum (P′ e) bin comparison of H2inclusive DIS channel in the HRS. The error bars represent statistical uncertainties. The red solid circles are from the data. The black open circles are from the simulation.
same was done for the data events Ndata, forming a
quan-tity Ndata/Nphsin each bin from which the experimental
cross section can be determined after applying other data corrections in addition. More details for the acceptance correction can be found in AppendixA.
There were complicated and time-dependent drifts of the total shower energy threshold for the BigBite trig-ger during the experiment. To address this issue, a total shower energy cut of Etot > 900 MeV was used, high
enough to override the fluctuations of threshold-related inefficiency, but not too high to significantly reduce the kinematic range and valuable data. A description of the total shower energy deposition was developed and in-cluded in the BigBite model of simulation, based on the experimental data from the BigBite calibration runs and
(GeV) e P’ 2.25 2.3 2.35 2.4 2.45 Events 0 500 1000 1500 2000 2500 3000 Data MC
FIG. 4. (color online). Scattered electron momentum (P′ e) bin comparison of3
He inclusive DIS channel in the HRS. The error bars represent statistical uncertainties. The red solid circles are from the data. The black open circles are from the simulation.
checked by the production runs. Simulations with the same total shower energy cut were used for the BigBite trigger efficiency correction.
The tracking efficiency of BigBite was evaluated using the elastic EP scattering with well-known cross sections and state-of-the-art radiative corrections. Two beam en-ergies, 1.23 and 2.4 GeV, were used in the elastic EP runs, covering low and high momentum acceptance of the BigBite spectrometer. The tracking efficiency was also checked using the inclusive DIS channel in the 3He
production data. The tracking efficiency was estimated to be 73% to 75%.
The contribution from the exclusive channels e + p → e′+ π+
+ n and e + n → e′+ π−+ p were subtracted using
simulation with a cross section model tested in the kine-matic range of this experiment [22]. The contributions from the exclusive channels were from 2% to 7.5% in the π+ production channel and 0.5% to 3% in the π−
pro-duction channel. The internal radiative corrections for the SIDIS channels were carried out using the HAPRAD package [43]. The radiative corrections based on Mo and Tsai [44] built in SIMC were used as a comparison and to estimate systematic uncertainty [22]. The energy loss, multi-scattering effects and π± decay were simulated us-ing the established components of SIMC, while the ra-diation length and materials were defined based on the configuration of the experiment E06-010.
The bin-centering corrections were based on the quark-parton model used in comparison with the data. In each of the bins, the central value of each variable involved in the SIDIS cross section was found experimentally and differed by less than 0.5% from the Monte Carlo simula-tion. The bin-centering correction for the cross section from the data in one bin is defined as
σBCCexp = σbin exp σbin MC · σtheory, (9)
where σBCC
exp is the SIDIS differential cross section
extracted experimentally, after the bin-centering cor-rection with experimental central values of variables (xbj, zh, Q2, φh, Pt). σtheory is the theoretical SIDIS
dif-ferential cross section with the same values of variables. σbin
exp and σbinMC are the SIDIS differential cross sections
in the bin with the corresponding central values, deter-mined from the data and simulation, respectively. σbin exp
was determined by applying all the corrections to the raw data, namely the efficiency corrections, contamina-tion/background subtractions, radiative corrections and acceptance corrections. σbin
MC was determined by
apply-ing the acceptance corrections to the Monte Carlo simu-lation weighted by the theoretical SIDIS differential cross section.
C. Systematic uncertainties
The systematic uncertainties related to the electron detection in BigBite were dominated by the determina-tion of the photon-induced electron contaminadetermina-tion and the evaluation of the efficiency of the total shower en-ergy cut which was applied to remove the effect from the drift of the threshold. The photon-induced electron con-tamination contained the uncertainty of determining the positron yield from which a large (up to 50%) portion of π+ was evaluated and subtracted. The efficiency of the
total shower energy cut involved increasing uncertainties due to increasing effect of the threshold drift, in descend-ing momentum range.
To evaluate the systematic uncertainties above, the cuts on preshower energy deposition, total shower en-ergy deposition and reconstructed momentum have been varied around the optimized values. Each set of cuts cor-responds to a specific efficiency and contamination. The data have been corrected under sets of varied cuts be-sides the optimized one. The root mean square value of the differences of the corrected data yields with varied cut sets from the optimized set have been used to define the systematic uncertainties.
The total systematic uncertainties related to the elec-tron detection in the BigBite are in the range from 3% to 10% depending on the kinematics.
The systematic uncertainties of the PID of π± events
in the HRS were determined to be less than 2%, using the well-established techniques in the previous studies of this experiment [29–32, 38,39].
In the coincidence channel for SIDIS, the systematic uncertainties in the experimental acceptance corrections by the simulation were determined by putting a series of kinematic cuts besides the central optimized set to both the data and the simulation. The total systematic uncer-tainties from the acceptance corrections are between 5% to 10% depending on the kinematics.
The systematic uncertainties related to the exclusive tail subtractions and the SIDIS radiative corrections have been evaluated in the same manner as [22]. Specifically,
different models of the exclusive channels and the dif-ference between the HAPRAD and the SIMC for the radiative corrections have been used to define the sys-tematic uncertainties. The syssys-tematic uncertainties for these items are between 2% to 6% depending on the kine-matics.
The systematic uncertainties of the results related to the central-value uncertainties of the variables (xbj, zh, Q2, φh, Pt) have been evaluated by inserting the
variable uncertainties to the bin-centering corrections, thus reflected in the extracted cross sections. The sys-tematic uncertainties related to the bin-centering correc-tions are less than 3% with a kinematic dependence.
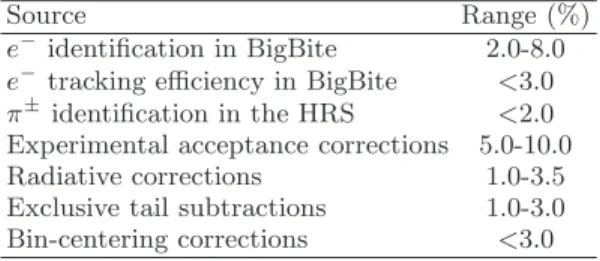
The main contributions of the systematic uncertainties are listed in Table. I.
TABLE I. Systematic uncertainties.
Source Range (%)
e− identification in BigBite 2.0-8.0
e− tracking efficiency in BigBite <3.0
π± identification in the HRS <2.0
Experimental acceptance corrections 5.0-10.0
Radiative corrections 1.0-3.5
Exclusive tail subtractions 1.0-3.0
Bin-centering corrections <3.0
D. Kinematical correlations and binning
In the production run of E06-010, only one experimen-tal configuration was used. Kinematical correlations are shown in Fig. 5. Due to the Kinematical correlations, strict one-dimensional (1D) binning in which only one variable changes while all the other variables stay intact is prohibited.
In this paper, a set of pseudo-one-dimensional (pseudo-1D) bins is used for presenting the results. Pseudo-1D means that when the binning is in one variable, for exam-ple, xbj, the difference between one bin and another is not
only in xbj, but in all the variables (xbj, zh, Q2, φh, Pt)
due to kinematical correlations. Pseudo-1D bins in xbj
has 10 consecutive bins with almost equal statistics. A set of two-dimensional (2D) bins is used to present the Pt dependence of the cross sections. The set of 2D
bins (10 × 10) consists of 10 Pt bins in 10 ranges of
xbj. The boundaries of the bins are set to make each bin
contain almost equal statistics.
A set of three-dimensional (3D) bins is used to present the φh dependence of the cross sections. The data are
binned into two ranges of Pt first. In each of the Pt
ranges, five xbj bins are defined. 10 φh bins are defined
in each of the 2 × 5 ranges of Ptvs. xbj. Each bin of the
) 2 (GeV 2 Q 1 2 3 4 bj x 0.2 0.3 0.4 h z 0.45 0.5 0.55 0.6 bj x 0.2 0.3 0.4 (GeV) t P 0 0.2 0.4 bj x 0.2 0.3 0.4 (rad) h φ 2 3 4 bj x 0.2 0.3 0.4
FIG. 5. (color online). The correlations between xbj and other kinematic variables in experiment E06-010.
V. RESULTS
The extracted unpolarized SIDIS differential cross sec-tions and the cross section ratios are compared with mod-els in different bin sets in the following sections. Fit-ting the extracted cross section of the data in this study demonstrates the data’s constraint on the parameters de-scribing the SIDIS process. The plane wave impulse ap-proximation (PWIA) treatment of the3He nucleus in the
SIDIS process is adopted in this study, thus the modeled SIDIS cross section from3He is the same as the sum of
the modeled SIDIS cross sections from two protons and one neutron.
A. Cross sections in pseudo-1D bins
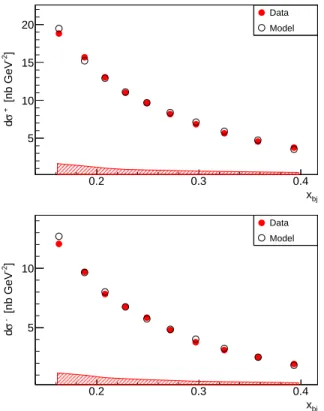
The comparisons of the SIDIS differential cross sec-tions from the data and the quark-parton model in pseudo-1D xbj bins are shown in Fig.6. The top panel in
the figure is for the π+production channel3He(e, e′π+)X
and the bottom panel for the π− production channel 3He(e, e′π−)X. The vertical axis is the SIDIS
differ-ential cross section dσ/(dxbjdydzhdφSdPt2dφh) in unit
of nb · GeV−2· rad−2. The total experimental
system-atic uncertainties using quadrature combination of all the sources are shown in the band at the bottom of each plot. The SIDIS differential cross section from the model is defined in Eq (1) and the parameterizations of the
Gaussian widths of unpolarized TMD PDF and FF are in the forms as in [17], namely hk2
⊥i = 0.14 GeV2 and
hp2
⊥i = a · zh0.54(1 − zh)b GeV2, where a = 1.55 and
b = 2.2 are slightly tuned from the values in one set of the HERMES data analysis inherited and cited by [17]. The Boer-Mulders TMD PDF and Collins TMD FF parameterizations were taken from [15]. The effect of the Boer-Mulders terms in the total SIDIS cross sec-tions were found to be less than 2% in magnitude and opposite in sign for the π± electroproduction channels.
Terms with twists higher than those included in section
IIwere neglected. The model calculates the sum of the cross sections from two protons and one neutron as an approximation for the3He nucleus.
Agreement between the data and the model is ob-served.
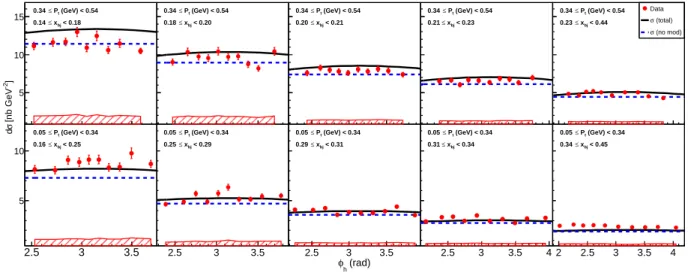
B. Theφh dependence of the cross sections
The differential cross sections of SIDIS were extracted in 3D bins (2 × 5 × 10), to examine the φh dependence
of the cross sections in 2 × 5 ranges of Ptvs. xbj.
Bin-centering corrections were used to remove the difference of all the variables except φh from one bin to another in
each of the Ptvs. xbj ranges, therefore the 10 φhbins in a
certain range of Ptand xbj differ only in the values of φh.
The comparisons of the SIDIS differential cross sections from the data and the models from [15–17] are presented
bj x 0.2 0.3 0.4 ] -2 [nb GeV + σ d 5 10 15 20 Data Model bj x 0.2 0.3 0.4 ] -2 [nb GeV - σ d 5 10 Data Model
FIG. 6. (color online). SIDIS differential cross section (de-fined in text) comparison in pseudo-1D xbj bins. The red solid circles are from the data and the black open circles are from the quark-parton model. The error bar of each point represents the statistical uncertainty, mostly smaller than the markers. The error band on the bottom of each panel repre-sents the experimental systematic uncertainty. The top and bottom panels are for π+and π−production channel, respec-tively.
in Figs. 7 and 8. Comparisons between the data and the model from [17] with and without modulation are in Figs. 9 and 10. The comparisons show that the model from [17] compares the best with the data, while the model from [16] deviates the most from the data in most of the kinematic ranges.
The cross sections and corresponding kinematic vari-ables are recorded in Tvari-ables. II andIIIin AppendixB.
C. ThePt dependence of the cross sections
To present the Pt dependence of the SIDIS cross
sec-tions, 2D bins (10 × 10) of xbj vs. Pt are used.
Bin-centering corrections were used to remove the difference of all the variables except Ptfrom one bin to another in
each range of xbj, therefore the 10 Pt bins in a certain
range of xbj differ only in the values of Pt. The
com-parisons of the SIDIS differential cross sections from the data and the models from [15–17] are presented in Figs.
11 and12. The comparisons show that the model from [17] compares the best with the data, while the model
from [16] deviates the most from the data in most of the kinematic ranges. In the highest xbj ranges
(correspond-ing to lowest Ptranges), the model from [16] gives better
comparison than the models from [15, 17], but still has sizable deviations from the data.
The cross sections and corresponding kinematic vari-ables are recorded in Tvari-ables. IVandV in AppendixB.
D. The ratios of cross sections
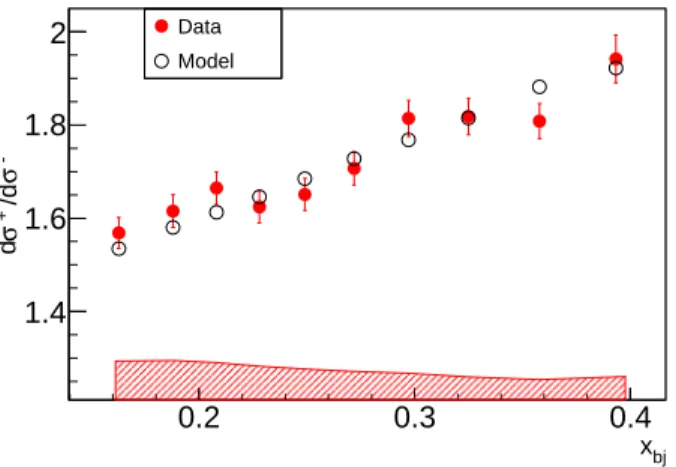
The comparisons of the ratios (from the data and model) of SIDIS π+production cross sections over SIDIS
π− production cross sections in pseudo-1D x
bj bins are
shown in Fig. 13. The model parameters are the same as in partV Aof this section. The systematic uncertainties from the acceptance and efficiency of electron detection in BigBite, are not included in the bottom systematic er-ror band, as the electron part is the same in the SIDIS π± production.
In the plot, the error bars of the data points are for the statistical uncertainties of the data. The error bars of the model points are for the model uncertainties. In this study, the model uncertainties are defined by the quadra-ture combination of the differences of the ratios with and without the contribution from the Boer-Mulders terms, changing the width hk2
⊥i to 2hk⊥2i and changing hp2⊥i
to 2hp2
⊥i. The Boer-Mulders effects in the π±
produc-tion channels have opposite signs, and the changes of the cross section ratios due to turning off the Boer-Mulders contributions are 1% to 4%. The flavor dependence of the widths has not been included in the model, thus the widths do not differ in channels of the π± production. Theoretically, if the π± production SIDIS cross sections
have the same transverse momentum dependence, their ratios at the same kinematics will be independent of the widths. Due to very small differences between the cen-tral values of variables in the π± production channels,
the effect of changing hk2
⊥i to 2hk2⊥i or hp2⊥i to 2hp2⊥i was
none-zero but less than 0.1%.
Results from the data are consistent with the model without a flavor dependence of hk2
⊥i and hp2⊥i as assumed
in most of the global analysis for SIDIS [15–17].
E. Azimuthal modulation and stand-alone data
fitting
Fitting the φhdistribution in each of the 2 × 5 ranges
of Ptvs. xbj in the 3D bins (2 × 5 × 10), with a simple
function A·(1−B ·cos φh), provides a naive probe for the
azimuthal modulation effect in the data. The parameter B indicates the size of the modulation. The parameter Bs in all ranges are presented in Fig. 14. Due to a limited φhrange in the data and a large number of fitting
parameters being used (A and B in one Ptand xbj range
differ from A and B in another range), the data do not provide good constraints on the Bs.
2.5 3 3.5 σ d 10 20 < 0.25 bj x ≤ 0.16 (GeV) < 0.34 t P ≤ 0.05 2.5 3 3.5 10 20 < 0.29 bj x ≤ 0.25 (GeV) < 0.34 t P ≤ 0.05 (rad) h φ 2.5 3 3.5 10 20 < 0.31 bj x ≤ 0.29 (GeV) < 0.34 t P ≤ 0.05 2.5 3 3.5 4 10 20 < 0.34 bj x ≤ 0.31 (GeV) < 0.34 t P ≤ 0.05 2 2.5 3 3.5 4 10 20 < 0.45 bj x ≤ 0.34 (GeV) < 0.34 t P ≤ 0.05 2.5 3 3.5 ] -2 [nb GeV 10 20 30 < 0.18 bj x ≤ 0.14 (GeV) < 0.54 t P ≤ 0.34 2.5 3 3.5 10 20 30 < 0.20 bj x ≤ 0.18 (GeV) < 0.54 t P ≤ 0.34 2.5 3 3.5 10 20 30 < 0.21 bj x ≤ 0.20 (GeV) < 0.54 t P ≤ 0.34 2.5 3 3.5 4 10 20 30 < 0.23 bj x ≤ 0.21 (GeV) < 0.54 t P ≤ 0.34 2 2.5 3 3.5 4 10 20 30 < 0.44 bj x ≤ 0.23 (GeV) < 0.54 t P ≤ 0.34 Data Bacchetta2011 Barone2015 Anselmino2014
FIG. 7. (color online). 3D binning cross section for π+
channel. The red circles are from the data, the black solid lines are from the model [17], the blue dashed lines are from the model [15] and the green dotted lines are from the model [16]. The error bars represent the statistical uncertainties of the data. The error band on the bottom of each panel represents the experimental systematic uncertainty. 2.5 3 3.5 σ d 5 10 15 0.16 ≤ xbj < 0.25 (GeV) < 0.34 t P ≤ 0.05 2.5 3 3.5 5 10 15 0.25 ≤ xbj < 0.29 (GeV) < 0.34 t P ≤ 0.05 (rad) h φ 2.5 3 3.5 5 10 15 0.29 ≤ xbj < 0.31 (GeV) < 0.34 t P ≤ 0.05 2.5 3 3.5 4 5 10 15 0.31 ≤ xbj < 0.34 (GeV) < 0.34 t P ≤ 0.05 2 2.5 3 3.5 4 5 10 15 0.34 ≤ xbj < 0.45 (GeV) < 0.34 t P ≤ 0.05 2.5 3 3.5 ] -2 [nb GeV 5 10 15 20 0.14 ≤ xbj < 0.18 (GeV) < 0.54 t P ≤ 0.34 2.5 3 3.5 5 10 15 20 0.18 ≤ xbj < 0.20 (GeV) < 0.54 t P ≤ 0.34 2.5 3 3.5 5 10 15 20 0.20 ≤ xbj < 0.21 (GeV) < 0.54 t P ≤ 0.34 2.5 3 3.5 4 5 10 15 20 0.21 ≤ xbj < 0.23 (GeV) < 0.54 t P ≤ 0.34 2 2.5 3 3.5 4 5 10 15 20 0.23 ≤ xbj < 0.44 (GeV) < 0.54 t P ≤ 0.34 Data Bacchetta2011 Barone2015 Anselmino2014
FIG. 8. (color online). 3D binning cross section for π− channel. The definitions of the markers, the lines and the bands are the same as the figure above for the π+
channel.
Azimuthal modulation effects in the unpolarized SIDIS channel arise from the relative magnitudes of FUUcosφh,
FUUcos 2φh and FUU. Using the functional forms in section II, FUU and the Cahn parts of the structure functions
FUUcosφh and FUUcos 2φh after convolution can be expressed as FUU = X q fqcDqc e2 qxbj πhP2 ti e−Pt2/hP 2 ti, (10) FUUcosφh = −2 X q fqcDcq Ptzhe2qxbjhk⊥2i πQhP2 ti2 e−Pt2/hP 2 ti, (11) FUUcos 2φh = 2X q fqcDqc P2 tzh2e2qxbjhk⊥2i2 πQ2hP2 ti3 e−Pt2/hP 2 ti, (12) where hP2
ti = hp2⊥i + z2hhk⊥2i. The Boer-Mulders parts
after convolution can be found in [15].
The parameters being fitted are the Gaussian widths hk2
2.5 3 3.5 σ d 5 10 15 < 0.25 bj x ≤ 0.16 (GeV) < 0.34 t P ≤ 0.05 2.5 3 3.5 5 10 15 < 0.29 bj x ≤ 0.25 (GeV) < 0.34 t P ≤ 0.05 (rad) h φ 2.5 3 3.5 5 10 15 < 0.31 bj x ≤ 0.29 (GeV) < 0.34 t P ≤ 0.05 2.5 3 3.5 4 5 10 15 < 0.34 bj x ≤ 0.31 (GeV) < 0.34 t P ≤ 0.05 2 2.5 3 3.5 4 5 10 15 < 0.45 bj x ≤ 0.34 (GeV) < 0.34 t P ≤ 0.05 2.5 3 3.5 ] -2 [nb GeV 10 20 < 0.18 bj x ≤ 0.14 (GeV) < 0.54 t P ≤ 0.34 2.5 3 3.5 10 20 < 0.20 bj x ≤ 0.18 (GeV) < 0.54 t P ≤ 0.34 2.5 3 3.5 10 20 < 0.21 bj x ≤ 0.20 (GeV) < 0.54 t P ≤ 0.34 2.5 3 3.5 4 10 20 < 0.23 bj x ≤ 0.21 (GeV) < 0.54 t P ≤ 0.34 2 2.5 3 3.5 4 10 20 < 0.44 bj x ≤ 0.23 (GeV) < 0.54 t P ≤ 0.34 Data (total) σ (no mod) σ
FIG. 9. (color online). 3D binning cross section for π+
channel. The red circles are from the data, the black solid lines are from the model [17], the blue dashed lines are from the model [17] with Fcosφh
U U and F
cos 2φh
U U setting to zero. The error bars represent the statistical uncertainties of the data. The error band on the bottom of each panel represents the experimental systematic uncertainty. 2.5 3 3.5 σ d 5 10 0.16 ≤ xbj < 0.25 (GeV) < 0.34 t P ≤ 0.05 2.5 3 3.5 5 10 0.25 ≤ xbj < 0.29 (GeV) < 0.34 t P ≤ 0.05 (rad) h φ 2.5 3 3.5 5 10 0.29 ≤ xbj < 0.31 (GeV) < 0.34 t P ≤ 0.05 2.5 3 3.5 4 5 10 0.31 ≤ xbj < 0.34 (GeV) < 0.34 t P ≤ 0.05 2 2.5 3 3.5 4 5 10 0.34 ≤ xbj < 0.45 (GeV) < 0.34 t P ≤ 0.05 2.5 3 3.5 ] -2 [nb GeV 5 10 15 < 0.18 bj x ≤ 0.14 (GeV) < 0.54 t P ≤ 0.34 2.5 3 3.5 5 10 15 < 0.20 bj x ≤ 0.18 (GeV) < 0.54 t P ≤ 0.34 2.5 3 3.5 5 10 15 < 0.21 bj x ≤ 0.20 (GeV) < 0.54 t P ≤ 0.34 2.5 3 3.5 4 5 10 15 < 0.23 bj x ≤ 0.21 (GeV) < 0.54 t P ≤ 0.34 2 2.5 3 3.5 4 5 10 15 < 0.44 bj x ≤ 0.23 (GeV) < 0.54 t P ≤ 0.34 Data (total) σ (no mod) σ
FIG. 10. (color online). 3D binning cross section for π−channel. The definitions of the markers, the lines and the bands are the same as the figure above for the π+
channel.
The 2D bins (10 × 10) and 3D bins (2 × 5 × 10) data were fitted and the results are in Fig. 15. Three con-tours corresponding to δχ2 = 1, 2.3 and 6.2 are drawn
besides the central values from the fitting. δχ2= 1
con-tour is conventionally the same as the 1-σ concon-tour. The contours of δχ2= 2.3 and 6.2 show the constraints of
two-parameter fitting at confidence levels of 68% and 95%, re-spectively. The central values of the fitting in the 2D bins are hk2
⊥i = 0.003±0.008 GeV2and hp2⊥i = 0.2104±0.0025
GeV2. The central values of the fitting in the 3D bins are
hk2
⊥i = 0.006 ± 0.010 GeV2 and hp2⊥i = 0.2148 ± 0.0026
GeV2. The fitting results indicate consistent azimuthal
modulation effects from the data in 3D bins with the φh
information and 2D bins without the φh information.
Fitting the data with a simpler functional form, namely setting FUUcosφh and FUUcos 2φh to zero, was also done. The results are presented in Fig. 16. The cen-tral values of the fitting in the 2D bins are hk2
⊥i =
0.090 ± 0.097 GeV2 and hp2
⊥i = 0.1840 ± 0.0276 GeV2.
The central values of the fitting in the 3D bins are hk2
⊥i = 0.085 ± 0.112 GeV2 and hp2⊥i = 0.1901 ± 0.0330
GeV2.
The very different constraints of hk2
⊥i vs. hp2⊥i using
the functional form including all three structure func-tions (Fig. 15) and the functional form including only structure function FUU (Fig. 16), come from the
spe-cific model formulation, namely FUUcosφh and FUUcos 2φh as in Eqs. (11) and (12). These specific functional forms,
0.35 0.4 0.45 0.5 ] -2 [nb GeV σ d 10 20 30 40 < 0.18 bj x ≤ 0.14 0.35 0.4 0.45 10 20 30 < 0.20 bj x ≤ 0.18 0.3 0.35 0.4 0.45 10 20 < 0.22 bj x ≤ 0.20 0.3 0.35 0.4 0.45 5 10 15 20 < 0.24 bj x ≤ 0.22 0.25 0.3 0.35 0.4 0.45 5 10 15 20 < 0.25 bj x ≤ 0.24 Data Bacchetta2011 Barone2015 Anselmino2014 0.25 0.3 0.35 0.4 5 10 15 < 0.27 bj x ≤ 0.25 0.2 0.25 0.3 0.35 0.4 5 10 15 < 0.30 bj x ≤ 0.27 0.2 0.25 0.3 0.35 5 10 < 0.32 bj x ≤ 0.30 0.2 0.3 2 4 6 8 < 0.35 bj x ≤ 0.32 (GeV) t P 0.1 0.2 0.3 2 4 6 < 0.45 bj x ≤ 0.35
FIG. 11. (color online). 2D binning cross section for π+
channel. The red circles are from the data, the black solid lines are from the model [17], the blue dashed lines are from the model [15] and the green dotted lines are from the model [16]. The error bars represent the statistical uncertainties of the data. The error band on the bottom of each panel represents the experimental systematic uncertainty. 0.35 0.4 0.45 0.5 ] -2 [nb GeV σ d 10 20 < 0.18 bj x ≤ 0.14 0.35 0.4 0.45 5 10 15 20 < 0.20 bj x ≤ 0.18 0.3 0.35 0.4 0.45 5 10 15 < 0.22 bj x ≤ 0.20 0.3 0.35 0.4 0.45 5 10 < 0.24 bj x ≤ 0.22 0.25 0.3 0.35 0.4 0.45 5 10 < 0.25 bj x ≤ 0.24 Data Bacchetta2011 Barone2015 Anselmino2014 0.25 0.3 0.35 0.4 5 10 < 0.27 bj x ≤ 0.25 0.2 0.25 0.3 0.35 0.4 2 4 6 8 < 0.30 bj x ≤ 0.27 0.2 0.25 0.3 0.35 2 4 6 < 0.32 bj x ≤ 0.30 0.2 0.3 2 4 < 0.35 bj x ≤ 0.32 (GeV) t P 0.1 0.2 0.3 1 2 3 4 < 0.45 bj x ≤ 0.35
FIG. 12. (color online). 2D binning cross section for π−channel. The definitions of the markers, the lines and the bands are the same as the figure above for π+
channel.
when applied to the data in this study, would result in the intrinsic transverse momentum width hk2
⊥i of the quarks
in the nucleon being consistent with zero at small central values, which contradicts the results from the global anal-yses [15–17]. The effect of including the Boer-Mulders terms as parameterized in [15] was tested to be negligi-ble (less than 2% in the kinematic range of this study).
To examine the data’s constraint on the intrinsic widths with relaxed model formulations, two adjusted functional forms were used to do the fitting in the 3D bins with the φh information. The first one includes
the structure functions FUU and FUUcosφh, with an
ad-ditional fitting parameter A to tune the amplitude of modulation as A · FUUcosφh. The results of the fitting are
hk2
⊥i = 0.078±0.1505 GeV2, hp2⊥i = 0.1925±0.0464 GeV2
and A = 0.0119 ± 0.1971. The intrinsic widths hk2 ⊥i and
hp2
⊥i are under loose constraint individually while the
amplitude of A · FUUcosφh is suppressed by a small factor
A.
The second one includes the structure functions FUU,
FUUcosφh and FUUcos 2φh, with an additional fitting param-eter A to tune the amplitude of modulation as A · (FUUcosφh+ FUUcos 2φh). The results of the fitting are hk2
⊥i =
0.080 ± 0.1542 GeV2, hp2
⊥i = 0.1918 ± 0.0475 GeV2 and
A = 0.0077 ± 0.1820. The intrinsic widths are under sim-ilar constraint as in the first case with a small factor A suppressing the amplitude of A · (FUUcosφh+ F
cos 2φh
UU ).
bj x 0.2 0.3 0.4 - σ /d + σ d 1.4 1.6 1.8 2 Data Model
FIG. 13. (color online). SIDIS differential cross section ra-tio σπ+
/σπ−
comparison in pseudo-1D xbj bins. The red solid circles are from the data and the black open circles are from the quark-parton model. The error bar of each point of data represents the statistical uncertainty. The error bars for the model parameterization uncertainty are smaller than the marker size. The error band on the bottom represents the systematic uncertainty of the data.
FUUcos 2φh, the parameters hk2
⊥i and hp2⊥i in the SIDIS
channels appear as the combined quantity hP2
ti.
Sen-sitivity to hP2
ti is explicitly provided by the Pt behavior
of the data. The comparison between the data and the models in the two functional forms (with and without FUUcosφh and F
cos 2φh
UU ) using the parameters from fitting
in 2D bins of the data are shown in Figs. 17and 18.
VI. CONCLUSION
We report the first measurement of the unpolarized SIDIS differential cross section of π± production from
a 3He target in a kinematic range 0.12 < x
bj < 0.45,
1 < Q2 < 4 (GeV/c)2, 0.45 < z
h < 0.65, and 0.05 <
Pt< 0.55 GeV/c. Results in multi-dimensional bin sets
show that the model from [17] compares the best with the data when approximating the 3He nucleus as two
pro-tons and one neutron (PWIA) in the SIDIS processes. The existing models [15–17] in the framework of naive x-z factorix-zation and fitting different types of global data (multiplicities and/or asymmetries), deviate from our re-sults to certain extents in different kinematic ranges.
Azimuthal modulations in unpolarized SIDIS are ob-served to be consistent with zero within the experimental uncertainties in this study. Using the specific functional form as in the global analysis [15], the fitting results show that the width of quark intrinsic transverse momentum hk2
⊥i is much smaller than the results from the global
analyses of other types of data [15–17]. With relaxed model formulation, hk2
⊥i and hp2⊥i are under looser
con-straint individually, while the combined quantity hP2 ti is
constrained by the Pt behavior of the data. The widths
hk2
⊥i and hp2⊥i in the structure functions, related to the
azimuthal modulations are determined consistently using the extracted cross sections with and without the infor-mation of φh.
It is foreseeable that the simple formulation (naive x-z factorix-zation) based on simplified TMD factorix-zation and the Gaussian ansatz needs to be updated to describe multiple types of data (multiplicities, asymmetries and cross sections) in different kinematic ranges, at the same time.
The future 12 GeV SIDIS programs at JLab with SoLID combining high luminosities and a large accep-tance including a full azimuthal coverage [45, 46] will provide opportunities for precision measurements of the SIDIS differential cross sections as well as the azimuthal modulations in a broad kinematic range. These data will significantly benefit the developments of the TMD phe-nomenology and models.
VII. ACKNOWLEDGEMENTS
We acknowledge the outstanding support of the JLab Hall A staff and the Accelerator Division in accomplish-ing this experiment. This work was supported in part by the U. S. National Science Foundation, and by De-partment of Energy (DOE) contract number DE-AC05-06OR23177, under which the Jefferson Science Associates operates the Thomas Jefferson National Accelerator Fa-cility. This work was also supported in part by the U.S. Department of Energy under Contract DE-FG02-03ER41231 and the National Natural Science Foundation of China No. 11120101004.
Appendix A: Acceptance correction
The numbers of events in a specific bin of data, weighted and non-weighted simulations are expressed as
Ndata= dσ dP HSd· ∆P HSd· facc,d· Ld, (A1) Nsim= dσ dP HSs· ∆P HSs· facc,s· Ls, (A2) Nphs= 1 · ∆P HSs· facc,s· Ls, (A3)
where Ndatais the number of events from the data, Nsim
from the weighted simulation and Nphs from the
non-weighted simulation. dσ
dP HS dis the (averaged) differential
cross section from the data in a specific bin, and dP HS sdσ from the theory in the weighted simulation. ∆P HSd
is the total phase space in the data for a specific bin, and ∆P HSsin the simulations. facc,d is the acceptance
factor in the data, and facc,sin the simulations. Ldis the
luminosity in the data, and Ls in the simulations. The
data luminosity Ld is the product of the total number
B -1 0 1 2 < 0.25 bj x ≤ 0.16 (GeV) < 0.34 t P ≤ 0.05 -1 0 1 2 < 0.29 bj x ≤ 0.25 (GeV) < 0.34 t P ≤ 0.05 -1 0 1 2 < 0.31 bj x ≤ 0.29 (GeV) < 0.34 t P ≤ 0.05 -1 0 1 2 < 0.34 bj x ≤ 0.31 (GeV) < 0.34 t P ≤ 0.05 -1 0 1 2 < 0.45 bj x ≤ 0.34 (GeV) < 0.34 t P ≤ 0.05 B -1 0 1 2 < 0.18 bj x ≤ 0.14 (GeV) < 0.54 t P ≤ 0.34 -1 0 1 2 < 0.20 bj x ≤ 0.18 (GeV) < 0.54 t P ≤ 0.34 -1 0 1 2 < 0.21 bj x ≤ 0.20 (GeV) < 0.54 t P ≤ 0.34 -1 0 1 2 < 0.23 bj x ≤ 0.21 (GeV) < 0.54 t P ≤ 0.34 -1 0 1 2 < 0.44 bj x ≤ 0.23 (GeV) < 0.54 t P ≤ 0.34 + π -π
FIG. 14. (color online). Parameter B’s in 3D binning A · (1 − B · cos φh) fit.
] 2 [GeV 〉 2 p 〈 0.205 0.21 0.215 0.22 〉 2 k 〈 -0.02 0 0.02 0.04 0.205 0.21 0.215 0.22 ] 2 [GeV -0.02 0 0.02 0.04
FIG. 15. (color online). Fitting contours with total unpolar-ized SIDIS cross section (refer to the text). The top panel is for the fitting results using the 2D bins (10 × 10) data, the bottom panel for the 3D bins (2 × 5 × 10). The central values of the fitting are the black crosses. The three contours from the smallest to the largest in each panel correspond to δχ2
= 1, 2.3 and 6.2, respectively.
live-time of the data-acquisition system and the target thickness (from the target density and the target length). The description of experimental acceptance can be tested by using known channels, where dσ
dP HS d= dσ dP HS s,
with proper scaling of the luminosities. The tested frame-work of simulation provides ∆P HSs = ∆P HSd and
facc,s = facc,d. The data have to be corrected by all
the other data corrections for meaningful comparisons of the numbers of events Ndata and Nsim in each bin.
The (averaged) differential cross section from the the-ory can be retrieved by Nsim/Nphs, and the cross section
] 2 [GeV 〉 2 p 〈 0.1 0.15 0.2 0.25 〉 2 k 〈 -0.4 -0.2 0 0.2 0.4 0.1 0.15 0.2 0.25 ] 2 [GeV -0.4 -0.2 0 0.2 0.4
FIG. 16. (color online). Fitting contours with non-modulated unpolarized SIDIS cross section (Fcosφh
U U and F
cos 2φh
U U set to
zero: refer to the text). The top panel is for the fitting results using the 2D bins (10 × 10) data, the bottom panel for the 3D bins (2 × 5 × 10). The central values of the fitting are the black crosses. The three contours from the smallest to the largest in each panel correspond to δχ2
= 1, 2.3 and 6.2, respectively.
extracted from the data is expressed as (Ndata/Nphs) ×
(Ls/Ld).
Appendix B: SIDIS cross section data table
The SIDIS differential cross sections in 2D and 3D bins and the corresponding kinematic variables are presented in the tables below.
0.35 0.4 0.45 0.5 ] -2 [nb GeV σ d 10 20 30 < 0.18 bj x ≤ 0.14 0.35 0.4 0.45 5 10 15 20 25 < 0.20 bj x ≤ 0.18 0.3 0.35 0.4 0.45 5 10 15 20 < 0.22 bj x ≤ 0.20 0.3 0.35 0.4 0.45 5 10 15 < 0.24 bj x ≤ 0.22 0.25 0.3 0.35 0.4 0.45 5 10 15 < 0.25 bj x ≤ 0.24 Data (total) σ (no mod) σ 0.25 0.3 0.35 0.4 5 10 < 0.27 bj x ≤ 0.25 0.2 0.25 0.3 0.35 0.4 5 10 < 0.30 bj x ≤ 0.27 0.2 0.25 0.3 0.35 5 10 < 0.32 bj x ≤ 0.30 0.2 0.3 2 4 6 < 0.35 bj x ≤ 0.32 (GeV) t P 0.1 0.2 0.3 2 4 6 < 0.45 bj x ≤ 0.35
FIG. 17. (color online). 2D binning cross section for π+
channel. The red circles are from the data. The black solid lines are from the model including the structure functions FU U, F
cosφh U U and F cos 2φh U U with parameters hk 2 ⊥i and hp 2 ⊥i from stand-alone data fitting. The blue dashed lines are from the model including only the structure functions FU U with parameters hk⊥2i and hp2
⊥i from fitting the data of this work only. The error bars represent the statistical uncertainties of the data. The error band on the bottom of each panel represents the experimental systematic uncertainty.
0.35 0.4 0.45 0.5 ] -2 [nb GeV σ d 5 10 15 20 < 0.18 bj x ≤ 0.14 0.35 0.4 0.45 5 10 15 < 0.20 bj x ≤ 0.18 0.3 0.35 0.4 0.45 5 10 < 0.22 bj x ≤ 0.20 0.3 0.35 0.4 0.45 5 10 < 0.24 bj x ≤ 0.22 0.25 0.3 0.35 0.4 0.45 2 4 6 8 10 < 0.25 bj x ≤ 0.24 Data (total) σ (no mod) σ 0.25 0.3 0.35 0.4 2 4 6 8 < 0.27 bj x ≤ 0.25 0.2 0.25 0.3 0.35 0.4 2 4 6 < 0.30 bj x ≤ 0.27 0.2 0.25 0.3 0.35 2 4 < 0.32 bj x ≤ 0.30 0.2 0.3 1 2 3 4 < 0.35 bj x ≤ 0.32 (GeV) t P 0.1 0.2 0.3 1 2 3 < 0.45 bj x ≤ 0.35
FIG. 18. (color online). 2D binning cross section for π−channel. The definitions of the markers, the lines and the bands are the same as the figure above for π+
TABLE II. Unpolarized SIDIS cross section in 3D bins for the π+
channel. Q2
is in unit of GeV2
, Ptin unit of GeV, φhin unit of rad. dσ stands for dσ/(dxbjdydzhdφSdPt2dφh) in unit of nb · GeV−2· rad−2. Stat. unc. and Sys. unc. stand for statistical and systematic uncertainties, respectively, in unit of nb · GeV−2· rad−2.
xbj Q2 y zh Pt φh dσ Stat. unc. Sys. unc. xbj Q2 y zh Pt φh dσ Stat. unc. Sys. unc.
0.226 1.95 0.783 0.504 0.312 2.53 12.62 0.68 0.83 0.226 1.95 0.783 0.504 0.312 2.73 14.72 0.78 0.98 0.226 1.95 0.783 0.504 0.312 2.86 14.79 0.78 0.96 0.226 1.95 0.783 0.504 0.312 2.97 14.87 0.82 0.92 0.226 1.95 0.783 0.504 0.312 3.07 13.33 0.71 0.79 0.226 1.95 0.783 0.504 0.312 3.17 13.93 0.73 1.2 0.226 1.95 0.783 0.504 0.312 3.27 14.61 0.77 1 0.226 1.95 0.783 0.504 0.312 3.38 12.53 0.67 0.84 0.226 1.95 0.783 0.504 0.312 3.5 12.61 0.71 0.85 0.226 1.95 0.783 0.504 0.312 3.69 14.56 0.7 0.98 0.27 2.26 0.758 0.522 0.287 2.39 8.842 0.43 0.67 0.27 2.26 0.758 0.522 0.287 2.61 8.457 0.42 0.68 0.27 2.26 0.758 0.522 0.287 2.75 9.518 0.47 0.76 0.27 2.26 0.758 0.522 0.287 2.89 8.713 0.43 0.69 0.27 2.26 0.758 0.522 0.287 3.02 8.187 0.42 0.58 0.27 2.26 0.758 0.522 0.287 3.14 8.969 0.47 0.95 0.27 2.26 0.758 0.522 0.287 3.27 9.084 0.43 0.7 0.27 2.26 0.758 0.522 0.287 3.41 9.17 0.44 0.74 0.27 2.26 0.758 0.522 0.287 3.55 9.306 0.47 0.72 0.27 2.26 0.758 0.522 0.287 3.78 8.685 0.37 0.68 0.299 2.45 0.741 0.534 0.267 2.27 7.354 0.35 0.46 0.299 2.45 0.741 0.534 0.267 2.52 7.077 0.34 0.45 0.299 2.45 0.741 0.534 0.267 2.68 6.695 0.32 0.44 0.299 2.45 0.741 0.534 0.267 2.84 7.507 0.35 0.5 0.299 2.45 0.741 0.534 0.267 3 7.471 0.35 0.46 0.299 2.45 0.741 0.534 0.267 3.16 7.268 0.34 0.62 0.299 2.45 0.741 0.534 0.267 3.32 6.759 0.33 0.43 0.299 2.45 0.741 0.534 0.267 3.48 6.93 0.33 0.5 0.299 2.45 0.741 0.534 0.267 3.64 7.676 0.38 0.56 0.299 2.45 0.741 0.534 0.267 3.88 6.556 0.29 0.44 0.327 2.63 0.726 0.546 0.243 2.17 6.066 0.29 0.38 0.327 2.63 0.726 0.546 0.243 2.41 6.014 0.29 0.42 0.327 2.63 0.726 0.546 0.243 2.58 5.696 0.28 0.39 0.327 2.63 0.726 0.546 0.243 2.75 6.46 0.3 0.45 0.327 2.63 0.726 0.546 0.243 2.93 5.579 0.28 0.38 0.327 2.63 0.726 0.546 0.243 3.12 5.458 0.26 0.45 0.327 2.63 0.726 0.546 0.243 3.31 5.735 0.28 0.39 0.327 2.63 0.726 0.546 0.243 3.49 5.343 0.26 0.38 0.327 2.63 0.726 0.546 0.243 3.67 5.981 0.29 0.43 0.327 2.63 0.726 0.546 0.243 3.95 4.986 0.21 0.35 0.371 2.89 0.706 0.561 0.198 2.02 4.479 0.16 0.3 0.371 2.89 0.706 0.561 0.198 2.25 4.664 0.17 0.31 0.371 2.89 0.706 0.561 0.198 2.43 4.881 0.17 0.35 0.371 2.89 0.706 0.561 0.198 2.61 4.518 0.16 0.33 0.371 2.89 0.706 0.561 0.198 2.81 4.022 0.15 0.28 0.371 2.89 0.706 0.561 0.198 3.04 4.278 0.15 0.29 0.371 2.89 0.706 0.561 0.198 3.28 4.116 0.15 0.27 0.371 2.89 0.706 0.561 0.198 3.51 4.402 0.15 0.33 0.371 2.89 0.706 0.561 0.198 3.73 4.355 0.15 0.33 0.371 2.89 0.706 0.561 0.198 4.05 4.764 0.13 0.34 0.163 1.49 0.826 0.48 0.427 2.52 18.78 0.96 2.4 0.163 1.49 0.826 0.48 0.427 2.71 18.58 0.95 2.4 0.163 1.49 0.826 0.48 0.427 2.84 18.59 0.95 2.4 0.163 1.49 0.826 0.48 0.427 2.95 21.01 1.1 2.7 0.163 1.49 0.826 0.48 0.427 3.05 18.68 0.99 2.4 0.163 1.49 0.826 0.48 0.427 3.15 17.14 0.94 2.3 0.163 1.49 0.826 0.48 0.427 3.26 16.49 0.83 2.1 0.163 1.49 0.826 0.48 0.427 3.38 16.66 0.87 2.1 0.163 1.49 0.826 0.48 0.427 3.59 16.49 0.63 2.1 0.163 1.49 0.826 0.48 0.427 3.59 16.49 0.63 2.1 0.187 1.69 0.816 0.486 0.404 2.47 15.93 0.83 1.4 0.187 1.69 0.816 0.486 0.404 2.65 15.89 0.85 1.4 0.187 1.69 0.816 0.486 0.404 2.78 16.45 0.87 1.4 0.187 1.69 0.816 0.486 0.404 2.9 15.63 0.83 1.4 0.187 1.69 0.816 0.486 0.404 3.02 15.61 0.81 1.4 0.187 1.69 0.816 0.486 0.404 3.14 16.14 0.85 1.6 0.187 1.69 0.816 0.486 0.404 3.26 16.38 0.86 1.4 0.187 1.69 0.816 0.486 0.404 3.38 14.45 0.78 1.3 0.187 1.69 0.816 0.486 0.404 3.51 14.89 0.77 1.3 0.187 1.69 0.816 0.486 0.404 3.7 14.13 0.76 1.2 0.205 1.83 0.808 0.49 0.395 2.43 12.14 0.62 0.76 0.205 1.83 0.808 0.49 0.395 2.61 13.3 0.67 0.81 0.205 1.83 0.808 0.49 0.395 2.74 13.7 0.68 0.84 0.205 1.83 0.808 0.49 0.395 2.86 13.47 0.7 0.85 0.205 1.83 0.808 0.49 0.395 2.99 13.12 0.66 0.8 0.205 1.83 0.808 0.49 0.395 3.12 12.99 0.69 0.97 0.205 1.83 0.808 0.49 0.395 3.25 13.6 0.68 0.82 0.205 1.83 0.808 0.49 0.395 3.39 13.09 0.65 0.84 0.205 1.83 0.808 0.49 0.395 3.52 12.01 0.62 0.76 0.205 1.83 0.808 0.49 0.395 3.72 12.06 0.58 0.74 0.223 1.97 0.799 0.496 0.385 2.38 11.45 0.58 0.7 0.223 1.97 0.799 0.496 0.385 2.55 11.84 0.6 0.71 0.223 1.97 0.799 0.496 0.385 2.68 10.32 0.54 0.61 0.223 1.97 0.799 0.496 0.385 2.81 10.5 0.53 0.62 0.223 1.97 0.799 0.496 0.385 2.96 10.29 0.52 0.58 0.223 1.97 0.799 0.496 0.385 3.12 11.29 0.57 0.73 0.223 1.97 0.799 0.496 0.385 3.27 12.24 0.65 0.73 0.223 1.97 0.799 0.496 0.385 3.41 10.24 0.53 0.64 0.223 1.97 0.799 0.496 0.385 3.55 10.18 0.54 0.61 0.223 1.97 0.799 0.496 0.385 3.75 9.974 0.47 0.59 0.256 2.21 0.782 0.507 0.37 2.16 8.558 0.31 0.53 0.256 2.21 0.782 0.507 0.37 2.35 9.222 0.33 0.55 0.256 2.21 0.782 0.507 0.37 2.48 8.955 0.34 0.54 0.256 2.21 0.782 0.507 0.37 2.6 8.573 0.33 0.52 0.256 2.21 0.782 0.507 0.37 2.74 8.131 0.31 0.48 0.256 2.21 0.782 0.507 0.37 2.93 7.682 0.29 0.46 0.256 2.21 0.782 0.507 0.37 3.16 8.364 0.32 0.48 0.256 2.21 0.782 0.507 0.37 3.38 7.965 0.31 0.49 0.256 2.21 0.782 0.507 0.37 3.57 7.827 0.29 0.48 0.256 2.21 0.782 0.507 0.37 3.83 7.988 0.23 0.5

![FIG. 7. (color online). 3D binning cross section for π + channel. The red circles are from the data, the black solid lines are from the model [17], the blue dashed lines are from the model [15] and the green dotted lines are from the model [16]](https://thumb-eu.123doks.com/thumbv2/123doknet/14117868.467200/10.918.124.815.77.348/color-online-binning-section-channel-circles-dashed-dotted.webp)
![FIG. 11. (color online). 2D binning cross section for π + channel. The red circles are from the data, the black solid lines are from the model [17], the blue dashed lines are from the model [15] and the green dotted lines are from the model [16]](https://thumb-eu.123doks.com/thumbv2/123doknet/14117868.467200/12.918.130.801.74.346/color-online-binning-section-channel-circles-dashed-dotted.webp)