NUTRITION EPIDEMIOLOGY HIGHLIGHTS ORIGINAL ARTICLE
Omega-3 index levels and associated factors in a middle-aged
French population: the MONA LISA-NUT Study
A Wagner1, C Simon2, B Morio3,4, J Dallongeville5, JB Ruidavets6, B Haas1, B Laillet3,4, D Cottel5, J Ferrières6and D Arveiler1
BACKGROUND/OBJECTIVES: The omega-3 index (the summed percentage content of eicosapentaenoic and docosahexaenoic acids in red blood cells) is associated with a lower risk of fatal coronary heart disease and sudden cardiac death. We aimed to determine which socio-demographic, behavioural or clinical factors are independently associated with the omega-3 index and the extent to which seafood consumption mediates the index’s association with socio-economic status (SES).
SUBJECTS/METHODS: As part of the cross-sectional MONA LISA-NUT survey (2005–2007), gas chromatography was used to analyse the red blood cell fatty acid composition in 503 French subjects aged 35–64 years. Dietary data were collected by trained dieticians via a validated food frequency questionnaire and a prospective 3-day food record. Risk factors were estimated with standardised measurements and questionnaires. SES was assessed through the self-reported educational and income tax levels.
RESULTS: The mean ± s.d. omega-3 index was 6.02 ± 1.75%. In the best parsimonious predictive model (which explained 32% of the variability in the omega-3 index), age, educational level and seafood servings were significantly and positively associated with the index. In contrast, waist circumference and smoking were inversely associated with the index. In a mediation analysis that took account of all these factors, seafood servings explained about 40% of the association between educational level and the omega-3 index. Similar results were obtained for the income tax level.
CONCLUSIONS: The inverse association between SES and omega-3 index is largely explained (40%) by an insufficient seafood intake. It remains to be seen which other factors mediate this association.
European Journal of Clinical Nutrition (2015)69, 436–441; doi:10.1038/ejcn.2014.219; published online 22 October 2014
INTRODUCTION
High dietary and blood levels of long-chain n-3 polyunsaturated fatty acids are associated with a lower risk of coronary heart disease (CHD) and sudden cardiac death.1,2 The fatty acid composition of red blood cells (RBCs) is considered to be a suitable biomarker of long-term long-chain n-3 polyunsaturated fatty acid (PUFA) intake.3It is particularly useful in epidemiological studies and has a low biological variability.4 Furthermore, the omega-3 index (defined as the summed content of eicosapentae-noic acid (EPA) and docosahexaeeicosapentae-noic acid (DHA) in RBC membranes as a percentage of total fatty acids) is known to be highly correlated with human myocardial n-3 fatty acid content.5 Hence, the omega-3 index is increasingly considered to be a novel indicator of risk for primary cardiac arrest and fatal CHD.6,7
The dietary intake of EPA and DHA increases the omega-3 index, which may also vary according to additional individual or environmental factors. However, only a few studies (including just one in Europe8) have produced sometimes-conflicting information on the potential influence of demographic, behavioural and biological factors (such as gender, age, socioeconomic status (SES), body mass index, alcohol consumption and diabetes), on this parameter.8–14 Despite the fact that social inequalities have a confirmed impact on the incidence of CHD, the role of dietary n-3 fatty acid intake in these associations is yet to be established. More specifically, it is not known what proportion of the association between SES and the omega-3 index can be explained
by diet (such as omega-3 fatty acid intake or seafood consumption that contains a high level of EPA+DHA) or other factors.11Yet, a better knowledge of these factors could help to identify and provide effective dietary advice or supplementation with n-3 fatty acids in subjects at the highest risk of CHD morbidity and mortality.
Therefore, the objective of the present study was to determine which factors are independently associated with the omega-3 index and the extent to which seafood consumption may mediate the index’s association with SES.
MATERIALS AND METHODS Study population
The MONA LISA Study was a cross-sectional, population-based, epidemio-logical, multicentre study conducted in 2005–2007 in the three French centres that had previously participated in the WHO-MONICA population surveys of cardiovascular risk factors.15–18Briefly, inhabitants aged 35–74 years living in the Lille Urban Community (northern France), the Bas-Rhin county (eastern France) and the Haute-Garonne county (southern France) were randomly sampled from electoral rolls after stratification by town size, gender and 10-year age group. The protocol was approved by the appropriate independent ethics committees. All subjects gave their written, informed consent to participation. The participation rate was 50% for men and 51% for women. All the subjects aged between 35 and 64 were invited to participate in a dietary assessment; 88% accepted and thus constituted the subsample for the MONA LISA-NUT study.
1
Department of Epidemiology and Public Health, EA 3430, FMTS, University of Strasbourg, Strasbourg, France;2
CarMen, INSERM 1060/University Lyon 1, INRA U1235, CRNH Rhônes-Alpes, Lyon, France;3
Clermont University, University of Auvergne, Department of Human Nutrition, Clermont-Ferrand, France;4
INRA, UMR 1019, UNH, CRNH Auvergne, Clermont-Ferrand, France;5
Department of Epidemiology and Public Health, INSERM U744, Lille Pasteur Institute, University Lille Nord-de France, Lille, France and6
Department of Epidemiology, INSERM UMR 1027, University Paul Sabatier of Toulouse, Toulouse, France. Correspondence: Dr A Wagner, Laboratoire d’épidémiologie et de santé publique EA 3430, Faculté de médecine 4 rue Kirschleger, Strasbourg Cedex 67085, France.
E-mail: aline.wagner@unistra.fr
Received 6 April 2014; revised 23 August 2014; accepted 3 September 2014; published online 22 October 2014
Measurement of the RBC fatty acid composition was scheduled in 540 MONA LISA-NUT study participants (30 men and 30 women per 10-year age group and per centre). To ensure that this subsample was adequately distributed throughout the year, we randomly selected 10 participants per gender, 10-year age group and centre in three different seasons: summer 2006 (summer 2007 for the 35–44 age group), winter 2006-2007 and spring 2007.
Data collection
All data were collected by trained medical staff according to standardised protocols (based on the WHO-MONICA Project protocol).19Heart rate and systolic and diastolic blood pressures were measured with an automatic sphygmomanometer (OMRON 705IT, OMRON Healthcare Europe, Hoofddorp, The Netherlands) and a tailored sized cuff with the arm at heart level, after the subject had been sitting for at least 10 min. The mean of two measurements made 30 min apart was used in the study analysis. Standardised anthropometric measurements (weight and height) were made on subjects in light clothing without shoes and body mass index was calculated. Waist circumference (WC) was recorded with a tape measure at midpoint between the upper border of the iliac crest and the lower border of the rib cage.
During a face-to-face interview, participantsfilled out a questionnaire on demographic variables, SES (educational level, income tax level), smoking, alcohol consumption, their personal medical history and medication use. Participants were considered to have diabetes if they were being treated with hypoglycaemic medications or if their fasting blood glucose levels were at least 7 mmol/l. Alcohol consumption (from wine, beer, cider, aperitifs and spirits) was scored day by day over a typical week. The total mean daily alcohol intake (in grams) was then calculated. Subjects were classified as being abstinent, low alcohol consumers or high alcohol consumers (⩾20 g/day for women and ⩾ 40 g/day for men).20 Subjects reporting at least one cigarette per day were classified as current smokers. Participants reporting at least 20 min of intense physical activity outside work once a week or more were classified as performing regular, intense physical activity. Educational level or income tax level was considered as a proxy for SES. Subjects were classified as having a low educational level (no formal education or primary or middle school education), a moderate educational level (secondary education) or a high educational level (further or higher education).
Dietary assessment
The nutritional survey was carried out according to the EURONUT protocol.21 Subjects had to record their food consumption for 3 days (two week-days and one weekend day) and specify the nature and the estimated quantity of the food and drink consumed at each intake. These data were specified with the assistance of a validated handbook of photographed portions22 during a meeting with a trained dietician
1–7 days following the food record. A short, validated, qualitative food frequency questionnaire23 was also filled out by the dietician, who
recorded the participant’s responses for the 24 items (split in nine frequency terms). One of these items referred to the seafood intake. The frequency of seafood intake was categorised in four levels: 1 or no serving per month; 2 servings per month; 1 serving per week; at least 2 or 3 servings per week.
Fatty acid measurements in RBCs
After a 10-h fast and before the physical examination, a blood sample was drawn into EDTA tubes and centrifuged at 4 °C to separate the cells from the plasma. The RBCs were frozen at − 80 °C until analyses were performed in the same laboratory (UMR1019, Clermont-Ferrand, France). A full description of the laboratory measurements is shown in the Supplementary material. Briefly, the RBC phospholipids were extracted as described by Folch et al.,24and fatty acid methyl esters were prepared as
previously described25 and then purified on florisil (Chromabond,
Macherey-Nagel, Germany). The fatty acid composition of the RBC membranes was measured by gas chromatography (Trace, Thermo Electron Corp, Madison, WI, USA) with a CP-Sil88 capillary column. The coefficient of variation for EPA+DHA peak was 2.7% (around 0.1% in absolute percentage). The omega-3 index was calculated as a percentage: [(EPA+DHA)/sum of all fatty acids] × 100.
Laboratory methods
All samples were analysed in the same laboratory at the Pasteur Institute of Lille (Lille, France). Total cholesterol and triglycerides were measured with enzyme-based assays (Olympus Corporation, Tokyo, Japan). High-density lipoprotein cholesterol was measured after sodium phosphotungstate/ magnesium chloride precipitation (Olympus Corp). Low-density lipoprotein cholesterol was calculated with the Friedewald equation when triglyceride levels were lower than 4.56 mmol/l. Glucose was measured using the standard glucose hexokinase method (DuPont Dimension, Brussels, Belgium).
Statistical analysis
Linear regression analyses were used to assess the relationship between the omega-3 index (as the dependent variable) and 20 potential determinants selected a priori on the basis of previous studies. Nutrient intakes were adjusted for energy intake according to the residual method.26To account for the number of tests in the univariate analyses, Bonferroni correction was applied and threshold for statistical significance was adjusted to 0.05/20 = 0.0025.
The cutoff point for inclusion in the multivariable model was a P-value ⩽ 0.25 in a univariate analysis. Given that body mass index and WC were highly correlated, only WC was included in the candidate variables. Similarly, we chose to use educational level as a proxy for SES in our initial analyses and income tax in subsequent analyses. We selected parsimo-nious models with the GLMSELECT procedure. In line with a previous study,12the best model was chosen using the Schwartz Bayesian criterion
with stepwise variable selection. The‘centre’ variable was forced into all models.
To test for a mediating effect of seafood consumption on the relationship between educational level and the omega-3 index, we used the three-step Baron and Kenny approach.27 Firstly, we regressed the
omega-3 index against the educational level, in order to establish a significant association (estimate c). Secondly, we searched for a significant relationship between educational level and seafood consumption (estimate a). Thirdly, we regressed the omega-3 index against both educational level and seafood consumption, in order to obtain (i) an estimate of the relationship between educational level and the omega-3 index while controlling for seafood consumption (estimate c’) and (ii) an estimate of the association between seafood consumption and the omega-3 index (estimate b). The amount of mediation was quantified as 1-(c’/c).
To assess the significance of a mediating effect of seafood consumption on the relationship between educational level and the omega-3 index, we tested the product of the coefficients (a × b) with the percentile bootstrap method and thus derived its confidence interval.28,29
All statistical analyses were conducted with SAS software (version 9.2, 2010, SAS Institute Inc., Cary, NC, USA).
RESULTS
The RBC fatty acid composition was obtained for 519 participants with a dietary assessment. Thefinal sample for the multivariable analyses comprised 503 participants with a complete set of covariate data. The participants’ characteristics by geographical area are summarised in Supplementary Table 1.
Omega-3 index levels
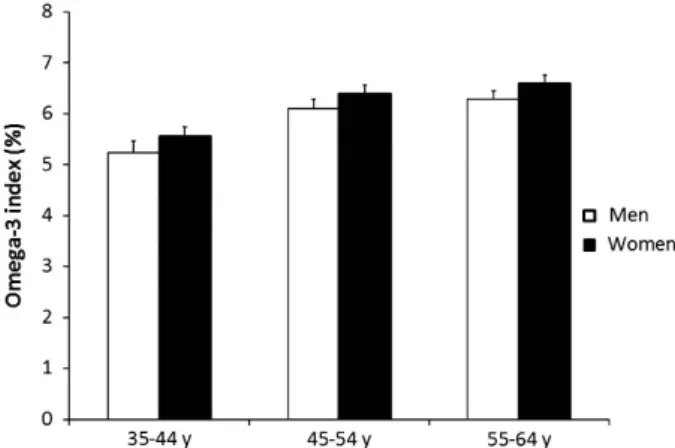
The individual omega-3 index values were normally distributed, with a mean ± s.d. of 6.02 ± 1.75% and range of 0.65–11.22%. On average, the index was significantly higher in women (Po0.05) and increased with age (Po10− 4), with no evidence of an interaction between these factors (Figure 1). In both genders, the age-adjusted mean omega-3 index was lower in eastern France than in south-western France. An intermediate value was observed in northern France (Table 1).
Independent correlates of the omega-3 index
In univariate analyses, the following factors were positively associated with the omega-3 index: age, seafood consumption, educational level, income tax, energy-adjusted intake of EPA and
DHA, residence in south-western France. In contrast, current smoking was inversely associated with the index (Tables 2 and 3). The best parsimonious predictive model of the omega-3 index is described in Table 4. With the exception of the forced ‘centre’ variable, the model includes 5 of the 14 candidate variables. The factors significantly, positively and independently associated with the omega-3 index were age, educational level and the frequency of seafood consumption. Having a high WC and (to a lesser extent) being a current smoker was associated with a low omega-3 index. Gender, the physical activity level, statin use, diastolic blood pressure, low-density lipoprotein cholesterol, heart rate, energy-adjusted omega-6 intake and α-linolenic acid intake were not independently associated with the omega-3 index. It is note-worthy that educational level and seafood consumption were present in all models, regardless of the method of selection (the Schwartz Bayesian criterion, the Bayesian information criterion or Mallow’s CP) and the demographic variables (gender, age and centre) forced into the model (data not shown).
The results were similar when we applied a fully adjusted model that included all the candidate variables and explained 34% of the variability in the omega-3 index (Supplementary Table 2). None of the variables interacted with gender (data not shown).
Seafood consumption as a mediator of the SES-omega-3 index association
All the estimates obtained with the three-step Baron and Kenny approach were statistically significant (Supplementary Table 3). Seafood consumption attenuated the association between SES and the omega-3 index (Table 5). Thus, the coefficient for highly educated participants fell from 1.020 to 0.624 after adjustment for seafood consumption, suggesting that seafood consumption mediates 39% of the educational level–omega-3 index relation-ship. According to the percentile bootstrap, this is a significant mediating effect. A 40% mediating effect of seafood consumption was also observed when educational level was assessed continuously (i.e., as years of fulltime education). Likewise, similar results were obtained when the income tax level was analysed as a proxy for SES. Adjustment for the complete set of candidate variables only slightly reduced these mediating effects (Supplementary Table 4).
DISCUSSION
A low omega-3 index has been shown to be a strong predictor of sudden cardiac death.7 Thus, determining the demographic, behavioural and clinical characteristics associated with a low
omega-3 index might help to identify subjects at high cardiovas-cular risk. After correcting for geographical area, we found that seafood consumption, age, educational level, WC and smoking were independent correlates of the omega-3 index in middle-aged subjects. We also found that seafood consumption partially mediated the relationship between SES and the omega-3 index.
We observed a mean omega-3 index of 6%. The index was slightly higher in south-western France than in northern or eastern France, in agreement with the country’s well-known north-south decrease in CHD (which may be due in part to higher seafood consumption in the south). However, geographical area remained a significant predictor of the omega-3 index after adjusting for seafood consumption. The greater effect of living in the north of France (relative to the east) requires further investigation.
Figure 1. Distribution of the omega-3 index by age group and gender in a French population (data are means and s.e.). Analysis of variance: Po0.05 for gender and Po10− 4for age.
Table 1. Age-adjusted means of the omega-3 index by gender and geographical area Lille Urban Community Bas-Rhin county Haute-Garonne county P Men 5.83 (0.18) 5.44 (0.19) 6.40 (0.19)a 0.002 Women 6.12 (0.17) 5.88 (0.17) 6.55 (0.17)b 0.019 aSignificantly different from Bas-Rhin county P = 0.0014. bSignificantly
different from Bas-Rhin county P= 0.0165.
Table 2. Unadjusted means of the omega-3 index by various qualitative factors (n= 503) N (%) Mean (SEM) P Gender 0.0532 Men 251 (49.9) 5.87 (0.11) Women 252 (50.1) 6.17 (0.11) Centre o10− 4 Lille 174 (34.6) 5.99 (0.13) Strasbourg 168 (33.4) 5.63 (0.13) Toulouse 161 (32.0) 6.46 (0.14)
Educational level o10− 4
Low 83 (16.5) 5.77 (0.19)
Moderate 229 (45.5) 5.71 (0.11)
High 191 (38.0) 6.49 (0.12)
Income tax level o10− 4
o € 800/year 201 (41.1) 5.70 (0.12)
€ 800–2300/year 143 (29.2) 5.87 (0.14)
4 € 2300/year 145 (29.7) 6.61 (0.14)
Smoking status 0.0002
Never or former smokers 390 (77.5) 6.17 (0.09)
Current smokers 113 (22.5) 5.49 (0.16)
Alcohol consumption 0.0490
Abstainers 139 (27.6) 6.18 (0.15)
Low alcohol consumers 294 (58.5) 6.05 (0.10) High alcohol consumers 70 (13.9) 5.56 (0.21)
Diabetes 0.99 No 475 (94.4) 6.02 (0.08) Yes 28 (5.6) 6.02 (0.33) Use of statin 0.22 No 445 (88.5) 5.98 (0.08) Yes 58 (11.5) 6.29 (0.23)
Frequency of seafood consumption o10− 4
⩽ 1/month 58 (11.5) 4.81 (0.21)
2/month 62 (12.3) 5.16 (0.20)
1/week 189 (37.6) 5.73 (0.11)
⩾ 2–3/week 194 (38.6) 6.94 (0.11)
Outside work PA level 0.0212
No or low intensity PA 344 (68.4) 5.90 (0.09) High intensity PA⩾ 1/week 159 (31.6) 6.28 (0.14) 438
The mean value of 6% is greater than the values of 4.3–5.5% usually reported in the United States,10–13 lower than the mean value of 7.1% reported in a Spanish population8and even lower than the values of 8.5–9.0% observed in a Japanese population9 and Alaskan Eskimos.30 These differences probably reflect the great country-to-country variation in seafood consumption and well-known disparities in CHD morbidity and mortality.
In line with the literature data, our results showed that age was an independent predictor of the omega-3 index even after adjusting for seafood intake.9,10,13,14 There are several possible explanations for thisfinding, including (i) a slow-down in n-3 fatty acid turn-over with age, (ii) lower intakes of linoleic acid or higher intakes ofα-linolenic acid by older subjects or even (iii) survivor bias.31 Indeed, the older subjects in our sample tended to consume more α-linolenic acid and less linoleic acid (Supplementary Table 5). However, adjusting for these parameters failed to mask the positive effect of age.
The omega-3 index was higher in women than in men but the statistical significance was weak and disappeared in multivariate
models. This finding has been noted in some previous
studies8,10,13,14,32but not in others.9,12Some researchers consider that this reflects higher consumption of seafood by women than by men; however, this was not the case in the present study. Furthermore, studies in humans have suggested that sex hormones influence the enzymatic synthesis of long-chain PUFAs and lead to gender-specific differences in long-chain PUFA status.33These gender differences notably concern the ability to synthesise EPA and DHA from α-linolenic acid.34 In rats, the concentrations of long-chain n-3 PUFAs in plasma and tissues were found to be positively associated with circulating concentra-tions of oestradiol and progesterone and negatively associated with circulating concentrations of testosterone.34
Few studies have looked at whether alcohol consumption is significantly correlated with the omega-3 index. As previously reported,12,13 we did not find that alcohol consumption was a significant, independent predictor of the omega-3 index; this contrasts with a report of a positive association by di Giuseppe et al.35 In the latter study, the positive association was mainly driven by wine drinking (and not by beer or spirits), and was only observed in women. Furthermore, we did not find any gender differences in the influence of alcohol consumption. Future research must clarify whether alcohol consumption is associated with the omega-3 index and, if so, what kind of alcoholic beverages are responsible for the association.
Table 3. Quantitative factors associated with the omega-3 index in univariate analyses (n= 503)
Coefficient SE P Age (years) 0.051 0.009 o10− 4 Body mass index (kg/m2) − 0.018 0.015 0.25 Waist circumference (cm) − 0.007 0.006 0.24 Heart rate (beat/min) − 0.022 0.008 0.0040 Systolic blood pressure (mm Hg) − 0.002 0.004 0.60 Diastolic blood pressure (mm Hg) − 0.009 0.007 0.21 Years of fulltime education 0.062 0.020 0.0025 Energy-adjusted intake ofα-linolenic acid (mg/day) 0.180 0.096 0.06 Energy-adjusted intake of omega-6 (mg/day) − 0.031 0.019 0.12 Triglyceride (mmol/l)a
− 0.057 0.155 0.72 Low-density lipoprotein cholesterol (mmol/l) 0.111 0.087 0.21
a
log transformed.
Table 4. Best parsimonious multivariable model for the prediction of the omega-3 index
Estimate 95% CI P
Age (years) 0.053 [0.037; 0.069] o10− 4
Waist circumference (cm) − 0.014 [ − 0.023; − 0.004] 0.0039 Centrea 0.0016 Strasbourg 0 Toulouse 0.542 [0.215; 0.868] Lille 0.474 [0.160; 0.789] Educational level 0.0011 Low 0 Moderate 0.119 [− 0.261; 0.500] High 0.624 [0.211; 1.037] Smoking status 0.0113
Never or former smokers 0
Current smokers − 0.406 [ − 0.718; − 0.093] Frequency of seafood
consumption (nb/month) o10
-4
⩽ 1/month 0
2/month 0.331 [− 0.193; 0.853]
1/week 0.796 [0.363; 1.229]
⩾ 2–3/week 1.854 [1.411; 2.297]
aCentre was forced into the model. Other candidate variables were: gender,
alcohol consumption, physical activity level, statin use, diastolic blood pressure, low-density lipoprotein cholesterol, heart rate, energy-adjusted intake of omega-6 and energy-adjusted intake ofα-linolenic acid. This model explains 32% of the variability in the omega-3 index.
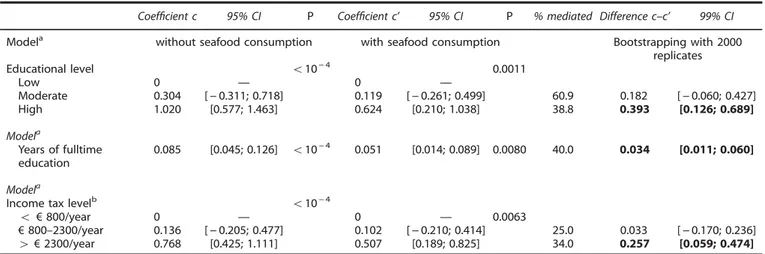
Table 5. Mediating effect of seafood consumption on the associations between SES and omega-3 index
Coefficient c 95% CI P Coefficient c’ 95% CI P % mediated Difference c–c’ 99% CI
Modela without seafood consumption with seafood consumption Bootstrapping with 2000
replicates
Educational level o10− 4 0.0011
Low 0 — 0 — Moderate 0.304 [− 0.311; 0.718] 0.119 [− 0.261; 0.499] 60.9 0.182 [− 0.060; 0.427] High 1.020 [0.577; 1.463] 0.624 [0.210; 1.038] 38.8 0.393 [0.126; 0.689] Modela Years of fulltime education 0.085 [0.045; 0.126] o10− 4 0.051 [0.014; 0.089] 0.0080 40.0 0.034 [0.011; 0.060] Modela
Income tax levelb o10− 4
o € 800/year 0 — 0 — 0.0063
€ 800–2300/year 0.136 [− 0.205; 0.477] 0.102 [− 0.210; 0.414] 25.0 0.033 [− 0.170; 0.236]
4 € 2300/year 0.768 [0.425; 1.111] 0.507 [0.189; 0.825] 34.0 0.257 [0.059; 0.474]
% mediated= [1 (c’/c)] × 100 where c is the coefficient without adjustment for seafood consumption and c’ the coefficient with seafood consumption in the model.aAlso adjusted for age, centre, smoking status and waist circumference.bData obtained in 489 subjects. Bold values were used to highlight statistical significance of the difference c–c’.
WC was inversely associated with the omega-3 index, even after accounting for other possible determinants. Associations have been inconsistently reported in the literature and have ranged from the absence of a univariate association for WC or body mass index8,9,14,32 to an independent, negative association.10,12 It has been suggested that high levels of oxidative stress in obese subjects are associated with low RBC levels of EPA and DHA.36 However, animal studies have shown that impaired hepatic metabolism of long-chain n-3 PUFAs may also be a factor, because obesity and diabetes both alter the expression and activity of the key enzymes involved in the synthesis of EPA and DHA fromα-linolenic acid.37
A low omega-3 index in smokers has been reported by some studies12–14 but not others.9,10 Given that cigarette smoking is known to induce oxidative stress, greater oxidation of long-chain PUFAs may explain this low value in current smokers. In a study of schizophrenic patients,38low levels of EPA and DHA observed in smokers have been related to differences in dietary intake of n-3 fatty acids. However, this cannot be the main reason in our study because seafood intake was taken into account. Lastly, one can conjecture that a low omega-3 index in smokers might be related to increased consumption of long-chain n-3 PUFAs in the synthesis of anti-inflammatory mediators.39
We found a positive association with SES when assessed as either educational or income tax level. Surprisingly, only half the previous studies of determinants of the omega-3 index have examined SES as a candidate factor.11–14Two studies reported a positive, independent association between SES and the omega-3 index.11,12In fact, it is well known that people with low SES tend to eat less seafood, partly because they are less aware of the health benefits of seafood intake and partly because seafood is usually more expensive.
In a study of patients with CHD, Cohen et al.11observed lower levels of RBC n-3 fatty acids in individuals with lower SES (as assessed by three different indices). The lack of nutritional data prevented Cohen et al., from investigating the role of fish consumption in these associations. Our study demonstrates that the differences in RBC EPA and DHA levels in a population of subjects with a wide range of educational levels were partly explained by differences in seafood consumption. This finding emphasises the need to provide people with low SES with foods rich in n-3 PUFAs at an appropriate cost. Conversely, it shows that factors other than seafood consumption—or age, WC, geographi-cal area—affect the omega-3 index’s relationship with SES. These factors may influence the hepatic metabolism of long-chain PUFAs and the activity of the elongases and desaturases involved in the synthesis of long-chain n-3 PUFAs. Several factors, such as an unbalanced diet and low physical activity, may interact and lead to metabolic alterations related to obesity or diabetes.37
The present study’s strengths include its population-based setting, the multicentre design (with three distant geographical areas in France), the relatively large sample size and the assessment of a long-term biomarker of n-3 fatty acid intake that is known to have a relatively low intra-individual variability.4
The study also has some limitations. Firstly, this was an observational study; even though we took account of many potential confounding factors, we cannot rule out the possibility of residual confounding. For example, genetic factors have been shown to account for a large proportion of the variability in the omega-3 index.12 Secondly, the study’s cross-sectional design prevents causal inferences from being made. However, it is legitimate to consider that a higher educational level can enhance seafood intake, and thus the intake of EPA and DHA, rather than the opposite. Thirdly, data on supplementation were not available in all three areas. Nevertheless, very few people in France consume dietary supplements (at least relative to the United States). For example, 11% of the 35–54-year-old subjects in the nationally representative French INCA2 dietary survey
(2006-2007)40 reported consuming some type of supplement. This is far lower than the values of 50%, for regular supplement intake, and 66%, for at least occasional supplement intake, recorded in the United States from 2007 to 2011.41In the MONA LISA-NUT study, fewer than 2% of the participants living in eastern France reported consuming some fatty acid supplements; we consider that this low proportion is unlikely to seriously bias our results.
In conclusion, we found that seafood consumption, age, SES, WC and smoking were independently associated with the omega-3 index in a middle-aged French population. We also found that seafood consumption mediated a large part of the association between SES and the omega-3 index, which could help target health prevention funds to subjects with a high risk of cardiovascular death. Other factors, such as the intake of various fatty acids, may also be involved in this mediation and so further analyses of this association are required.
CONFLICT OF INTEREST
The authors declare no conflict of interest.
ACKNOWLEDGEMENTS
We would like to thank the nurses, physicians, dieticians, computer scientists and secretaries and the Centre de Médecine Préventive de Lille, the Laboratoire d’Analyses Génomiques and the Service de Biologie Spécialisée de l’Institut Pasteur de Lille, the Centre de Santé de la MGEN de Strasbourg, the Unité de Coordination de la Biologie des Essais Cliniques des Hôpitaux Universitaires de Strasbourg, the Departments of Cardiology of the Toulouse University Hospital and the Human Nutrition Unit of Clermont-Ferrand, whose technicians from the CHLEO team have carried out the GC analyses. The MONA LISA Study was made possible by an unrestricted grant of Pfizer and by a grant from ANR (ANR-05-PNRA-018). Pfizer and ANR had no role in the design, analysis or writing of this article.
AUTHOR CONTRIBUTIONS
AW, CS, JD, JBR, DC, JF and DA designed the study or were involved in the study management; BM and BL were involved in the assessment of the fatty acid composition in red blood cell membranes; AW drafted the manuscript and performed the analyses. All authors contributed to the interpretation of the data and critically reviewed the manuscript.
REFERENCES
1 Raatz SK, Silverstein JT, Jahns L, Picklo MJ. Issues offish consumption for cardi-ovascular disease risk reduction. Nutrients 2013;5: 1081–1097.
2 Albert CM, Campos H, Stampfer MJ, Ridker PM, Manson JE, Willett WC et al. Blood levels of long-chain n-3 fatty acids and the risk of sudden death. N Engl J Med 2002;346: 1113–1118.
3 Sun Q, Ma J, Campos H, Hankinson SE, Hu FB. Comparison between plasma and erythrocyte fatty acid content as biomarkers of fatty acid intake in US women. Am J Clin Nutr 2007;86: 74–81.
4 Harris WS, Thomas RM. Biological variability of blood omega-3 biomarkers. Clin Biochem 2010;43: 338–340.
5 Harris WS, Sands SA, Windsor SL, Ali HA, Stevens TL, Magalski A et al. Omega-3 fatty acid levels in transplanted human hearts: effect of supplementation and comparison with erythrocytes. Circulation 2004;110: 1645–1649.
6 Harris WS, von Schacky C. The omega-3 index: a new risk factor for death from coronary heart disease? Prev Med 2004;39: 212–220.
7 Von Schacky C. Omega-3 index and cardiovascular health. Nutrients 2014;6: 799–814.
8 Sala-Vila A, Harris WS, Cofan M, Perez-Heras AM, Pinto X, Lamuela-Raventos RM et al. Determinants of the omega-3 index in a Mediterranean population at increased risk for CHD. Br J Nutr 2011;106: 425–431.
9 Itomura M, Fujioka S, Hamazaki K, Kobayashi K, Nagasawa T, Sawazaki S et al. Factors influencing EPA+DHA levels in red blood cells in Japan. In vivo 2008; 22: 131–136.
10 Sands SA, Reid KJ, Windsor SL, Harris WS. The impact of age, body mass index, andfish intake on the EPA and DHA content of human erythrocytes. Lipids 2005; 40: 343–347.
11 Cohen BE, Garg SK, Ali S, Harris WS, Whooley MA. Red blood cell docosahexaenoic acid and eicosapentaenoic acid concentrations are positively associated with socio-economic status in patients with established coronary artery disease: data from the Heart and Soul Study. J Nutr 2008;138: 1135–1140.
12 Harris WS, Pottala JV, Lacey SM, Vasan RS, Larson MG, Robins SJ. Clinical correlates and heritability of erythrocyte eicosapentaenoic and docosahexaenoic acid content in the Framingham Heart Study. Atherosclerosis 2012;225: 425–431. 13 Block RC, Harris WS, Pottala JV. Determinants of blood cell omega-3 fatty acid
content. Open Biomark J 2008;1: 1–6.
14 Salisbury AC, Amin AP, Harris WS, Chan PS, Gosch KL, Rich MW et al. Predictors of omega-3 index in patients with acute myocardial infarction. Mayo Clin Proc 2011; 86: 626–632.
15 Kuulasmaa K, Tunstall-Pedoe H, Dobson A, Fortmann S, Sans S, Tolonen H et al. Estimation of contribution of changes in classic risk factors to trends in coronary-event rates across the WHO MONICA Project populations. Lancet 2000;355: 675–687.
16 Cottel D, Dallongeville J, Wagner A, Ruidavets JB, Arveiler D, Ferrières J et al. The North-East-South gradient of coronary heart disease mortality and case fatality rates in France is consistent with a similar gradient in risk factor clusters. Eur J Epidemiol 2000;16: 317–322.
17 Wagner A, Sadoun A, Dallongeville J, Ferrières J, Amouyel P, Ruidavets JB et al. High blood pressure and control in a middle-aged French population and their associated factors: the MONA LISA study. J Hypertens 2011;29: 43–50. 18 Pigeyre M, Dauchet L, Simon C, Bongard V, Bingham A, Arveiler D et al. Effects of
occupational and educational changes on obesity trends in France: the results of the MONICA-France survey 1986-2006. Prev Med 2011;52: 305–309.
19 WHO MONICA Project MONICA Manual (1998-1999). Part III: population survey. Section I: population survey data component (December 1997). Available from http://www.thl.fi/publications/monica/manual/part3/iii-1.htm.
20 International Center for Alcohol Policies (December 2003). Reports 14. Interna-tional drinking guidelines. http://www.icap.org/Publications/ICAPReports. 21 Knuiman J, Pietinen P, De Backer G, Ducimetière E. The MONICA-Project: Optional
Study on the Surveillance of Dietary Intake of the Population With Regard to Cardiovascular Diseases Manual of Operations. EURONUT Report 6. The Netherlands: EURONUT, 1985.
22 SU.VI.MAX-Candia/polytechnica. Portions alimentaires: manuel-photos pour l ’esti-mation des quantités. Candia: Economica, 2002.
23 Giovannelli J, Dallongeville J, Wagner A, Bongard V, Laillet B, Marecaux N et al. Validation of a short, qualitative food frequency questionnaire in French adults participating in the MONA LISA-NUT study 2005-2007. J Acad Nutr Diet 2014;114: 552–561.
24 Folch J, Lees M, Sloane Stanley GH. A simple method for the isolation and purification of total lipides from animal tissues. J Biol Chem 1957; 26: 497–509.
25 Tardy AL, Lambert-Porcheron S, Malpuech-Brugère C, Giraudet C, Rigaudière JP, Laillet B et al. Dairy and industrial sources of trans fat do not impair peripheral insulin sensitivity in overweight women. Am J Clin Nutr 2009;90: 88–94.
26 Willett WC, Howe GR, Kushi LH. Adjustment for total energy intake in epidemiologic studies. Am J Clin Nutr 1997;65: 1220S–1228S.
27 Baron RM, Kenny DA. The moderator-mediator variable distinction in social psychological research: conceptual, strategic, and statistical considerations. J Pers Soc Psychol 1986;51: 1173–1182.
28 Krause MR, Serlin RC, Ward SE, Rony RY, Ezenwa MO, Naab F. Testing mediation in nursing research: beyond Baron and Kenny. Nurs Res 2010;59: 288–294. 29 Efron B. Bootstrap methods: another look at the Jackknife. Ann Stat 1979;7:
1–26.
30 Ebbesson SO, Devereux RB, Cole S, Ebbesson LO, Fabsitz RR, Haack K et al. Heart rate is associated with red blood cell fatty acid concentrations: The Genetics of coronary artery disease in Alaska Natives (GOCADAN) study. Am Heart J 2010;159: 1020–1025.
31 de Groot RH, van Boxtel MP, Schiepers OJ, Hornstra G, Jolles J. Age dependence of plasma phospholipid fatty acid levels: potential role of linoleic acid in the age-associated increase in docosahexaenoic acid and eicosapentaenoic acid concentrations. Br J Nutr 2009;102: 1058–1064.
32 Ogura T, Takada H, Okuno M, Kitade H, Matsuura T, Kwon M et al. Fatty acid composition of plasma, erythrocytes and adipose: their correlates and effects of age and sex. Lipids 2010;45: 137–144.
33 Decsi T, Kennedy K. Sex-specific differences in essential fatty acid metabolism. Am J Clin Nutr 2011;94(6 Suppl): 1914S–1919S.
34 Childs CE, Romeu-Nadal M, Burdge GC, Calder PC. Gender differences in the n-3 fatty acid content of tissues. Proc Nutr Soc 2008;67: 19–27.
35 di Guiseppe R, de Lorgeril M, Salen P, Laporte F, Di Castelnuovo A, Krogh V. European collaborative group of the IMMIDIET Project. Alcohol consumption and n-3 polyunsaturated fatty acids in healthy men and women from 3 European populations. Am J Clin Nutr 2009;89: 354–362.
36 Cazzola R, Rondanelli M, Russo-Volpe S, Ferrari E, Cestaro B. Decreased membrane fluidity and altered susceptibility to peroxydation and lipid composition in overweight and obese female erythrocytes. J Lipid Res 2004;45: 1846–1851. 37 Wang Y, Botolin D, Xu J, Christian B, Mitchell E, Jayaprakasam B et al. Regulation of
hepatic fatty acid elongase and desaturase expression in diabetes and obesity. J Lipid Res 2006;47: 2028–2041.
38 Hibbeln JR, Makino KK, Martin CE, Dickerson F, Boronow J, Fenton WS. Smoking, gender, and dietary influences on erythrocytes essential fatty acid composition among patients with schizophrenia or schizoaffective disorder. Biol Psychiatry 2003;53: 431–441.
39 Hsiao HM, Sapinoro RE, Thatcher TH, Croasdell A, Levy EP, Fulton RA et al. A novel anti-inflammatory and pro-resolving role for resolving D1 in acute cigarette smoke-induced lung inflammation. PLoS One 2013; 8: e58258.
40 AFSSA (2009) Rapport de l’étude Individuelle Nationale des Consommations Alimentaires 2 (INCA2) 2006-2007. http://www.afssa.fr/Documents/PASER-Ra-INCA2.pdf.
41 Dickinson A, Blatman J, El-Dash N, Franco JC. Consumer usage and reasons for using dietary supplements: report of a series of surveys. J Am Coll Nutr 2014;33: 176–182.
Supplementary Information accompanies this paper on European Journal of Clinical Nutrition website (http://www.nature.com/ejcn)