interactions in treatment-resistant cancer cells
The MIT Faculty has made this article openly available.
Please share
how this access benefits you. Your story matters.
Citation
Debruyne, David N. et al. "BORIS promotes chromatin regulatory
interactions in treatment-resistant cancer cells." Nature 572, 7771
(August 2019): 676–680 © 2019 The Author(s)
As Published
http://dx.doi.org/10.1038/s41586-019-1472-0
Publisher
Springer Science and Business Media LLC
Version
Author's final manuscript
Citable link
https://hdl.handle.net/1721.1/126505
Terms of Use
Article is made available in accordance with the publisher's
policy and may be subject to US copyright law. Please refer to the
publisher's site for terms of use.
Letter
https://doi.org/10.1038/s41586-019-1472-0BORIS promotes chromatin regulatory interactions
in treatment-resistant cancer cells
David N. Debruyne1,2,15, ruben Dries1,2,3,15, Satyaki Sengupta1,2, Davide Seruggia1,4,5,6, Yang Gao1,2, Bandana Sharma1,2,
Hao Huang1,2, Lisa Moreau7, Michael McLane1,2, Daniel S. Day8,9, eugenio Marco3,10, ting Chen11, Nathanael S. Gray12,13,
Kwok-Kin Wong14, Stuart H. Orkin1,4,5,6, Guo-Cheng Yuan3,10, richard A. Young8,9 & rani e. George1,2,4*
The CCCTC-binding factor (CTCF), which anchors DNA loops that organize the genome into structural domains, has a central role in gene control by facilitating or constraining interactions between genes and their regulatory elements1,2. In cancer cells, the disruption of CTCF binding at specific loci by somatic mutation3,4 or DNA hypermethylation5 results in the loss of loop anchors and consequent activation of oncogenes. By contrast, the germ-cell-specific paralogue of CTCF, BORIS (brother of the regulator of imprinted sites, also known as CTCFL)6, is overexpressed in several cancers7–9, but its contributions to the malignant phenotype remain unclear. Here we show that aberrant upregulation of BORIS promotes chromatin interactions in ALK-mutated, MYCN-amplified
neuroblastoma10 cells that develop resistance to ALK inhibition. These cells are reprogrammed to a distinct phenotypic state during the acquisition of resistance, a process defined by the initial loss of MYCN expression followed by subsequent overexpression of BORIS and a concomitant switch in cellular dependence from MYCN to BORIS. The resultant BORIS-regulated alterations in chromatin looping lead to the formation of super-enhancers that drive the ectopic expression of a subset of proneural transcription factors that ultimately define the resistance phenotype. These results identify a previously unrecognized role of BORIS—to promote regulatory chromatin interactions that support specific cancer phenotypes.
1Department of Pediatric Oncology, Dana-Farber Cancer Institute, Boston, MA, USA. 2Department of Pediatrics, Harvard Medical School, Boston, MA, USA. 3Department of Biostatistics and Computational Biology, Dana-Farber Cancer Institute, Boston, MA, USA. 4Division of Hematology/Oncology, Boston Children’s Hospital, Boston, MA, USA. 5Harvard Stem Cell Institute, Harvard Medical School, Boston, MA, USA. 6Howard Hughes Medical Institute, Boston, MA, USA. 7Department of Radiation Oncology, Dana-Farber Cancer Institute, Boston, MA, USA. 8Whitehead Institute for Biomedical Research, Cambridge, MA, USA. 9MIT Department of Biology, Cambridge, MA, USA. 10Department of Biostatistics, Harvard TC Chan School of Public Health, Boston, MA, USA. 11Department of Medical Oncology, Dana-Farber Cancer Institute, Boston, MA, USA. 12Department of Cancer Biology, Dana-Farber Cancer Institute, Boston, MA, USA. 13Department of Biological Chemistry and Molecular Pharmacology, Harvard Medical School, Boston, MA, USA. 14Division of Hematology and Medical Oncology, Laura and Isaac Perlmutter Cancer Center, New York University Langone Medical Center, New York, NY, USA. 15These authors contributed equally: David N. Debruyne, Ruben Dries.. *e-mail: rani_george@dfci.harvard.edu
a b c d f g e 0 0 0.02 0.01 –0.01 –0.02 PC1 PC2 0 2.5 5.0 7.5 10.0 Rescaled expression BORIS SOX9 SOX2 MYCN Pseudotime Sens 1 Sens 2
IR 1 IR 2 IR 3Res 1Res 2Res 3Res 4
BORIS MYCN Actin
MYCNKD/BORISInd
Sensiti ve DMS O TAE DOX + DMS O DOX + TAE Sensitive Resistant Resistant + shBORIS Resistant + shCtrl PC1 PC2 –50 –25 0 25 50 –30 0 30 40 nM (IC50) 0 (months) 12 Sensitive –20+2 z-score Resistant PKIB NEUROD4 PLP1 CER1 PTX3 INHBE MYL1 SIX1 RPRM BORIS KCTD8 CEBPD ARHGAP36 DACT1 RBM24 NEUROD1 NEUROG1 INSM1 KLHL1 SNAI2 chr1 RPM per bp 4k 2k 0 chr2chr3chr4chr5chr6chr7chr8chr9chr10chr11chr12chr13chr1 4 chr1 5 chr1 6 chr1 7 chr1 8 chr1 9 chr2 0 chr2 1 chr2 2 chrXchrY 10–3 10–2 10–1 100 101 0 0.2 0.4 0.6 0.8 1.0 1.2 1.4 log([TAE684] (μM)) Relative viability Sensitive (39 nM) Resistant (1,210 nM) 10–3 10–2 10–1 100 101 0 0.2 0.4 0.6 0.8 1.0 1.2 log([TAE684] (μM)) Relative viability TAE (24.4 nM) DOX + DMSO (74.1 nM) DOX + TAE (525.8 nM) DMSO (35.3 nM) Resistant Resistant IR Sensitive Sensitive [TAE684] –0.01 0.01 1,200 nM
Sensitive Resistant Fig. 1 | Targeted therapy resistance in neuroblastoma is associated with
transcriptional reprogramming and a switch in dependency from amplified MYCN to BORIS. a, Top, schematic representation of the
development of resistance. Bottom, dose–response curves of TAE684-sensitive and -resistant Kelly neuroblastoma cells incubated in increasing concentrations of TAE684 for 72 h. Data are mean ± s.d., n = 3 biological replicates. b, Heat map of gene expression values in sensitive versus resistant cells (n = 2 biological replicates). Rows are z-scores calculated for each gene in both cell types. c, PCA of scRNA-seq data of sensitive (n = 5,432), intermediate resistant (IR; n = 6,376) and resistant (n = 6,379) cells showing the first two principal components (PCs). d, Pseudotime analysis of transcription factor expression during the development of resistance. e, ChIP–seq signals of genome-wide MYCN binding in sensitive and resistant cells, reported as reads per million (RPM) per base pair (bp) for each chromosome (chr). f, PCA of gene expression profiles showing the first two principal components (n = 2 biological replicates). g, Dose–response curves for TAE684 (half-maximum inhibitory concentration (IC50) values in parenthesis) and immunoblot
analysis (representative of two independent experiments) of BORIS and MYCN expression in sensitive cells expressing short hairpin RNA (shRNA) against MYCN (MYCNKD) and
doxycycline-inducible BORIS (BORISInd), treated
with dimethylsulfoxide (DMSO) or 1 µM TAE684, with or without doxycycline (DOX). Data are mean ± s.d., n = 3 biological replicates.
Unlike CTCF, which is uniformly expressed in healthy tissues and cancer cells, the expression of BORIS is typically restricted to the testis6
and embryonic stem cells11 (Extended Data Fig. 1a). However, when
aberrantly expressed in cancer7–9, it is associated with high-risk features
that include resistance to treatment (Extended Data Fig. 1b, c). We identified BORIS as one of the most differentially expressed genes in neuroblastoma cells driven by amplified MYCN12 and ALK(F1174L)13
and rendered resistant to ALK inhibition. Kelly human neuroblastoma cells were exposed to increasing concentrations of the ALK inhibitor TAE68414 until stable resistance was achieved (Fig. 1a, Extended Data
Fig. 2a–d). The acquisition of stable resistance coincided not only with the loss of ALK phosphorylation—which indicates that the cells no longer required activation of this receptor tyrosine kinase to maintain their oncogenic properties—but also with the absence of other common instigators of resistance (Extended Data Fig. 2a, e–h; Supplementary Note 1). However, comparison of the gene expression profiles of the TAE684-sensitive and resistant cells showed generalized downregula-tion of transcripdownregula-tion in the resistant cells, but with marked upreguladownregula-tion of a subset of transcription factors not typically associated with neuro-blastoma cells15,16 (Fig. 1b).
We therefore proposed that the resistant cells had probably under-gone transcriptional reprogramming during the development of resistance. To determine the dynamics of resistance development, we performed single-cell RNA sequencing (scRNA-seq) analysis on sensi-tive, intermediate and fully resistant cell states (Extended Data Fig. 3a). Principal component analysis (PCA) indicated a stepwise transition as cells progressed from the sensitive to the fully resistant state (Fig. 1c). This transition was confirmed by distributed stochastic neighbour embedding (t-SNE)17, which clustered the cells into three non-
overlapping categories (Extended Data Fig. 3b, c). Pseudotime analysis based on the transcription factors that were differentially expressed throughout the development of resistance revealed that the initial major alteration was loss of MYCN expression, which persisted in stably resist-ant cells (Fig. 1d, Extended Data Fig. 3d, e). To understand this unex-pected result, we analysed the status of MYCN in these cells, and found that although genomic amplification was retained, the MYCN locus was epigenetically repressed (Extended Data Fig. 3f, g). This state was accompanied by a genome-wide reduction of MYCN binding to DNA and a consequent revision of associated downstream transcription out-comes15,18,19 (Fig. 1e, Extended Data Fig. 3h). Coincident with this loss
of transcriptional activity, the resistant cells were no longer dependent on MYCN for survival, unlike their sensitive controls, which underwent apoptosis after depletion of MYCN (Extended Data Fig. 3i). Subsequent resistance stages were defined by a gradual increase in the expression of the neural developmental markers SOX2 and SOX920, followed by
upregulation of BORIS, ultimately leading to a fully resistant state in which BORIS expression was highest and detectable in essentially all cells (Fig. 1d, Extended Data Fig. 3j, k). Overexpression of BORIS, which coincided with promoter hypomethylation (Extended Data Fig. 4a, b), was also observed in additional neuroblastoma cell lines rendered resistant to TAE684 (SK-N-SH) or the CDK12 inhibitor E921
(SK-N-BE(2)) (Extended Data Fig. 4c, d), which suggests that our find-ings are not restricted to a single cell line or kinase inhibitor. Indeed, overexpression of BORIS in tumours was significantly associated with high-risk disease and a poor outcome in patients with neuroblastoma treated with a variety of regimens (Extended Data Fig. 4e–g).
To clarify the role of BORIS in the resistance phenotype, we depleted its expression in resistant cells, and observed a partial reversal to the sensitive-cell state with re-emergence of MYCN and ALK expression (Fig. 1f, Extended Data Fig. 5a–c). However, this outcome was insuf-ficient to maintain cell growth, as depletion of BORIS in resistant cells ultimately decreased cell viability (Extended Data Fig. 5d, e), which indicates a switch from MYCN to BORIS dependency with stable resist-ance. This transition was associated with changes in cellular growth kinetics—from a highly proliferative, MYCN-overexpressing sensitive state to an intermediate, slow-cycling phenotype that was partially reversed in fully resistant cells, coincident with overexpression of
BORIS (Extended Data Fig. 5f–h). Given the many sequential steps involved in the evolution of resistance, overexpression of BORIS alone was not adequate to induce this phenotype (data not shown). Instead, concomitant downregulation of MYCN expression and BORIS overex-pression in the presence of ALK inhibition were required to generate resistance in sensitive cells (Fig. 1g). This combination of factors also led to increased expression of the transcription factors that were upreg-ulated in the original TAE684-resistant cells, including SOX2 and SOX9 (Extended Data Figs. 3d, 5i). Thus, resistance to inhibition of ALK in neuroblastoma cells evolves through a multistep process that promotes a dependency switch from a dominant oncogenic stimulus—amplified MYCN—to a phenotypically distinct state characterized by overexpres-sion of BORIS. In this context, the resistant cells ultimately become dependent on BORIS for survival, which supports a key role for this protein in maintenance of the resistance state.
We next asked whether the aberrant expression of BORIS, a DNA-binding protein6, affected its genome-wide occupancy in resistant
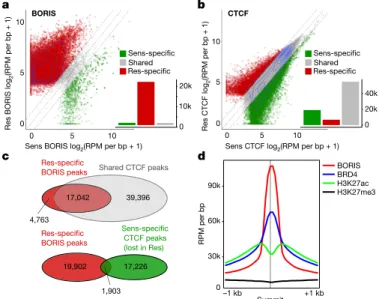
cells. We observed a large (tenfold) gain in BORIS-bound peaks after chromatin immunoprecipitation followed by high-throughput sequencing (ChIP–seq) analysis in resistant cells: 22,891 versus 2,211 in sensitive cells (Fig. 2a, Extended Data Fig. 6a, b). By contrast, CTCF binding did not change substantially between sensitive and resistant cells (75,567 versus 63,246 peaks) (Fig. 2b). A considerable portion (n = 17,042; 78%) of the BORIS peaks unique to resistant cells over-lapped with CTCF peaks shared by both cell types (Fig. 2c), consistent with their heterodimerization22 (Extended Data Fig. 6c). However,
only a small proportion (n = 1,903; 8.7%) overlapped with CTCF peaks unique to sensitive cells, which suggests that BORIS does not replace CTCF in resistant cells. BORIS preferentially occupied gene regulatory regions—enhancers and promoters (60%)—in resistant cells (Extended Data Fig. 6d, e), which is consistent with its propensity to bind to open chromatin regions23 (Fig. 2d). Such differential chromatin
a b c d BORIS BRD4 H3K27ac H3K27me3 90k 60k 30k 0 –1 kb RPM per bp 17,042 4,763 Shared CTCF peaks Res-specific BORIS peaks 1,903 Sens-specific CTCF peaks (lost in Res) Res-specific BORIS peaks 19,902
Sens BORIS log2(RPM per bp + 1)
Res BORIS lo g2 (RPM per bp + 1) 0 5 10 0 5 10 BORIS 10k 20k Sens-specific Res-specificShared 0
Sens CTCF log2(RPM per bp + 1)
0 0 5 10 5 10 Res CTCF lo g2 (RPM per bp + 1) CTCF 20k 40k Sens-specific Res-specific Shared 0 17,226 39,396 +1 kb Summit
Fig. 2 | BORIS overexpression is associated with its increased chromatin occupancy in resistant cells, whereas CTCF binding is unchanged. a, Scatter plot of BORIS binding in sensitive (Sens) and resistant (Res)
cells for all detected BORIS-binding sites. BORIS peaks unique to resistant cells (n = 21,805; 91%), sensitive cells (n = 1,125; 4.7%) and shared between the two cell types (n = 1,086; 4.5%) are shown. b, Scatter plot of CTCF binding in sensitive and resistant cells for all detected CTCF-binding sites. CTCF peaks unique to resistant cells (n = 6,808; 8.3%), sensitive cells (n = 19,129; 23.2%) and shared between the two cell types (n = 56,438; 68.5%) are shown. c, Overlap between BORIS peaks that are unique to resistant cells and CTCF peaks shared between resistant and sensitive cells (top), and between resistant cell-specific BORIS peaks and sensitive cell-specific CTCF peaks (bottom). d, Meta-analysis of average ChIP–seq signals at resistant cell-specific BORIS-binding sites. All panels, n = 2 biological replicates.
binding at distinct highly expressed genes in resistant versus sensitive cells was commensurate with the MYCN-to-BORIS dependency switch (Extended Data Fig. 6f, g).
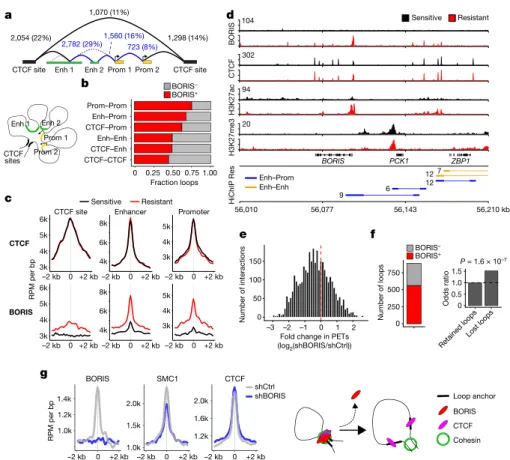
The proclivity of aberrantly expressed BORIS for genomic regions associated with active chromatin features in resistant cells suggested that it may, like CTCF and cohesin, regulate gene expression through chromatin looping. Thus, we examined the chromatin looping pro-files of sensitive and resistant cells, using cohesin (SMC1A)-based high-throughput chromosome conformation capture followed by chromatin immunoprecipitation (HiChIP)24 (Extended Data Fig. 7a).
On the basis of the genomic locations of the associated loop anchors, six classes of interactions were identified25: three longer average
inter-action loops with a CTCF site on at least one anchor; and three smaller connecting regulatory regions (Fig. 3a, Extended Data Fig. 7b). The overlap of BORIS binding with loop anchors revealed that most (56%) of the 9,487 interactions gained in resistant cells were positive for BORIS (log2-transformed fold change > 1; false discovery rate (FDR)
< 0.01) (Fig. 3b, Extended Data Fig. 7c). Notably, BORIS was enriched at anchors that were associated with regulatory regions, whereas CTCF binding remained constant, as seen at the BORIS locus itself (Fig. 3c, d). In fact, BORIS binding alone at CTCF-negative loop anchors was sufficient to generate new interactions in resistant cells (Extended Data Fig. 7d).
To test whether the newly formed interactions in resistant cells were mediated by BORIS binding, we analysed the consequences of BORIS depletion on loop architecture (Extended Data Fig. 7e). Regulatory interactions specific to resistant cells displayed a global shift towards loss after knockdown of BORIS (Fig. 3e), with more than one-quarter of the total interactions lost, of which 63% were positive for BORIS at their anchors (Fig. 3f). Interactions in which anchors were bound by BORIS (especially enhancer–promoter and promoter–promoter inter-actions) were more likely to be lost after BORIS depletion than those that were not BORIS-bound (Fig. 3f, Extended Data Fig. 7f, g). These results agree with the loop extrusion model26, as BORIS loss resulted in
decreased SMC1A binding, preferentially at lost interactions, whereas CTCF binding did not change significantly (Fig. 3g, Extended Data Fig. 7h–j). These data confirm that BORIS is a crucial factor in the looping landscape of resistant cells.
Genes associated with new BORIS-positive regulatory interactions were expressed at higher levels than those associated with BORIS-negative regulatory interactions or genes not associated with new regulatory interactions (Fig. 4a). Because genes that define cell iden-tity are often regulated by super-enhancers in both healthy and can-cer cells15,27,28, we characterized the super-enhancer landscape of our
cells, observing that the super-enhancers unique to resistant cells were enriched at BORIS-positive regulatory loops (Extended Data Fig. 8a–c).
e f g d b c CTCF BORIS
CTCF site Enhancer Promoter
Resistant RPM per bp 6k 5k 4k 3k 6k 5k 4k 3k 8k 6k 4k 5k 4k 3k 8k 6k 4k 5k 4k 3k a CTCF BORIS H3K27me3 H3K27a c BORIS PCK1 ZBP1 Enh–Prom Enh–Enh Sensitive Resistant HiChI P Re s 104 302 94 20 56,010 56,143 9 6 12 12 7 BORIS– BORIS+ Fraction loops Prom–Prom Enh–Prom CTCF–Prom Enh–Enh CTCF–Enh CTCF–CTCF 0 1.00
Fold change in PETs
(log2(shBORIS/shCtrl)) 0 –2 –1 1 2 –3 150 100 50 0 Number of interactions P = 1.6 × 10⁻⁷ Odds rati o Retaine d loops Lost loop s 1.5 1.0 0.5 0 shBORIS shCtrl RPM per bp SMC1 BORIS CTCF 1.6k 1.2k 2.0k 2.0k 1.5k 1.0k 1.4k 1.2k 1.0k Loop anchor BORIS Cohesin CTCF
CTCF site Enh 2 Prom 1 Prom 2 CTCF site
723 (8%) 1,070 (11%) 2,054 (22%) 2,782 (29%)1,560 (16%) 1,298 (14%) Enh 1 0 250 500 750 Number of loop s BORIS– BORIS+ sites Prom 1 Prom 2 Enh 1 Enh 2 CTCF 56,077 56,210 kb –2 kb 0 +2 kb–2 kb 0 +2 kb –2 kb 0 +2 kb –2 kb 0 +2 kb–2 kb 0 +2 kb –2 kb 0 +2 kb –2 kb 0 +2 kb –2 kb 0 +2 kb –2 kb 0 +2 kb 0.75 0.50 0.25 Sensitive
Fig. 3 | BORIS promotes new chromatin interactions in resistant cells. a, DNA interactions gained in resistant cells based on SMC1A
HiChIP analysis. Interaction classes were determined from the genomic locations of the associated anchors (overlapping promoter (Prom) regions (transcription start site (TSS) ± 2 kb), active enhancer (Enh) regions, or CTCF sites only, in that order). Absolute numbers and percentages for each loop type (structural (black), regulatory (blue)) are shown. Cartoon illustrates the spatial proximity induced by DNA looping between these regions. b, Fractions of loops bound by BORIS within each interaction class. c, Meta-analysis of average CTCF and BORIS ChIP–seq signals in sensitive and resistant cells at the three main anchor types normalized by the number of interactions (n = 2 biological replicates). Anchor sites were centred and extended in both directions (± 2 kb). d, ChIP–seq tracks of the indicated proteins in sensitive and resistant cells at the BORIS locus
(representative of two independent experiments), with resistant cell-specific regulatory interactions shown below (HiChIP resistant: paired-end tag (PET) numbers, next to each interaction). Signal intensity is given in the top left corner for each track. e, PET interactions in BORIS-depleted (shBORIS) versus control (shCtrl) cells. f, Resistant cell-specific loops lost after depletion of BORIS based on loops negative or positive for BORIS binding in shCtrl cells (left), and the odds ratio of losing a loop previously bound by BORIS (right). P value determined by two-sided Fisher’s exact test. g, Meta-analysis of average BORIS, SMC1A and CTCF ChIP–seq signals at resistant cell-specific loop anchors that were lost after depletion of BORIS (n = 2 biological replicates). BORIS depletion at loop anchors inhibits retention of the cohesin complex, and thus prevents the formation of new loops (loop extrusion model). In a, b, e and f, n = 3 biological replicates.
The presence of such super-enhancers correlated significantly with higher expression of their associated genes in resistant versus sensitive cells (Fig. 4a). These BORIS-positive super-enhancer-associated genes were also enriched for genes that underwent a chromatin state switch from a closed or neutral to an open configuration in resistant cells (Extended Data Fig. 8d, e). Depletion of BORIS resulted in the decreased expression of genes associated with BORIS-positive inter-actions, especially genes associated with resistant cell-specific super- enhancers (Fig. 4a, Extended Data Fig. 8f). These observations suggest that BORIS-mediated alterations in chromatin looping lead to interac-tions of newly formed super-enhancers with their target genes, which results in their increased expression.
We next sought to identify BORIS-regulated genes that are function-ally linked to the resistance phenotype by integrating gene expression, BORIS-mediated looping, super-enhancer landscape and chromatin state. This analysis revealed 89 genes (Supplementary Table), including
13 transcription factors, that are highly expressed during early neural development and are crucial to cell fate decisions20,29,30 (Fig. 4b, c,
Extended Data Fig. 8g). The expression of these proneural transcription factors paralleled that of BORIS in resistant cells, and was dependent on BORIS-mediated looping, as BORIS depletion led to their downreg-ulation (Extended Data Fig. 8h, i). Moreover, analysis of transcription factor binding sites revealed enrichment of BORIS and several of these proneural transcription factors at the regulatory regions of the high-est-expressed genes in resistant cells, whereas sensitive cells were domi-nated by MYC, MYCN and MAX E-box and E-box-like motifs (Fig. 4d). Similar increased expression of proneural transcription factors with increased BORIS occupancy at their promoters was seen in BORIS-overexpressing E9-resistant SK-N-BE(2) neuroblastoma cells compared with their sensitive counterparts (Extended Data Fig. 8j, k). The high transcriptional activity of these BORIS-regulated genes was also associated with increased binding of the transcriptional activator
d b a c 113,452 kb 113,232 kb ALPK1 NEUROG2 BRD4 BORIS CTCF SE Sensitive NEUROG2 ALPK1 Resistant Enhancer–promoter Enhancer–enhancer H3K27a c BORIS SIX1 NEUROD1 NEUROD4 SOX9 NEUROG2 NEUROG1 Unique reg loop SE Expressio n
Chromatinstate switch
(anchor/prom ) BORIS peak Open Closed to open Neutral to open Neutral to open Open Closed to open Closed to open / / / / / / /
SOX2 // Closed to open
NHLH1 / Open INSM1 SNAI2 ZFP36L1 ASCL2 Open / / Neutral to open / Closed to open Closed to neutral / 18 8 10 9 7 23 5 5 e SOX9 BORIS E-box MYCN MYC NEUROD1 SIX1 MAX E S Prom Sensi tive SE Sensitive promR esist ant SE Resistant prom 1 0 P value log 2 (CPM, resistant) 12 9
regulatory loopResistant Resistant vs Sensitive shBORIS vs shCtrl
6 3 Other P = 2.2 × 10⁻¹¹ Reg gen e
BORIS reg gene BORIS no SE
log 2 (CPM, resistant/sensitive) log 2 (CPM, shBORIS/shCtrl ) 5.0 2.5 0 –2.5 0.5 0 –0.5 –1.0 –1.5 BORIS both SE
BORIS resistant SE BORIS resistant SE
P = 9.1 × 10–70 P = 5.7 × 10⁻²⁰ P = 2.2 × 10⁻¹⁸ P = 7.0 × 10⁻⁶ + BORIS regulatory loop + BORIS + SE + SE + KD BORIS regulatory loop 113,232 kb 113,452 kb ALK MYCN NEUROD1 NEUROD4 NEUROG1 BORIS CTCF BORIS CohesinBRD4 H3K27ac SIX1 SOX2 NEUROG2 Sensitive Intermediate resistant Resistant BORIS-mediated looping SE H3K27me3 BORIS
Fig. 4 | BORIS-regulated chromatin remodelling supports a phenotypic switch that maintains the resistant state. a, Left, fold
change in expression in counts per million (CPM) of genes involved in resistant cell-specific regulatory interactions that are positive for BORIS binding (n = 1,368) versus those involved in regulatory interactions that are negative for BORIS binding (n = 519) or not associated with a new regulatory interaction (other) (n = 16,151). Centre, fold change in expression of genes involved in resistant cell-specific regulatory interactions positive for BORIS binding and associated with super-enhancers (SEs) specific to resistant cells (n = 134) versus those with super-enhancers shared by both cell types (n = 514) or not associated with super-enhancers (n = 720). Right, fold change in expression of genes involved in resistant cell-specific regulatory interactions positive for BORIS binding and associated with resistant cell-specific super-enhancers before and after BORIS knockdown (KD) (n = 134) (P values determined
by two-sided Wilcoxon rank-sum test). For all box plots, centre lines denote medians; box limits denote twenty-fifth and seventy-fifth percentiles; whiskers denote minima and maxima (1.5× the interquartile range). b, Highest-ranked transcription factors associated with the resistance phenotype selected based on the presence of at least four of the five indicated features. c, ChIP–seq tracks of the indicated proteins in sensitive and resistant cells at the NEUROG2 locus; regulatory interactions with PET numbers indicated below. d, Transcription factor recognition motifs at super-enhancers and promoters (± 2 kb) of the 1,000 highest-expressed genes in resistant and sensitive cells (n = 2 biological replicates) (P values determined by hypergeometric enrichment test). Panels a–c integrate data of biological replicates from expression microarrays (n = 2), ChIP–seq (n = 2) and HiChIP (n = 3). e, Proposed role of BORIS in resistant cells.
BRD4, which rendered the resistant cells more sensitive to BET inhi-bition (Extended Data Fig. 9; Supplementary Note 2). Together, these results indicate the establishment of an alternative transcription factor regulatory network controlled by BORIS-induced chromatin remod-elling to support the resistant cell state.
Thus, using a pair of isogenic ALK-inhibitor sensitive and resistant neuroblastoma cell lines, we show that the CTCF paralogue BORIS can promote regulatory DNA interactions that support a phenotypic switch in the context of treatment resistance (Fig. 4e). This mechanism appears relevant to different neuroblastoma cell lines and kinase inhib-itors and may extend to other cancers. In Ewing sarcoma, in which overexpression of BORIS is associated with metastasis and relapse (Extended Data Fig. 1c), we observed increased BORIS occupancy at regulatory regions in chemotherapy-resistant cell lines (Extended Data Fig. 10; Supplementary Note 3). Further work will establish whether BORIS-mediated alteration of chromatin looping is a general mecha-nism by which tumour cells co-opt developmental networks to sustain alternative cell states in response to targeted or conventional therapies.
Online content
Any methods, additional references, Nature Research reporting summaries, source data, extended data, supplementary information, acknowledgements, peer review information; details of author contributions and competing interests; and statements of data and code availability are available at https://doi.org/ 10.1038/s41586-019-1472-0.
Received: 21 July 2017; Accepted: 11 July 2019; Published online xx xx xxxx.
1. Dixon, J. R. et al. Topological domains in mammalian genomes identified by analysis of chromatin interactions. Nature 485, 376–380 (2012). 2. Phillips-Cremins, J. E. et al. Architectural protein subclasses shape 3D
organization of genomes during lineage commitment. Cell 153, 1281–1295 (2013).
3. Hnisz, D. et al. Activation of proto-oncogenes by disruption of chromosome neighborhoods. Science 351, 1454–1458 (2016).
4. Katainen, R. et al. CTCF/cohesin-binding sites are frequently mutated in cancer. Nat. Genet. 47, 818–821 (2015).
5. Flavahan, W. A. et al. Insulator dysfunction and oncogene activation in IDH mutant gliomas. Nature 529, 110–114 (2016).
6. Loukinov, D. I. et al. BORIS, a novel male germ-line-specific protein associated with epigenetic reprogramming events, shares the same 11-zinc-finger domain with CTCF, the insulator protein involved in reading imprinting marks in the soma. Proc. Natl Acad. Sci. USA 99, 6806–6811 (2002).
7. Klenova, E. M., Morse, H. C. III, Ohlsson, R. & Lobanenkov, V. V. The novel BORIS + CTCF gene family is uniquely involved in the epigenetics of normal biology and cancer. Semin. Cancer Biol. 12, 399–414 (2002).
8. Martin-Kleiner, I. BORIS in human cancers — a review. Eur. J. Cancer 48, 929–935 (2012).
9. Garikapati, K. R. et al. Down-regulation of BORIS/CTCFL efficiently regulates cancer stemness and metastasis in MYCN amplified neuroblastoma cell line by
modulating Wnt/β-catenin signaling pathway. Biochem. Biophys. Res. Commun.
484, 93–99 (2017).
10. Cheung, N. K. & Dyer, M. A. Neuroblastoma: developmental biology, cancer genomics and immunotherapy. Nat. Rev. Cancer 13, 397–411 (2013).
11. Monk, M., Hitchins, M. & Hawes, S. Differential expression of the embryo/cancer gene ECSA(DPPA2), the cancer/testis gene BORIS and the pluripotency structural gene OCT4, in human preimplantation development. Mol. Hum. Reprod. 14, 347–355 (2008).
12. Brodeur, G. M., Seeger, R. C., Schwab, M., Varmus, H. E. & Bishop, J. M. Amplification of N-myc in untreated human neuroblastomas correlates with advanced disease stage. Science 224, 1121–1124 (1984).
13. George, R. E. et al. Activating mutations in ALK provide a therapeutic target in neuroblastoma. Nature 455, 975–978 (2008).
14. Galkin, A. V. et al. Identification of NVP-TAE684, a potent, selective, and efficacious inhibitor of NPM-ALK. Proc. Natl Acad. Sci. USA 104, 270–275 (2007).
15. Chipumuro, E. et al. CDK7 inhibition suppresses super-enhancer-linked oncogenic transcription in MYCN-driven cancer. Cell 159, 1126–1139 (2014). 16. Durbin, A. D. et al. Selective gene dependencies in MYCN-amplified
neuroblastoma include the core transcriptional regulatory circuitry. Nat. Genet.
50, 1240–1246 (2018).
17. van der Maaten, L. & Hinton, G. Visualizing data using t-SNE. J. Mach. Learn. Res.
9, 2579–2605 (2008).
18. Zeid, R. et al. Enhancer invasion shapes MYCN-dependent transcriptional amplification in neuroblastoma. Nat. Genet. 50, 515–523 (2018). 19. Muhar, M. et al. SLAM-seq defines direct gene-regulatory functions of the
BRD4-MYC axis. Science 360, 800–805 (2018).
20. Wegner, M. & Stolt, C. C. From stem cells to neurons and glia: a Soxist’s view of neural development. Trends Neurosci. 28, 583–588 (2005).
21. Gao, Y. et al. Overcoming resistance to the THZ series of covalent transcriptional CDK inhibitors. Cell Chem. Biol. 25, 135–142 (2018).
22. Pugacheva, E. M. et al. Comparative analyses of CTCF and BORIS occupancies uncover two distinct classes of CTCF binding genomic regions. Genome Biol. 16, 161 (2015).
23. Bergmaier, P. et al. Choice of binding sites for CTCFL compared to CTCF is driven by chromatin and by sequence preference. Nucleic Acids Res. 46, 7097–7107 (2018).
24. Mumbach, M. R. et al. HiChIP: efficient and sensitive analysis of protein-directed genome architecture. Nat. Methods 13, 919–922 (2016).
25. Dowen, J. M. et al. Control of cell identity genes occurs in insulated neighborhoods in mammalian chromosomes. Cell 159, 374–387 (2014). 26. Sanborn, A. L. et al. Chromatin extrusion explains key features of loop and
domain formation in wild-type and engineered genomes. Proc. Natl Acad. Sci. USA 112, E6456–E6465 (2015).
27. Whyte, W. A. et al. Master transcription factors and mediator establish super-enhancers at key cell identity genes. Cell 153, 307–319 (2013). 28. Hnisz, D. et al. Super-enhancers in the control of cell identity and disease. Cell
155, 934–947 (2013).
29. Kumar, J. P. The sine oculis homeobox (SIX) family of transcription factors as regulators of development and disease. Cell. Mol. Life Sci. 66, 565–583 (2009).
30. Dennis, D. J., Han, S. & Schuurmans, C. bHLH transcription factors in neural development, disease, and reprogramming. Brain Res. 1705, 48–65 (2019).
Publisher’s note: Springer Nature remains neutral with regard to jurisdictional
claims in published maps and institutional affiliations.
© The Author(s), under exclusive licence to Springer Nature Limited 2019
Methods
Cell lines. Human neuroblastoma cell lines Kelly and SK-N-BE(2) and human
Ewing sarcoma cell lines TC-32, TC-71 and CHLA-1031,32 were obtained from
the Children’s Oncology Group cell line bank. Human neuroblastoma cell line SK-N-SH and human embryonic kidney cell line HEK293T were obtained from the American Type Culture Collection. Cell line authenticity was confirmed by genotyping, and cells were tested negative for mycoplasma contamination every 3 months. All cells except HEK293T were grown in RPMI-1640 medium sup-plemented with 10% fetal bovine serum (FBS) and 1% penicillin/streptomycin (Life Technologies). HEK293T cells were grown in DMEM medium supplemented with 10% FBS and 1% penicillin/streptomycin (Life Technologies). Resistant cells were grown in the presence of either the ALK inhibitor, TAE68414 (Kelly and
SK-N-SH) or the CDK12 inhibitor, E921 (SK-N-BE(2)).
Compounds. TAE684 and E9 were synthesized in-house in the Gray laboratory
and JQ133 was obtained from J.Qi’s laboratory at the Dana-Farber Cancer Institute
(DFCI). Ceritinib34, lorlatinib35 and I-BET72636 were purchased from Selleck
Chemicals.
Synthetic RNA spike-in and microarray analysis. Total RNA and sample
prepara-tion was performed as previously described37. In brief, cells were either incubated
in medium containing DMSO, TAE684 (1 µM) or JQ1 (2.5 µM), or infected with shRNA (Ctrl or BORIS) for 24 h. Cell numbers were determined using a Countess II cell counter (Life Technologies) before lysis and RNA extraction. Biological duplicates (equivalent to 5 × 10⁶ cells per replicate) were collected and
homoge-nized in 1 ml of TRIzol Reagent (Ambion), purified using the mirVANA miRNA isolation kit (Ambion) following the manufacturer’s instructions and re-suspended in 50 µl nuclease-free water (Ambion). Total RNA was spiked-in with ERCC RNA Spike-In Mix (Ambion), treated with DNA-free DNase I (Ambion) and analysed on an Agilent 2100 Bioanalyzer (Agilent Technologies) for integrity. RNA with the RNA Integrity Number above 9.8 was hybridized to Affymetrix GeneChip PrimeView Human Gene Expression arrays (Affymetrix).
Antibodies. The following antibodies were used: N-MYC (9405), N-MYC
(51705), cleaved PARP (9541), cleaved caspase 3 (9661), ALK (3333), AKT (4691), pAKT-T308 (9275), pAKT-S473 (#9271), ERK (4695), pERK (4377), S6 (2217), pS6 (4857), STAT3 (4904), pSTAT3 (9131), ABCB1 (12683), SOX2 (3579), β-actin (4967), CTCF (3417), normal rabbit IgG (2729) and HRP anti-mouse IgG (7076) from Cell Signaling Technology; HRP anti-rabbit IgG (sc-2357) from Santa Cruz Biotechnology; BRD4 (A301-985A100) and SMC1A (A300-055A) from Bethyl Laboratories; CTCF (07-729), SOX9 (AB5535) and H3K27me3 (07-449) from Millipore; pALK-Y1507 (ab73996), BORIS (ab187163) and H3K27ac (ab2729) from Abcam; BORIS (NBP2-52405) from NOVUS Biologicals; BORIS (39851) from Active Motif; SIX1 (HPA001893) from Sigma-Aldrich; and Vysis LSI N-MYC (2p24) SpectrumGreen/Vysis CEP 2 SpectrumOrange Probe (07J72-001) from Abbott.
Cell viability and growth curve assays. Viability and growth experiments were
performed using the CellTiter-Glo Luminescent Cell Viability Assay (Promega) according to the manufacturer’s instructions, as previously described38. Cells were
plated in 96-well plates at a seeding density of 4 × 10³ cells per well. For growth
assays, the cells were analysed each day until day 5. For viability, after 24 h, the cells were treated with various concentrations of the indicated drug (ranging from 1 nM to 10 µM except for I-BET726: 2 nM to 20 µM). DMSO without drug served as a negative control. After 72 h of incubation, cells were analysed for cell viability and IC50 values were determined using a nonlinear regression curve fit with GraphPad
Prism 6 software.
Cell-cycle analysis. Cell-cycle analysis was performed 24 h after cell plating using
propidium iodide staining, as previously described15. Cells fixed with 80% ethanol
overnight at 4 °C were resuspended in PBS supplemented with 0.1% Triton X-100 (Sigma-Aldrich), 25 mg ml−1 propidium iodide (BD Biosciences) and 0.2 mg ml−1
RNase A (Sigma-Aldrich). After 45 min at 37 °C in the dark, analysis was per-formed on a FACSCalibur flow cytometer (BD Biosciences). Cell-cycle profiles were plotted as histograms generated using FlowJo software (FLOWJO).
Western blotting. Cell or tumour tissue was lysed in NP-40 buffer (Invitrogen)
containing a 1× complete protease inhibitor tablet (Roche) per 10 ml buffer and a cocktail of phosphatase inhibitors (Roche). Protein concentration was measured using the DC Protein Assay (Bio-Rad); protein (50 µg) was denatured in LDS sam-ple buffer with reducing agent (Invitrogen), separated on precast 4–12% Bis-Tris gels (Life Technologies) and transferred to nitrocellulose membranes (Bio-Rad). Membranes were incubated in blocking buffer (5% dry milk in TBS with 0.2% Tween-20) for 1 h, and then incubated in the primary antibody in blocking buffer overnight at 4 °C. Chemiluminescent detection was performed with the appropriate secondary antibodies and developed using Genemate Blue ultra-autoradiography film (VWR). The actin loading controls for the protein samples shown in the immunoblots of the following panels (two independent mouse tumour samples, and cell lines representative of two independent experiments) are the same because the samples were run on a single gel but probed for pALK, ALK (Extended Data
Fig. 2a), MYCN (Extended Data Fig. 3e) and BORIS (Extended Data Fig. 4a), respectively.
Co-immunoprecipitation. Cells were collected in immunoprecipitation lysis
buffer (50 mM Tris-HCl buffer (pH 7.4), 100 mM NaCl, 1% Triton-100, 1 mM PMSF), containing a 1× complete protease inhibitor tablet (Roche) per 10 ml buffer and a cocktail of phosphatase inhibitors (Roche). Homogenates were centri-fuged at 20,000g for 10 min at 4 °C to obtain supernatants. DNase I (approximately 1 U ml−1) was used to degrade DNA in supernatants by incubation for 1 h at room
temperature. Co-immunoprecipitation of endogenously expressed proteins was performed using protein A Dynabeads (Invitrogen), according to the manufac-turer’s instructions. In brief, antibody-conjugated Dynabeads were incubated with purified cell lysates to immunoprecipitate the target antigen. Antibodies used for immunoprecipitation were CTCF (3417, Cell Signaling Technology) and BORIS (NBP2-52405, NOVUS Biologicals). The elution step was conducted by heating the beads for 10 min at 95 °C in lithium dodecyl sulfate (LDS) sample buffer with reducing agent (Invitrogen), after which western blotting was performed using the following antibodies: CTCF (3417, Cell Signaling Technology) and BORIS (9851, Active Motif).
Plasmids, shRNA knockdown and overexpression systems. pLKO.1
shRNA constructs (control: SHC007; MYCN: 1-TRCN0000020694 and 2-TRCN0000363425; BORIS: 3-TRCN0000370229 and 4-TRCN0000365141; BRD4: A-TRCN0000318771 and B-TRCN0000196576) were purchased from Sigma-Aldrich and pLKO.1 GFP shRNA was a gift from D. Sabatini (Addgene plas-mid 30323)39. Overexpression constructs were generated by cloning BORIS cDNA
into the Tet-inducible pInducer20 vector, provided by S. Elledge (Addgene plasmid 44012)40. Production of lentiviral particles and subsequent infection were
per-formed as previously described38. The lentivirus was packaged by co-transfection of
either pLKO.1 or pInducer20 plasmid with the helper plasmids, pCMV-deltaR8.91 and pMD2.G-VSV-G into HEK293T cells using TransIT-LT1 Transfection Reagent (Mirus Bio LLC). Virus-containing supernatants were collected 48 h after trans-fection. Cells were infected with 8 µg ml−1 polybrene (Sigma-Aldrich) and 24–48
h later selected with puromycin (pLKO.1) (Sigma-Aldrich) and then collected at appropriate time points. When using the Tet-inducible system for BORIS overex-pression, induction of gene expression was achieved by treating cells every 2–3 days with doxycycline (0.2 µg ml−1) for a total duration of 37 days.
qRT–PCR. RNA isolation and PCR amplification were performed as previously
described38, except that the RT–PCR was performed using the SuperScript III
First-Strand system (Life Technologies). Total RNA was isolated from cell lines with the RNeasy kit (Qiagen). One microgram of purified RNA was reverse transcribed using Superscript III First-Strand (Invitrogen) according to the manufacturer’s protocol, and quantitative PCR was performed using SYBR Green on a Viia7 Real-Time PCR system (Thermo Fisher Scientific). All experiments were performed in biological triplicates unless stated otherwise. Each individual biological sample was amplified by qPCR in technical replicates and normalized to actin as an internal control. Amplification was carried out with primers specific to the genes to be quantified (sequences available on request).
Sequence analysis. The kinase domain of ALK was amplified from cDNA
extracted from sensitive and resistant cells using the HotStar HiFidelity Polymerase Kit (Qiagen). The PCR products were cloned into the pGEM-T vector (Promega) and confirmed by sequencing.
RTK array. The Human Phospho-RTK Array Kit (R&D Systems) was used as
previously described38. Cell lysate (500 µg) was incubated on a phospho-RTK
membrane array (ARY001B) according to the manufacturer’s instructions. Target proteins were captured with their respective antibodies. After washing, the pro-teins were incubated with a phosphotyrosine antibody conjugated to horseradish peroxidase to allow the detection of captured phosphorylated RTKs.
Fluorescent in situ hybridization. Fluorescent in situ hybridization (FISH)
anal-yses were performed using a Vysis LSI N-MYC (2p24) SpectrumGreen/Vysis CEP 2 SpectrumOrange Probe (Vysis), in accordance with the manufacturer’s instruc-tions.
Immunohistochemistry. All human tumour specimens (formalin-fixed
par-affin-embedded slides) were obtained under an Institutional Review Board (IRB)-approved protocol of the Dana-Farber/Boston Children's Cancer and Blood Disorders Center, and informed consent was obtained from all subjects. Staining was performed by Applied Pathology Systems using the ImmPRESS Excel Amplified HRP Polymer Staining Kit (MP-7601, Vector Laboratories) on a Dako Autostainer (Agilent Technologies). Sections were deparaffinized, rehydrated, and subjected to antigen retrieval in citrate-based buffer on a steamer for 25 min. Slides were blocked with BLOXALL blocking solution and 2.5% horse serum sequen-tially before a 1-h incubation with BORIS antibody at 1:50 dilution (ab187163, Abcam). Sections were then incubated with anti-rabbit amplifier antibody and ImmPRESS Excel Amplified HRP Polymer Reagent sequentially before incuba-tion with ImmPACT DAB EqV Substrate. Finally, slides were counterstained with haematoxylin, followed by dehydration and the addition of coverslips.
Bisulfite sequencing. Methylation analysis of BORIS (NCBI RefSeq
NC_000020.11, spanning nucleotides chr20: 57,524,203–57,525,234 on GRCh38.p7 assembly) was performed using a bisulfite sequencing assay. Genomic DNA (500 ng) was treated with the EZ DNA Methylation-Lightning Kit (Zymo Research), followed by PCR using ZymoTaq Polymerase premix (Zymo Research) and specific primers designed using the Zymo bisulfite primer seeker (http://www.zymore-search.com/tools/bisulfite-primer-seeker/; sequences available on request). PCR products were then sequenced for the assessment of CpG site-specific DNA meth-ylation in the BORIS promoter region.
Growth assay. After shRNA-mediated knockdown of BORIS, cells were reseeded
at a density of 4 × 10⁵ cells per well in 6-well plates. At 48 and 120 h of incubation,
cells were stained with trypan blue (Sigma-Aldrich) and counted on a Countess II cell counter (Life Technologies).
Mouse experiments. All mouse experiments were performed with approval
from the Institutional Animal Care and Use Committee (IACUC) of the DFCI. Three mouse experiments were performed: (i) to assess the tumor-igenic potential of resistant cells in vivo; (ii) to assess that resistance to TAE684 was maintained in vivo; and (iii) to assess the effect of JQ1 on resist-ant cells in vivo. All experiments were performed using subcutaneous cell xenograft models generated by injecting 2 × 10⁶ sensitive or resistant Kelly
neuroblastoma cells into the flanks of NU/NU (Crl:NU-Foxn1nu) (Charles
River Laboratories) or NU/NU (CrTac:NCr-Foxn1nu) (Taconic) 7-week-old
female mice. Mice were randomized into groups of equal average volumes, and investigators were not blinded to group allocation during data collec-tion. (i) To assess the tumorigenic potential of resistant cells in absence of treatment, mice with established disease (mean tumour volume of 200 mm3)
were monitored for up to 23 days (n = 4 per group). Tumours were obtained, dissociated and used to establish cell lines and for assessment of mRNA levels, protein expression and sensitivity to TAE684. (ii) To ensure that the in vitro resistance to TAE684 was maintained in vivo, mice with estab-lished disease were divided into two cohorts and were treated with either TAE684 (10 mg kg−1) or vehicle control by oral gavage once daily (n = 8
per group), and were monitored for up to 56 days from start of treatment. (iii) To assess the sensitivity of resistant cells to BRD4 inhibition, mice with established disease were divided into two cohorts and treated with either JQ1 (50 mg kg−1) or vehicle control intraperitoneally (i.p.) once daily (n = 6
per group), and were monitored for up to 87 days from start of treatment. For all experiments, disease burden was quantified using electronic caliper measurements (2–3 times a week) and mouse weights were moni-tored at least twice a week. Tumour volumes were calculated using the modified ellipsoid formula41: ½(length × width2). Animals were
euthanized when tumour volumes reached 1,500–2,000 mm3 based
on institutional IACUC criteria for maximum tumour volumes. In none of the experiments were the institutional limits for tumour volumes (<2,000 mm3 measurement preceding the day of euthanization)
exceeded.
ChIP–seq. ChIP was carried out as previously described15 with minor changes as
described. Approximately 1 × 10⁷ cells were crosslinked for 10 min at room
tem-perature with 1% formaldehyde (Thermo Scientific) in PBS followed by quenching with 0.125 M glycine for 5 min. The cells were then washed twice in ice-cold PBS, and the cell pellets flash frozen and stored at −80 °C. Fifty microlitres of protein G Dynabeads per sample (Invitrogen) were blocked with 0.02% Tween20 (w/v) in PBS. Magnetic beads were loaded with 10 µg each of antibody and incubated overnight at 4 °C. Crosslinked cells were lysed, placed in sonication buffer with 0.2% SDS, placed on ice and chromatin was sheared using a Misonix 3000 sonicator (Misonix) at the following settings: 10 cycles, each for 30 s on, followed by 1 min off, at a power of approximately 20 W. The lysates were then centrifuged for 10 min at 4 °C, supernatants collected and diluted with an equal amount of sonica-tion buffer to reach a final concentrasonica-tion of 0.1% SDS. The sonicated lysates were incubated overnight at 4 °C with the antibody-bound magnetic beads, washed with low-salt buffer (50 mM HEPES-KOH (pH 7.5), 0.1% SDS, 1% Triton X-100, 0.1% sodium deoxycholate, 1 mM EGTA, 1 mM EDTA, 140 mM NaCl and 1× complete protease inhibitor), high-salt buffer (50 mM HEPES-KOH (pH 7.5), 0.1% SDS, 1% Triton X-100, 0.1% sodium deoxycholate, 1 mM EGTA, 1 mM EDTA, 500 mM NaCl and 1× complete protease inhibitor), LiCl buffer (20 mM Tris-HCl (pH 8), 0.5% NP-40, 0.5% sodium deoxycholate, 1 mM EDTA, 250 mM LiCl and 1× complete protease inhibitor) and Tris-EDTA buffer. DNA was then eluted in elution buffer (50 mM Tris-HCl (pH 8.0), 10 mM EDTA, 1% SDS), and high-speed centrifugation was performed to pellet the magnetic beads and collect the supernatants. The crosslinking was reversed overnight at 65 °C. RNA and protein were digested using RNase A and proteinase K, respectively, and DNA was purified with phenol chloroform extraction and ethanol precipitation. Purified ChIP DNA was used to prepare Illumina multiplexed sequencing libraries using the NEBNext Ultra II DNA Library Prep kit and the NEBNext Multiplex Oligos for Illumina
(New England Biolabs) according to the manufacturer’s protocol. Libraries with distinct indexes were multiplexed and run together on the Illumina NextSeq 500 (SY-415-1001, Illumina) for 75 bases in single-read mode.
HiChIP. HiChIP was performed as previously described24 with a few
modifica-tions. Approximately 1 × 10⁷ cells were crosslinked for 10 min at room
tempera-ture with 1% formaldehyde in growth medium and quenched in 0.125 M glycine. After washing twice with ice-cold PBS, the supernatant was aspirated and the cell pellet flash frozen in liquid nitrogen. Crosslinked cell pellets were thawed on ice, resuspended in 1 ml of ice-cold Hi-C lysis buffer (10 mM Tris-HCl (pH 8.0), 10 mM NaCl, 0.2% NP-40 and 1× complete protease inhibitor) and incubated at 4 °C for 30 min with rotation. Nuclei were pelleted by centrifugation for 5 min at 4 °C and washed once with 500 µl of ice-cold Hi-C lysis buffer. After removing the supernatant, nuclei were resuspended in 100 µl of 0.5% SDS and incubated at 62 °C for 10 min. SDS was quenched by adding 335 µl of 1.5% Triton X-100 and incubating for 15 min at 37 °C. After the addition of 50 µl of 10× NEB Buffer 2 (New England Biolabs, B7002) and 375 U of MboI restriction enzyme (New England Biolabs, R0147), chromatin was digested at 37 °C for 2 h with rotation. After digestion, MboI enzyme was heat-inactivated by incubating the nuclei at 62 °C for 20 min. To fill in the restriction fragment overhangs and mark the DNA ends with biotin, 52 µl of fill-in master mix, containing 37.5 µl of 0.4 mM bio-tin-dATP (Invitrogen, 19524016), 1.5 µl of 10 mM dCTP (Invitrogen, 18253013), 1.5 µl of 10 mM dGTP (Invitrogen, 18254011), 1.5 µl of 10 mM dTTP (Invitrogen, 18255018), and 10 µl of 5 U µl−1 DNA Polymerase I, Large (Klenow) Fragment
(New England Biolabs, M0210), were added and the tubes were incubated at 37 °C for 1 h with rotation. Proximity ligation was performed by the addition of 948 µl of ligation master mix, containing 150 µl of 10× NEB T4 DNA ligase buffer (New England Biolabs, B0202), 125 µl of 10% Triton X-100, 7.5 µl of 20 mg ml−1 BSA
(New England Biolabs, B9000), 10 µl of 400 U µl−1 T4 DNA ligase (New England
Biolabs, M0202), and 655.5 µl of water, and incubation at room temperature for 4 h with rotation. After proximity ligation, nuclei were pelleted by centrifugation for 5 min and resuspended in 1 ml of ChIP sonication buffer (50 mM HEPES-KOH (pH 7.5), 140 mM NaCl, 1 mM EDTA pH 8.0, 1 mM EGTA (pH 8.0), 1% Triton X-100, 0.1% sodium deoxycholate, 0.1% SDS and 1× complete protease inhibitor). Nuclei were sonicated using a Misonix 3000 sonicator (Misonix) at the following settings: 12 cycles, each for 30 s on, followed by 1 min off, at a power of approximately 20 W. Sonicated chromatin was clarified by centrifugation for 15 min at 4 °C and the supernatant was transferred to a tube. Sixty microlitres of protein G Dynabeads (Invitrogen) were washed three times and resuspended in 50 µl sonication buffer. Washed beads were then added to the sonicated chroma-tin and incubated for 1 h at 4 °C with rotation. Beads were then separated on a magnetic stand and the supernatant was transferred to a new tube. Seventy-five microlitres of protein G Dynabeads pre-incubated overnight at 4 °C with 10 µg of anti-SMC1A antibody (Bethyl A300-055A) or 10 µg of BORIS antibody (Abcam, ab187163) were added to the tube and incubated overnight at 4 °C with rotation. Beads were then separated on a magnetic stand and washed twice with 1 ml of sonication buffer, followed by once with 1 ml high-salt sonication buffer (50 mM HEPES-KOH (pH 7.5), 500 mM NaCl, 1 mM EDTA pH 8.0, 1 mM EGTA (pH 8.0), 1% Triton X-100, 0.1% sodium deoxycholate, 0.1% SDS), once with 1 ml of LiCl wash buffer (20 mM Tris-HCl (pH 8.0), 1 mM EDTA pH 8.0, 250 mM LiCl, 0.5% NP-40, 0.5% sodium deoxycholate, 0.1% SDS) and once with 1 ml of TE buffer with salt (10 mM Tris-HCl (pH 8.0), 1 mM EDTA pH 8.0, 50 mM NaCl). Beads were then resuspended in 200 µl of elution buffer (50 mM Tris-HCl (pH 8.0), 10 mM EDTA pH 8.0, 1% SDS) and incubated at 65 °C for 15 min. To purify the eluted DNA, RNA was degraded by the addition of 8.5 µl of 10 mg ml−1 RNase
A and incubation at 37 °C for 2 h. Protein was degraded by the addition of 20 µl of 10 mg ml−1 proteinase K and incubation at 55 °C for 45 min. Samples were
then incubated at 65 °C overnight to reverse crosslink protein–DNA complexes. DNA was then purified using Zymo ChIP DNA Clean and Concentrator columns (Zymo, D5205) according to the manufacturer’s protocol and eluted in 14 µl water. The amount of eluted DNA was quantified by Qubit dsDNA HS kit (Invitrogen, Q32854). Tagmentation of ChIP DNA was performed using the Illumina Nextera DNA Library Prep Kit (Illumina, FC-121-1030). First, 5 µl of MyOne Streptavidin C1 Dynabeads (Invitrogen, 65001) was washed with 1 ml of Tween wash buffer (5 mM Tris-HCl (pH 7.5), 0.5 mM EDTA (pH 8.0), 1 M NaCl, 0.05% Tween-20) and resuspended in 10 µl of 2× biotin binding buffer (10 mM Tris-HCl (pH 7.5), 1 mM EDTA pH 8.0, 2 M NaCl). Then, 25 ng of purified DNA was added in a total volume of 10 µl water to the beads and incubated at room temperature for 15 min with agitation every 5 min. After capture, beads were separated with a magnet and the supernatant was discarded. Beads were then washed twice with 500 µl of Tween wash buffer, incubating at 55 °C for 2 min with shaking for each wash. Beads were resuspended in 25 µl of Nextera Tagment DNA buffer. To tagment the captured DNA, 1 µl of Nextera Tagment DNA Enzyme 1 was added with 24 µl of Nextera Resuspension Buffer and samples were incubated at 55 °C for 10 min with shaking. Beads were separated on a magnet and supernatant was discarded. Beads were
washed twice with 500 µl of 50 mM EDTA at 50 °C for 30 min, washed twice with 500 µl of Tween wash buffer at 55 °C for 2 min each, and finally washed once with 500 µl of 10 mM Tris-HCl (pH 7.5) for 1 min at room temperature. Beads were separated on a magnet and supernatant was discarded. To generate the sequencing library, PCR amplification of the tagmented DNA was performed while the DNA was still bound to the beads. Beads were resuspended in 15 µl of Nextera PCR Master Mix, 5 µl of Nextera PCR Primer Cocktail, 5 µl of Nextera Index Primer 1, 5 µl of Nextera Index Primer 2 and 20 µl water. DNA was amplified with 9–10 cycles of PCR. After PCR, beads were separated on a magnet and the supernatant containing the PCR-amplified library was transferred to a new tube, purified using Zymo DNA Clean and Concentrator columns (Zymo, D5205) according to the manufacturer’s protocol, and eluted in 14 µl water. Purified HiChIP libraries were size-selected to 300–700 bp using a Sage Science Pippin Prep instrument according to the manufacturer’s protocol and subjected to 2 × 100 paired-end sequencing using an Illumina HiSeq 2500 system (SY–401–2501, Illumina).
scRNA-seq. Kelly cells (sensitive, intermediate and resistant states) were grown to
70% confluence in T75 culture flasks. In brief, growth medium was aspirated and cells were treated with 0.25% Trypsin/EDTA for 3 min at 37 °C, after which cells were washed twice with 1× PBS. Cells were then resuspended into single cells at a concentration of 1 × 10⁶ per ml in 1× PBS with 0.4% BSA for 10x Genomics
pro-cessing. The sorted cell suspensions were loaded onto a 10x Genomics Chromium instrument to generate single-cell gel beads in emulsion (GEMs). Approximately 5,000 cells were loaded per channel. scRNA-seq libraries were prepared using the following Single Cell 3′ Reagent Kits: Chromium Single Cell 3′ Library & Gel Bead Kit v2 (PN-120237), Single Cell 3′ Chip Kit v2 (PN-120236) and i7 Multiplex Kit (PN-120262) (10x Genomics) as previously described42, and following the Single
Cell 3′ Reagent Kits v2 User Guide (Manual Part CG00052 Rev A). Libraries were run on an Illumina HiSeq 4000 system (SY-401-4001, Illumina) as 2 × 150 paired-end reads, one full lane per sample, for approximately >90% sequencing saturation.
Genomics analysis: direct comparison of CTCF and BORIS expression in healthy and tumour samples. To assess the expression levels and range of BORIS
and CTCF in healthy and tumour cells all GTEx, TCGA and TARGET datasets were downloaded and converted to FPKM values and displayed as [log2(FPKM +
1)] (Extended Data Fig. 1a, b).
Association of BORIS with prognostic features. For each dataset, processed
val-ues were extracted from the Gene Expression Omnibus (GEO) and scaled valval-ues were created by normalizing the expression levels by the minimum mean value of the conditions that were compared, Esi,j = Ei,j/min(average(Ej)). The two-sided Wilcoxon rank-sum test on the original values was used to determine statistical differences between the compared conditions (Extended Data Fig. 1c and Extended Data Fig. 4f).
Microarray data analysis. Microarray data were analysed using a custom CDF
file (GPL16043) that contained the mapping information of the ERCC probes used in the spike-in RNAs. The arrays were normalized as previously described37.
In brief, all microarray chip data were imported in R (https://www.r-project.org/, v.3.1.3) using the affy package43 (v.1.44.0), converted into expression values using
the expresso command, normalized to take into account the different numbers of cells and spike-ins used in the different experiments and renormalized using loess regression fitted to the spike-in probes. Sets of differentially expressed genes were obtained using the limma package44 (v.3.22.7) and a FDR value of 0.05. Spike-in
normalized absolute expression values (counts) were normalized to CPM as a measurement of relative gene expression concentrations per condition. Total num-ber of transcripts per sample was determined as the total numnum-ber of counts after spike-in normalization and the BORIS shRNA sample was first normalized to the control shRNA sample to account for technical effects that originated from the transfection protocol.
ChIP–seq analysis. For all ChIP–seq samples, high-quality data were confirmed
using the Fastqc tool (v.0.11.5) and samples were aligned to the human genome (build hg19, GRCh37.75) with STAR (v.2.5.1b_modified) and the parameters ‘– alignIntronMax 1–alignEndsType EndToEnd–outFilterMultimapNmax 1–out-FilterMismatchMax 5’. Next, non-duplicate reads that mapped to the reference chromosomes were retained using Samtools (v.1.3.1) and MarkDuplicates (v.2.1.1) from Picard tools. For each experimental replicate, antibody enrichment was assessed using the plotFingerprint command from deepTools (v.2.2.4). Peaks were identified with MACS2 (v.2.1.1) for narrow peaks (BORIS, CTCF, BRD4, Pol2, MYCN) with the parameters ‘–q 0.01–call-summits’ and for broad peaks (H3K27ac, H3K27me3) with the parameters ‘–broad-cutoff 0.01’. Peaks overlap-ping regions with known artefact regions (http://mitra.stanford.edu/kundaje/ akundaje/release/blacklists/) were blacklisted out. Input normalized bedgraph tracks were created with the deepTools command bamCompare and the param-eters ‘–scaleFactorsMethod=readCount–ratio=subtract–binSize=50–number-OfProcessors=4–extendReads=200’. Subsequently, negative values were set to zero and counts were scaled to RPM per bp to account for differences in library size. Bigwig files were created with bedGraphToBigWig (v.4). ChIP–seq replicates
(n = 2) were merged at the BAM level after assessment of strong correlation with the deepTools command ‘multiBigwigSummary BED-file’ using all replicate bigwigs and identified peaks as input. Identification of peaks and generation of tracks were then repeated for these merged files and used for further analyses. Downstream analyses for ChIP–seq and other genomic interval data was per-formed in R (https://www.r-project.org/) (v.3.5.1) using the data.table (v.1.12.2) package.
Gencode annotation and isoform selection. Gencode (http://www.gencodegenes.
org/, release 19) annotation was used and for each gene the most likely isoform was selected based on data-driven criteria. In brief, only genes that were part of the Refseq transcriptome annotation and with a minimum length of 1 kb were considered. Next, isoforms were prioritized according to increased deposition of Pol2 and H3K27ac reads on the TSS, transcript length and alphabet rank, in that order, until only one transcript was selected for each gene.
Cell-type-specific binding patterns. To determine the cell specificities of BORIS
and CTCF peaks, we first combined all peaks identified by MACS2 and merged the peak regions that overlapped by at least 50%. A 50% threshold was empiri-cally selected to avoid merging peaks that had clear and distinct summits. Next, normalized BORIS or CTCF read densities were calculated for each region and a ratio [log2(resistant/sensitive)] was calculated. Peak regions with a twofold density
increase or decrease were classified as resistant or sensitive cell-specific peaks, respectively, whereas other regions were denoted as ‘shared’ to indicate that these peaks had similar BORIS or CTCF deposition in both cell types (Fig. 2a, b and Extended Data Fig. 6a). To explore the proximity of BORIS and CTCF peaks and how they were altered during the transition from sensitive to resistant cells, we overlapped all shared and cell-type-specific peaks from both cell types in the least stringent way (minimum 1-bp overlap) (Fig. 2c and Extended Data Fig. 6a).
Genomic enrichment of peak-binding sites. To identify genomic locations with
BORIS or CTCF binding we determined the number of peaks that overlapped with at least 25% of known functional regions in the following order: (i) broad promoter (±2 kb TSS); (ii) BRD4+ H3K27ac+ (active) enhancers; (iii) BRD4−
H3K27ac+ enhancers; (iv) exons; (v) introns; (vi) repressed chromatin represented
by H3K27me3 broad peaks; or (vii) other (if the peak was outside the aforemen-tioned regions) (Extended Data Fig. 6d). Enrichment of ChIP–seq binding at resist-ant cell BORIS peaks was performed by extending BORIS summits by 1 kb in both directions and calculating the normalized read densities in 50-bp bins (Fig. 2d).
Genomic enrichment of regulatory regions. To visualize the enrichment of CTCF
and BORIS at regulatory regions (enhancers and promoters) and the differences between sensitive and resistant cells, a metagene analysis for CTCF and BORIS occupancies was performed for all H3K27ac enhancer regions and gene promoters. All TSSs were extended in both directions by 2 kb and binned in 50-bp bins, and each enhancer (start–end) was divided into 40 equally sized bins and extended with 2 kb in both directions and these extended regions were binned in 50-bp bins. Normalized bedgraph files were used to calculate read density (RPM per bp). An aggregated summary profile was created for each cell type. To account for different numbers of identified enhancers in both cells types we calculated a normalization factor (N resistant enhancers/N sensitive enhancers) to divide each aggregated read density (Extended Data Fig. 6e).
HiChIP processing and quality control. For all SMC1A-based HiChIP datasets,
raw reads were first trimmed to a uniform length of 50 bp using trimmomat-ic45(v.0.36) and were then processed using the HiC-Pro (v.2.10.0) pipeline46 with
default settings for the human genome (build hg19, GRCh37.75) and correspond-ing MboI cut sites. To perform intra- and inter-correlation analysis for biologi-cal replicates, forward and reverse reads from the HiC-Pro output were merged together to generate one-dimensional SMC1A BAM profiles. Genome-wide Spearman correlation in 5-kb bins was computed for all merged genomic anchor regions on those merged BAMs for all replicates using the ‘multiBamSummary BED-file’ command from deepTools (Extended Data Fig. 7a, e).
HiChIP loop calling and differential looping analysis. Loops were directly called
from the HiC-Pro output using hichipper47 (v.0.7.3), with parameter
‘peaks = com-bined, all’, and subsequently diffloop47 (v.1.10.0) with default settings. Only loops
that were detected in all three biological replicates of a sample (sensitive, resist-ant, shCtrl or shBORIS) with a minimum of five paired-end tags in total and an FDR ≤ 0.01 were retained for further analysis. To call differential loops between samples, the quickAssocVoom function was used and significantly different loops were either considered reinforced (mango.FDR < 0.01 and log2-transformed fold
change > 1) or lost (mango.FDR < 0.01 and log2-transformed fold change < −1). Classification of HiChIP interactions. SMC1A-based HiChIP interactions (loops)
were classified as previously described48 with minor adaptations. Associated
anchors of loops were overlapped with our ChIP-seq peaks (CTCF, BORIS, H3K27ac, BRD4) and promoter regions (TSS ± 2 kb), requiring a minimum 1-bp overlap. Each anchor was then independently classified according to its overlap profile, following a hierarchical tree. If an anchor overlapped a pro-moter, an enhancer (BRD4 + H3K27ac), or a CTCF peak, it was classified as