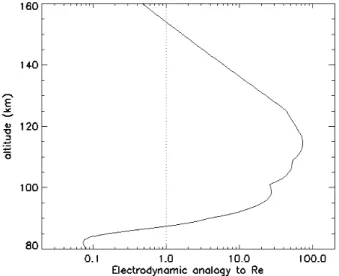
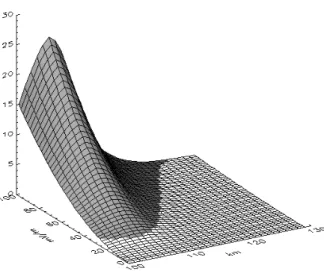
<i>Letter to the Editor</i><br>An analogy to the Reynolds number for the neutral gas component of a weak plasma
Texte intégral
Figure
Documents relatifs
Modular bioink for 3D printing of biocompatible hydrogels: sol- gel polymerization of hybrid peptides and polymers... Modular bioink for 3D printing
Although, compared to saliva, lung microbiota had higher variance, all lung samples showed significantly higher phylogenetic diversity and higher number of ob- served OTUs
PubMed Abstract | Publisher Full Text | Free Full Text | Faculty Opinions
pour les ré-analyses NCEP, en noir pour la simulation CTRL. a) pour l'océan et l'atmosphère globaux. b) transport océanique pour l'Atlantique avec repré- sentation des
Nous montrons ici que dans un contexte où les ressources pour la simplification sont rares, il reste néanmoins possible de construire des systèmes de simplification, en ayant recours
Il s'agit de cylindres qui ne sont pas planes à génératrices isotropes (alors que dans l'espace Euclidien tout cylindre minimale est un morceau de plan), et d'autres
L'article 1 a deux petites soies dont une pennée distalement; le deuxième offre une à deux soies simples et quatre pennées, dont celle située sur l'apophyse
Si nous considérons les différentes espèces d'Ecteinascidia décrites nous constatons que la forme des siphons est très variable : Ils peuvent être non lobés
