HAL Id: hal-00295770
https://hal.archives-ouvertes.fr/hal-00295770
Submitted on 2 Nov 2005
HAL is a multi-disciplinary open access
archive for the deposit and dissemination of
sci-entific research documents, whether they are
pub-lished or not. The documents may come from
teaching and research institutions in France or
abroad, or from public or private research centers.
L’archive ouverte pluridisciplinaire HAL, est
destinée au dépôt et à la diffusion de documents
scientifiques de niveau recherche, publiés ou non,
émanant des établissements d’enseignement et de
recherche français ou étrangers, des laboratoires
publics ou privés.
Organic, elemental and inorganic carbon in particulate
matter of six urban environments in Europe
M. Sillanpää, A. Frey, R. Hillamo, A. S. Pennanen, R. O. Salonen
To cite this version:
M. Sillanpää, A. Frey, R. Hillamo, A. S. Pennanen, R. O. Salonen. Organic, elemental and inorganic
carbon in particulate matter of six urban environments in Europe. Atmospheric Chemistry and
Physics, European Geosciences Union, 2005, 5 (11), pp.2869-2879. �hal-00295770�
www.atmos-chem-phys.org/acp/5/2869/ SRef-ID: 1680-7324/acp/2005-5-2869 European Geosciences Union
Chemistry
and Physics
Organic, elemental and inorganic carbon in particulate matter of six
urban environments in Europe
M. Sillanp¨a¨a1, A. Frey1, R. Hillamo1, A. S. Pennanen2, and R. O. Salonen2
1Finnish Meteorological Institute, Air Quality Research, Erik Palm´enin aukio 1, FIN-00560 Helsinki, Finland
2National Public Health Institute, Department of Environmental Health, Neulaniementie 4, FIN-70210 Kuopio, Finland
Received: 17 February 2005 – Published in Atmos. Chem. Phys. Discuss.: 3 May 2005 Revised: 14 September 2005 – Accepted: 19 October 2005 – Published: 2 November 2005
Abstract. A series of 7-week sampling campaigns were
con-ducted in urban background sites of six European cities as follows: Duisburg (autumn), Prague (winter), Amsterdam (winter), Helsinki (spring), Barcelona (spring) and Athens (summer). The campaigns were scheduled to include sea-sons of local public health concern due to high particulate concentrations or findings in previously conducted epidemi-ological studies. Aerosol samples were collected in paral-lel with two identical virtual impactors that divide air
par-ticles into fine (PM2.5)and coarse (PM2.5−10)size ranges.
From the collected filter samples, elemental (EC) and or-ganic (OC) carbon contents were analysed with a thermal-optical carbon analyser (TOA); total Ca, Ti, Fe, Si, Al and K by energy dispersive X-ray fluorescence (ED-XRF); As, Cu, Ni, V, and Zn by inductively coupled plasma mass
spectrometry (ICP/MS); Ca2+, succinate, malonate and
ox-alate by ion chromatography (IC); and the sum of
levoglu-cosan+galactosan+mannosan (PMA) by liquid
chromatog-raphy mass spectrometry (LC/MS). The campaign means
of PM2.5 and PM2.5−10 were 8.3–29.6 µg m−3 and 5.4–
28.7 µg m−3, respectively. The contribution of particulate
or-ganic matter (POM) to PM2.5ranged from 21% in Barcelona
to 54% in Prague, while that to PM2.5−10ranged from 10%
in Barcelona to 27% in Prague. The contribution of EC
was higher to PM2.5 (5–9%) than to PM2.5−10 (1–6%) in
all the six campaigns. Carbonate (C(CO3), that interferes
with the TOA analysis, was detected in PM2.5−10of Athens
and Barcelona but not elsewhere. It was subtracted from the OC by a simple integration method that was validated. The
CaCO3accounted for 55% and 11% of PM2.5−10in Athens
and Barcelona, respectively. It was anticipated that combus-tion emissions from vehicle engines affected the POM
con-Correspondence to: M. Sillanp¨a¨a
(markus.sillanpaa@fmi.fi)
tent in PM2.5 of all the six sampling campaigns, but a
com-parison of mass concentration ratios of the selected inorganic and organic tracers of common sources of organic material to POM suggested also interesting differences in source dom-inance during the campaign periods: Prague (biomass and coal combustion), Barcelona (fuel oil combustion, secondary photochemical organics) and Athens (secondary photochem-ical organics). The on-going toxicologphotochem-ical studies will clarify the health significance of these findings.
1 Introduction
Urban aerosol is a complex mixture of primary particulate emissions (from industry, transportation, power generation and natural sources) and secondary material formed by gas-to-particle conversion mechanisms. Urban aerosol contains a substantial amount of carbonaceous material (20–80%; Rogge et al., 1993 and Nunes and Pio, 1993) that is com-posed of two main fractions: 1) elemental carbon (EC; some-times referred to as black carbon or graphitic carbon) is a pri-mary pollutant formed in combustion processes, and 2) par-ticulate organic matter (POM) is a complex mixture of dif-ferent groups of compounds originating from a large variety of processes (Seinfeld and Pandis, 1998).
Recent epidemiological studies have shown consistent as-sociations of mass concentration of urban air thoracic
parti-cles (PM10 – 50% cutoff point at 10 µm), and its
subfrac-tion fine particles (PM2.5 – 50% cutoff point at 2.5 µm),
with mortality and morbidity among cardiorespiratory pa-tients (WHO, 2003). There are still relatively few epidemio-logical studies with detailed chemical speciation of the col-lected particulate samples, but one recent US time-series study (Metzger et al., 2004) has reported that the EC and
2870 M. Sillanp¨a¨a et al.: Organic, elemental and inorganic carbon
POM concentrations in PM2.5 were significantly associated
with emergency department visits in hospitals due to cardio-vascular diseases. It is known on the basis of experimental studies that the EC causes tissue irritation and a release of toxic chemical intermediates from scavenger cells in labo-ratory studies as well as acts as a carrier of various organic compounds. Moreover, volatile and semi-volatile organic, particulate-bound compounds can act as irritants and aller-gens. Many aromatic compounds are suspected mutagens and carcinogens and some them may also cause acute health effects (Lighty et al., 2000).
In this study, we report the mass concentrations of fine
(PM2.5)and coarse (PM2.5−10)particles as well as their EC
and POM contents from six geographically and seasonally contrasting particulate sampling campaigns in Europe. The campaigns were scheduled to include seasons of local pub-lic health concern due to high particulate concentrations or findings in previously conducted epidemiological studies. A specific objective of our work was to characterise the dif-ferences in concentration patterns as well as sources of the EC and POM between the sampling campaigns. Moreover, a new integration method was validated for subtraction of
carbonate (C(CO3)) from the thermograms of the
thermal-optical carbon analysis.
2 Experimental methods
2.1 Sampling sites
A series of 7-week sampling campaigns were conducted in six European cities. The sampling sites were located in urban background areas and were influenced by a variable contri-bution of traffic depending on the density of short-haul motor vehicles and the site topography. The sites are described in detail including the additional local emission sources of par-ticles:
Duisburg (51◦260N, 6◦450E). The sampling site was lo-cated near the city centre at a distance of 280 m from the nearest major street. The site was surrounded by three to five-storey buildings. The major local emission sources were road traffic (e.g. diesel trucks) and metal industry. The sam-pling campaign was conducted between 4 October and 21 November 2002 (autumn) when the mean±SD ambient
tem-perature and total precipitation were 9±3◦C and 90 mm.
Prague (50◦50N, 14◦260E). The sampling site was located in an open field of the Czech Hydrometeorological Institute in an uptown residential area. The nearest road at a distance of 150 m had a relatively low average traffic density of 5000 vehicles/day, while the nearest major road was at a distance of 1 km. Road traffic, domestic heating with solid fuels and energy production were considered as the main local emis-sion sources. The particulate samplings were carried out be-tween 29 November 2002 and 16 January 2003 (winter) with
prevailing ambient temperature of −2±5◦C and total
precip-itation of 50 mm.
Amsterdam (52◦210N, 4◦540E). The site was located near the city centre at a distance of 50 m from the nearest major street with an average traffic volume of 10 000 vehicles/day. The site was surrounded by multi-storey buildings. Road and ship traffic were considered as the main local emission sources. The sampling campaign was conducted between 24 January and 13 March 2003 (winter) when the ambient
tem-perature and total precipitation were 4±4◦C and 60 mm.
Helsinki (60◦100N, 24◦580E). The site was located near the city centre at a distance of 300 m from the nearest major street with an average traffic volume of 30 700 vehicles/day. The site had multi-storey buildings on one side but faced an open sports field on the other side. Road traffic and ships in the city harbour were considered as the main local emission sources. The particulate samplings were carried out between 21 March and 12 May 2003 (spring) with prevailing ambient
temperature of 4±5◦C and total precipitation of 48 mm.
Barcelona (41◦230N, 2◦90E). The site was located on a car park near the city centre. The nearest major road at a distance of 100 m had an average traffic density of 17 000 vehicles/day. On one side, there was a multi-storey building and the canopy of a railway station whilst on the other side there was a park enclosing a zoo. Road traffic and ships in the large harbour, and to some extent the zoo, were considered as the main local emission sources. The sampling campaign was conducted between 28 March and 19 May 2003 (spring) when the ambient temperature and total precipitation were
15±2◦C and 10 mm.
Athens (37◦580N, 23◦430E). The site was located near the city centre at a distance of 100 m from the nearest major road with an average traffic density of 30 000 vehicles/day. The site was spaciously enclosed by three- or four-storey build-ings. Road traffic, and to some extent construction work, were considered as the main local emission sources. The particulate samplings were carried out between 2 June and 21 July 2003 (summer) with prevailing ambient temperature
of 29±4◦C and total precipitation of 0 mm.
The sampling duration was 3+4 days per week, with filter exchange usually on Mondays and Thursdays between 10:00 and 12:00 a.m. The general protocol of the PAMCHAR field campaign necessitated to choose these relatively long sam-plings due to a parallel sampling of large, size-fractionated particulate samples for toxicological cell and animal stud-ies, using a high-volume cascade impactor (Sillanp¨a¨a et al., 2003). The total number of particulate samplings was 14 in each city. An automatic valve, that was programmed to switch on and off in cycles of 15 min, was installed into the pump line of virtual impactors (VI) in Barcelona and Athens to avoid overloading of the filters.
2.2 Aerosol sampling instruments
The aerosol particulate samples were collected in parallel with two VIs that divide the particulate matter into two size
ranges: PM2.5 and PM2.5−10 (Loo and Cork, 1988). The
total sampling flow rates of the VIs were 16.7 l min−1 and
the upper cut-off of the coarse particles was made with a
low volume PM10-inlet similar to the design of Liu and Pui
(1981). The particles were collected on polytetrafluoroethy-lene (PTFE) filters (diameter 47 mm, pore size 3 µm, type FS, Millipore, Ireland) for gravimetric and chemical analy-sis, and on preheated quartz fibre filters (Pallflex Tissuquartz 2500QAT-UP) for carbon analysis. In the latter VI, a tan-dem filter collection method (two quartz fibre filters from the same lot in series) was applied for estimation and correction of positive sampling artefacts, i.e. an adsorption of organic gases. In practice, the OC value of backup filter was sub-tracted from that of front filter. The positive artefact correc-tion has been performed to all the POM results presented in this study.
2.3 Gravimetric and chemical analysis
After sampling, the filters were placed on petrislides and those containing the quartz fibre filters were wrapped inside aluminium foil. All the samples were frozen and sent via ex-press delivery service to the central laboratory of the project at the Finnish Meteorological Institute for gravimetric mea-surements and chemical analysis.
The PTFE filters were weighed with the same Mettler M3-microbalance (Mettler Instrumente AG, Zurich, Switzerland) before and after sampling. The samples were allowed to stabilize in the weighing room for 15–60 min before weigh-ing, which was shown in separate experiments to be suffi-cient for both clean and loaded PTFE filters. A criterion for valid weighing was that duplicate mass readings were within 2 µg from each other. The mean±SD relative humid-ity (RH) and temperature in the weighing room were 22±7%
and 23±2◦C, respectively, with the exception of RH being
49±8% during weighing the Barcelona and Athens samples. Regardless of different RH, the deliquescence points of the abundant inorganic atmospheric salts were reached neither at 22% nor at 49% (Seinfeld and Pandis, 1998), because the filter samples (stored as frozen) were first melted on closed petrislides and subsequently stabilized at the prevailing con-dition of the weighing room. The scale and reading of the microbalance were checked daily with internal and standard weights. The electrostatic charges of filters were eliminated with a Po-210 radioactive source.
The quartz fibre filters were analysed using a thermal-optical carbon analyser (TOA; Sunset Laboratory Inc., Ore-gon). This analysis proceeded in two phases. In the first phase, the OC and carbonate carbon were volatilized in pure helium atmosphere at four temperature steps. During the sec-ond phase of the analysis, the carbon remaining on the filter
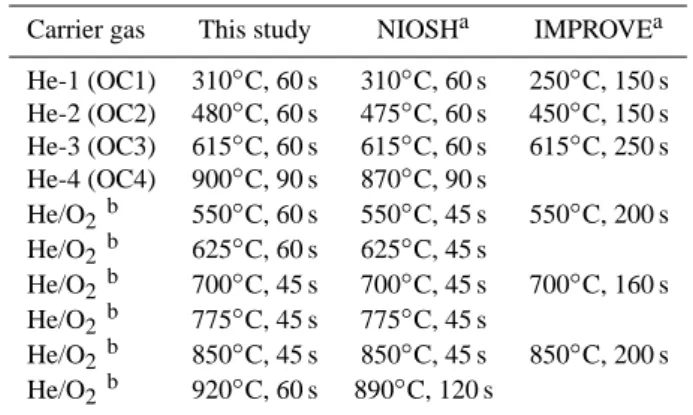
Table 1. Experimental parameters of the thermal-optical carbon
analysis (TOA) method used in this study and those of two well-known methods (NIOSH and IMPROVE).
Carrier gas This study NIOSHa IMPROVEa He-1 (OC1) 310◦C, 60 s 310◦C, 60 s 250◦C, 150 s He-2 (OC2) 480◦C, 60 s 475◦C, 60 s 450◦C, 150 s He-3 (OC3) 615◦C, 60 s 615◦C, 60 s 615◦C, 250 s He-4 (OC4) 900◦C, 90 s 870◦C, 90 s He/O2b 550◦C, 60 s 550◦C, 45 s 550◦C, 200 s He/O2b 625◦C, 60 s 625◦C, 45 s He/O2b 700◦C, 45 s 700◦C, 45 s 700◦C, 160 s He/O2b 775◦C, 45 s 775◦C, 45 s He/O2b 850◦C, 45 s 850◦C, 45 s 850◦C, 200 s He/O2b 920◦C, 60 s 890◦C, 120 s aSciare et al. (2003)
bA mixture of 2% oxygen in helium.
was heated in a mixture of oxygen and helium (1:49, V-%) by using six temperature steps. The temperature program used in this study followed the well-known NIOSH program with minor modifications (Table 1). A part of the OC pyrolysed into compounds resembling the EC during heating. An op-tical correction, i.e. a measurement of the transmittance of laser light through the filter, was applied for a separation of the pyrolysed OC from the EC that was determined as the fraction of carbon that comes out after the transmittance has reached its initial value. The POM is obtained by summing up the OC peaks and pyrolysed OC, and multiplying the sum by a factor of 1.4 (Turpin et al., 2000 and Russell, 2003). An analogous method has been described in detail by Viidanoja et al. (2002).
The carbonaceous material was divided into six thermal
fractions labelled as follows: OC1 (310◦C), OC2 (480◦C),
OC3 (615◦C), OC4 (900◦C), OCP (pyrolysed OC) and EC
(sum of EC thermal fractions). C(CO3)refers to the
carbon-ate carbon.
The PTFE filters were analysed by energy dispersive x-ray fluorescence (ED-XRF) for their total Ca content;
by ion chromatography (IC) for water-soluble Ca2+,
suc-cinate, malonate and oxalate; by liquid chromatography mass spectrometry (LC/MS) for monosaccharide anhydrides (PMA=levoglucosan+galactosan+mannosan) and by
induc-tively coupled plasma mass spectrometry (ICP-MS) for As, Cu, Ni, V and Zn. The techniques and their methodological uncertainties have been described elsewhere by Sillanp¨a¨a et al. (2005).
The CaCO3concentrations were converted from those of
CO2−3 and Ca, analysed by the TOA and ED-XRF,
respec-tively, using the following equations:
[CaCO3]TOA=
M(CaCO3)
M(C(CO3))
2872 M. Sillanp¨a¨a et al.: Organic, elemental and inorganic carbon PM2.5 Athens Barcelona Helsinki Amsterdam Prague Duisburg PM2.5-10 Concentration (µg m-3) 0 10 20 30 40 50 60 Athens Barcelona Helsinki Amsterdam Prague Duisburg Min Max Percentiles Mean Median Figure 1. 1
Fig. 1. The arithmetic mean, median and range as well as the 10th,
25th, 75th and 90th percentile values of the mass concentrations of fine (PM2.5)and coarse (PM2.5−10)particulate matter in the six sampling campaigns.
[CaCO3]XRF=
M(CaCO3)
M(Ca) [Ca]=2.497 × [Ca], (2)
where [C(CO3)] and [Ca] are the mass concentration of
car-bonate carbon and calcium. The area of the C(CO3)peak in
TOA thermograms was manually integrated with the integral
start at 210–225 s and end at 250–275 s. The C(CO3)peak
was initially localised by comparing the analysis results of the original Athens sample to its duplicate that was decar-bonated in HCl fumes as described by Cachier et al. (1989).
2.4 Tracers for assessment of POM sources in PM2.5
An assessment of five common sources of the fine partic-ulate OC content was based on the mass concentration ra-tio of selected inorganic and organic tracers to POM. The EC is directly emitted from combustion of fossil fuels or/and biomass. It is often regarded as a tracer of local traffic (Song et al, 2001). Several studies have associated Cu and Zn emis-sions with traffic and metal industries (Pakkanen et al., 2001; Heal et al., 2005; Lim et al., 2005; Song et al., 2001). In the absence of a strong metal industry influence, As can be used as a tracer of coal combustion (NAEI, 2003), and Ni and V as tracers of fuel oil combustion (Song et al., 2001; Kavouras et al., 2001). The sum of three monosaccharide anhydrides (PMA; mainly levoglucosan) is known as a good tracer of
incomplete biomass combustion (Simoneit et al., 1999; Sil-lanp¨a¨a et al., 2005). The small dicarboxylic acids (DA; sum of oxalate, malonate and succinate) are mostly produced in photochemical reactions of anthropogenic organic pollutants in the urban atmosphere (Kawamura and Ikushima, 1993) but they can be also primary emissions from motor vehicle en-gines (Yao et al., 2004). Here the ratio of DA to POM was used as an indicator of secondary organic compounds.
3 Results and discussion
3.1 PM2.5and PM2.5−10mass concentrations
The mass concentrations of PM2.5 and PM2.5−10during the
7-week campaigns in the six European cities are shown in Fig. 1. The arithmetic mean concentrations were 14.7 and
7.2 µg m−3 in Duisburg, 29.6 and 5.4 µg m−3 in Prague,
25.4 and 8.4 µg m−3 in Amsterdam, 8.3 and 12.8 µg m−3
in Helsinki, 20.0 and 26.3 µg m−3 in Barcelona, and 25.3
and 28.7 µg m−3in Athens, respectively. The highest mean
PM2.5 concentration was measured in Prague during
win-ter and the highest mean PM2.5−10concentration was
mea-sured in Athens during summer, whereas the corresponding lowest values were in Helsinki during spring and in Prague
during winter. For comparison (data from local
authori-ties), the annual mean PM2.5 and PM2.5−10 mass
concen-trations in 2001 were, respectively, as follows: 23.0 and
6.8 µg m−3in Duisburg, 7.8 and 7.9 µg m−3in Helsinki, and
28.0 and 13.0 µg m−3in Barcelona. These two size fractions
were not measured in the other three cities but the annual
mean PM10 mass concentrations in 2001 were 24.5 µg m−3
in Prague, 28.9 µg m−3 in Amsterdam and 55.5 µg m−3
in Athens. Our sampling campaign means were clearly
higher than the corresponding annual means for
Prague-PM10 (43%), Amsterdam-PM10 (17%), Helsinki-PM2.5−10
(62%) and Barcelona-PM2.5−10 (100%), suggesting special
source-related, episodic or seasonal impacts during the cam-paigns in these cities. Marginal difference with the historical
annual mean value was found for Duisburg-PM2.5−10(5.9%),
Helsinki-PM2.5 (6.4%) and Athens-PM10 (−2.7%), but our
campaign means were clearly lower than the annual means
of 2001 for Duisburg-PM2.5 (−36%) and Barcelona-PM2.5
(−29%).
The mean PM2.5−10to PM2.5 ratios were clearly lower in
Duisburg (0.58), Prague (0.20) and Amsterdam (0.54) than in Helsinki (1.57), Barcelona (1.36) and Athens (1.14). The dif-ferences were most likely due to factors related to the season, local emission sources and geographical location. The first three sampling campaigns were carried out during the ‘wet’
and cool seasons favouring a low PM2.5−10 concentration
(due to low resuspension) and a high PM2.5 concentration
(additional local and regional energy production for heating). The sampling campaigns in Barcelona and Athens were con-ducted during warmer and drier seasons leading to a lower
PM2.5concentration (semivolatiles in gas phase) and a high
PM2.5−10concentration (resuspension). Road dust episodes,
typical phenomena of springtime in Northern Europe, were
the reason for elevated PM2.5−10in Helsinki (Kukkonen et
al., 1999). More detailed data on the particulate mass con-centrations, meteorology and air quality during the sampling campaigns will be reported elsewhere.
3.2 Mass concentrations of EC and POM in six cities
The POM and EC mass concentrations in PM2.5 and
PM2.5−10of the six sampling campaigns are shown in Fig. 2.
The arithmetic mean POM concentrations in PM2.5 varied
profoundly between 3.8 µg m−3in Helsinki and 15.7 µg m−3
in Prague, while the corresponding EC concentrations
var-ied much less, i.e. between 0.68 µg m−3 in Helsinki and
1.6 µg m−3 in Athens. The mean POM (corrected for
C(CO3), see Sect. 3.3.1) and EC mass concentrations in
PM2.5−10 varied in the range of 1.2–5.0 µg m−3 and 0.18–
0.28 µg m−3, respectively. The lowest mean POM and EC
in PM2.5−10were observed in Amsterdam, while the
corre-sponding highest concentrations were in Athens. The mean
OC concentrations in PM2.5and PM2.5−10of the backup
fil-ters varied in the range of 0.32–1.31 and 0.12–0.33 µg m−3,
corresponding to 5.7–19% and 5.8–14% of the OC on the front filters, respectively. The EC contributions were about one tenth of those of the OC, which was also anticipated be-cause of the nonvolatile nature of elemental carbon.
In this study, the POM in both the PM2.5 and PM2.5−10
was obtained with multiplication of the OC concentration by a factor of 1.4 in each city. This adjustment was made to include a contribution of other elements than the carbona-ceous material (OC) of organic compounds to POM (Turpin et al., 2000 and Russell, 2003). The use of this conversion factor should be regarded as a rough means to compensate the limitations of present analytical instruments (e.g. FTIR spectroscopy or GC/MS).
Querol et al. (2004) has reported in their European multi-centre study that the annual mean mass concentration of total
carbon (TC; sum of OC and EC) in PM2.5varied in the range
of 2–8 µg m−3 at urban background sites. Our
campaign-mean TC concentrations in PM2.5 fell into this range in all
other campaigns than Prague (12.6 µg m−3). In the study
of Querol et al. (2004), the annual mean TC mass
concen-trations in PM2.5−10were in the range of 0–1 µg m−3. Our
campaign-mean TCs were between 1.0 and 1.9 µg m−3,
ex-cept for the high value of 3.9 µg m−3in Athens.
The relative contributions of carbonaceous material to
PM2.5 and PM2.5−10 are shown in Table 2. The POM
contributions to PM2.5 were very high, ranging from 21%
in Barcelona to 54% in Prague, while those to PM2.5−10
were generally lower, i.e. from 10% in Barcelona to 27% in
Prague. As expected, the EC contributions to PM2.5(5–9%)
were higher than those to PM2.5−10(1–6%) in all the six
cam-paigns. Putaud et al. (2004) have made a meta-analysis of the annual mean black carbon (BC) and POM contributions based on measurements at urban background sites of eight
European cities. The mean BC contributions to PM2.5 and
PM2.5−10were 8% and 3%, respectively, which agrees well
with our present results. In contrast, their annual mean POM
contributions to PM2.5and PM2.5−10were only 22% and 8%,
i.e. values similar to our smallest campaign-means and about one-third to one-half of our largest campaign-means.
De-Athens Barcelona Helsinki Amsterdam Prague Duisburg Concentration (µg m-3) 0 10 20 30 Athens Barcelona Helsinki Amsterdam Prague Duisburg Concentration (µg m-3) 0 1 2 3 4 POM PM 2. 5 PM 2.5 -10 EC Min Max Percentiles Mean Median Figure 2. 1
Fig. 2. The arithmetic mean, median and range as well as the 10th,
25th, 75th and 90th percentile values of the particulate organic mat-ter (POM) and elemental carbon (EC) concentrations in PM2.5and
PM2.5−10of the six sampling campaigns.
spite the differences in sample collection and analysis tech-niques between our study and the other European studies, this finding suggests that the selected campaign periods of public health concern in several cities (e.g., Prague, Athens, Helsinki) were associated with a relatively high POM con-tent.
It is worthwhile noting that the EC and OC results are de-pendent on the method used in the thermal-optical carbon analysis. Chow et al. (2001) have shown that the NIOSH and IMPROVE methods (Table 1) are equivalent for total carbon but the EC of NIOSH (usually a smaller fraction of TC) is typically less than half of the value of the EC of IMPROVE. A reasonable estimate for the EC probably lies somewhere between the values given by these two methods (Sciare et al., 2003). We used a slightly modified NIOSH method (see Table 1) and, therefore, the EC concentrations may be somewhat underestimated and the OC concentrations slightly overestimated in the present study.
The mean PM2.5−10to PM2.5 ratio of the EC ranged
be-tween 0.17 and 0.29. These low ratios indicate that the EC
existed mainly in PM2.5, which has been observed in many
European urban environments (Viidanoja et al., 2002; Salma
et al., 2004). The mean PM2.5−10 to PM2.5 ratio of POM
had a much larger range than that of the EC, being 0.094 for Prague, 0.24 for Amsterdam, 0.45 for Duisburg, 0.50 for Helsinki, 0.56 for Barcelona and 0.59 for Athens. The ratios were lower for sampling campaigns with a lower mean am-bient temperature and a higher precipitation (see Sect. 2.1).
3.3 Assessment of POM and EC sources in PM2.5
The Pearson correlation coefficients between the total mass
concentration, POM and EC in PM2.5 and PM2.5−10 are
2874 M. Sillanp¨a¨a et al.: Organic, elemental and inorganic carbon
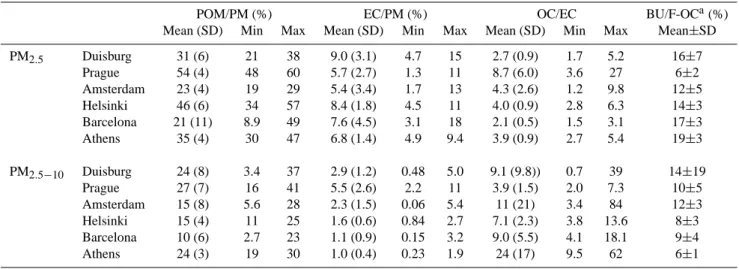
Table 2. The relative contribution (%) of particulate organic matter (POM) and elemental carbon (EC) to the total mass (PM) in PM2.5and
PM2.5−10as well as the ratio of organic carbon (OC) to EC in the six sampling campaigns.
POM/PM (%) EC/PM (%) OC/EC BU/F-OCa(%) Mean (SD) Min Max Mean (SD) Min Max Mean (SD) Min Max Mean±SD PM2.5 Duisburg 31 (6) 21 38 9.0 (3.1) 4.7 15 2.7 (0.9) 1.7 5.2 16±7 Prague 54 (4) 48 60 5.7 (2.7) 1.3 11 8.7 (6.0) 3.6 27 6±2 Amsterdam 23 (4) 19 29 5.4 (3.4) 1.7 13 4.3 (2.6) 1.2 9.8 12±5 Helsinki 46 (6) 34 57 8.4 (1.8) 4.5 11 4.0 (0.9) 2.8 6.3 14±3 Barcelona 21 (11) 8.9 49 7.6 (4.5) 3.1 18 2.1 (0.5) 1.5 3.1 17±3 Athens 35 (4) 30 47 6.8 (1.4) 4.9 9.4 3.9 (0.9) 2.7 5.4 19±3 PM2.5−10 Duisburg 24 (8) 3.4 37 2.9 (1.2) 0.48 5.0 9.1 (9.8)) 0.7 39 14±19 Prague 27 (7) 16 41 5.5 (2.6) 2.2 11 3.9 (1.5) 2.0 7.3 10±5 Amsterdam 15 (8) 5.6 28 2.3 (1.5) 0.06 5.4 11 (21) 3.4 84 12±3 Helsinki 15 (4) 11 25 1.6 (0.6) 0.84 2.7 7.1 (2.3) 3.8 13.6 8±3 Barcelona 10 (6) 2.7 23 1.1 (0.9) 0.15 3.2 9.0 (5.5) 4.1 18.1 9±4 Athens 24 (3) 19 30 1.0 (0.4) 0.23 1.9 24 (17) 9.5 62 6±1
aBU/F-OC is the ratio of OC on backup filter to OC on front filter.
Table 3. The Pearson correlation coefficients (r) between the total particulate mass, POM, and EC in PM2.5and PM2.5−10.
Duisburg Prague Amsterdam Helsinki Barcelona Athens PM2.5vs. PM2.5−10 0.280 0.554 −0.128 0.584 0.295 0.717 EC2.5vs. EC2.5−10 0.524 0.379 0.875 0.810 0.884 0.348 POM2.5vs. POM2.5−10 0.542 0.661 0.897 0.498 0.824 0.800 PM2.5vs. EC2.5 0.553 0.360 0.664 0.722 0.341 0.405 PM2.5vs. POM2.5 0.844 0.987 0.959 0.897 0.567 0.860 EC2.5vs. POM2.5 0.672 0.436 0.762 0.790 0.945 0.517 PM2.5−10vs. EC2.5−10 0.352 0.822 0.208 0.696 −0.087 0.470 PM2.5−10vs. POM2.5−10 0.651 0.935 0.263 0.904 −0.073 0.831 EC2.5−10vs. POM2.5−10 0.198 0.828 0.926 0.813 0.870 0.659
High correlations (r≥0.80) bolded.
correlation (r=0.84–0.99) with the PM2.5concentration in all
cities except for Barcelona (r=0.57) where the POM had the
smallest contribution to PM2.5. However, the POM and EC
in PM2.5 of Barcelona were highly intercorrelated (r=0.95),
which together with the lowest OC to EC ratio (see next para-graph) suggests that they had a common dominant source dif-ferent from the other cities, e.g. fuel oil combustion in numer-ous ship engines at the large harbour. The fine EC concen-tration had a relatively low correlation (r=0.34–0.72) with
the PM2.5 concentration in all the six campaigns, but it
cor-related highly (r=0.81–0.88) with the coarse EC in Amster-dam, Helsinki and Barcelona, suggesting impacts from local
combustion sources not only to PM2.5but also to PM2.5−10.
Only in the winter campaign of Prague, the coarse EC
con-centration had a high correlation (r=0.82) with the PM2.5−10
concentration, which refers to local incomplete combustion processes such as residential heating with solid fuels. The
coarse POM concentration correlated highly (r=0.83–0.94)
with the PM2.5−10 concentration in Prague, Helsinki and
Athens, which reflects its highly variable anthropogenic and natural sources in different urban environments and seasons (Table 3).
The OC to EC ratios in PM2.5 were in the range of 2.1–
4.3 in Barcelona, Duisburg, Athens, Helsinki and Amster-dam, but it was much higher (8.7) in Prague (Table 2). Na et al. (2004) have reviewed some of the reported OC to EC ratios in relation to a variety of combustion sources. A low OC to EC ratio has been associated with traffic sources (2.2 and 0.8 for light-duty gasoline and heavy-duty diesel vehi-cles, respectively), whereas residential heating (wood com-bustion 4.15 and natural gas home appliance 12.7), forest fire (14.5) and dust from paved roads (13.1) have shown remark-ably higher ratios.
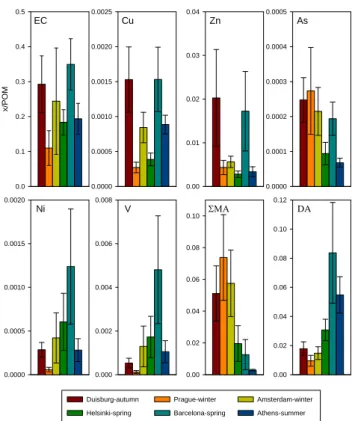
Figure 3 shows the mass concentration ratios in PM2.5 of
the selected inorganic and organic tracers (see Sect. 2.4.) of five common sources of organic material to POM.
Traffic. Road traffic has certainly a substantial impact on
the POM concentration in PM2.5 of all the six urban
back-ground sites. As assessed from the ratio of EC, Cu and Zn to POM, its relative impact was largest in Barcelona and Duis-burg, and smallest in Prague (Fig. 3). However, the high ra-tios of Cu and Zn to POM in Duisburg were likely to be at least partially due to emissions from the large metal indus-tries in the Ruhr area.
Coal combustion. According to the As to POM ratio in
PM2.5, the contribution of coal combustion emissions was
higher in Prague, Duisburg, Amsterdam and Barcelona than in Helsinki and Athens (Fig. 3). The first three cities had sampling campaigns during the cold and wet seasons, which means that their findings can be explained by increased local and regional residential heating, and larger-scale energy pro-duction, with coal. In Barcelona, the impact may be derived from the emissions from coal plants located nearby the city (Rodr´ıguez et al., 2002).
Fuel oil combustion. As assessed from the ratios of Ni
and V to POM, the contribution of fuel oil combustion was clearly highest in Barcelona followed by Helsinki, Amster-dam and Athens (Fig. 3). Ships in the harbours of these cities can be regarded as the major source, because it seemed to have a low impact in the inland cities of Duisburg and Prague. The large metal industries in the Ruhr area probably
elevated the Ni contribution to PM2.5 of Duisburg to some
extent, but the V contribution remained low. The ratio of Ni
to V in PM2.5is expected to be around 0.38 in relation to
im-pact from fuel oil combustion (Kavouras et al., 2001), which was close in all other cities (0.27–0.45) than Duisburg (0.57) (Fig. 3).
Biomass combustion. According to the PMA to POM
ratio, the contribution of biomass combustion was clearly higher in Prague, Amsterdam and Duisburg than in Helsinki, Barcelona and Athens (Fig. 3). The differences can be ex-plained by an impact from local or regional residential heat-ing, since the three former campaigns were carried out dur-ing the cold and wet seasons. In Prague, the very high mass
concentration of POM in PM2.5(Fig. 2) as well as the above
described high correlations of both the coarse EC and POM
with the PM2.5−10concentration (Table 3) suggest a larger
contribution from local biomass combustion than in Amster-dam and Duisburg.
Secondary POM. The DA to POM ratios in the
spring-time and summerspring-time campaigns of Helsinki, Barcelona and Athens were 2–9 times higher than those in the autumn and winter campaigns of Duisburg, Prague and Amsterdam (Fig. 3). The likely reason for this difference is enhanced photochemical oxidation of organic compounds in the spring and summer (Kamamura and Ikushima, 1993).
As 0.0000 0.0001 0.0002 0.0003 0.0004 0.0005 V 0.000 0.002 0.004 0.006 0.008 Cu x/POM 0.0000 0.0005 0.0010 0.0015 0.0020 0.0025 Zn 0.00 0.01 0.02 0.03 0.04 ΣΜΑ 0.00 0.02 0.04 0.06 0.08 0.10 DA 0.00 0.02 0.04 0.06 0.08 0.10 0.12 EC x/POM 0.0 0.1 0.2 0.3 0.4 0.5
Duisburg-autumn Prague-winter Amsterdam-winter Helsinki-spring Barcelona-spring Athens-summer
Ni 0.0000 0.0005 0.0010 0.0015 0.0020 Figure 3.
Fig. 3. The mass concentration ratios of the selected tracers of
com-mon emission sources of organic material to POM in PM2.5. The
values are means ± SD of 14 samples collected during a 7-week sampling campaign in each city. See text for further explanation.
3.4 Analysis of thermal fractions
3.4.1 Carbonate in atmospheric particles
The carbonate-carbon (C(CO3))can interfere with the TOA
analysis during the OC4 step (Fig. 4) and cause a positive artefact to the OC concentration (Sciare et al., 2003). In
this study, C(CO3)could be quantified in the PM2.5−10
sam-ples of Barcelona and Athens, but it was not detected either
in the PM2.5−10 samples of the other four cities or in the
PM2.5samples of any city. The mean C(CO3)to OC ratio in
PM2.5−10was 0.17 in Barcelona and 0.53 in Athens, which
indicates that the OC (and subsequently POM) concentration in certain situations can be grossly overestimated without a
subtraction of the C(CO3). We subtracted the C(CO3)
con-centration from the OC4 and total OC concon-centration before conversion of the OC results to POM shown in Sect. 3.2.
A time-series of the CaCO3concentration in the PM2.5−10
samples from Athens and Barcelona is shown in Fig. 5. The campaign mean (range), based on Eq. (1), was 15.9 (9.8–
29.2) µg m−3 for Athens, whereas the corresponding value
for Barcelona was 2.6 (0.3–6.3) µg m−3. These
concentra-tions accounted for 55(±8)% and 11(±9)% of the PM2.5−10
concentration in Athens and Barcelona, respectively. There was a high linear correlation (r = 0.91) and the slope close
2876 M. Sillanp¨a¨a et al.: Organic, elemental and inorganic carbon Time (sec) 0 100 200 300 400 500 600 700 FID signal 0 1000 2000 3000 4000 5000 6000 T emperat u re (C) 0 200 400 600 800 1000 FID1 temperature laser OC4 OC3 OC2 OC1 He 2% O2/He carbonate OCP EC
Figure 4. Fig. 4. Example of the temperature program in the thermal-optical
carbon analysis (TOA) and a manually integrated carbonate C(CO3)
peak in the present study (PM2.5−10sample #14 from Athens). See
text and Table 1 for other explanations.
to unity between the [CaCO3]TOAand [CaCO3]XRF
concen-trations (based on Eqs. (1) and (2)) in Athens, and a sig-nificant trend in Barcelona (Pearson’s r=0.61) although the
molar equivalent concentration of CO2−3 was lower than that
of Ca (Fig. 5). This indicates that the coarse Ca appeared
exclusively as CaCO3 in Athens, whereas the coarse Ca in
Barcelona existed partly in other forms (e.g. as oxide). A similar conclusion has been drawn by Bardouki et al. (2003) who discovered in ion balance calculation that the coarse Ca
was strongly associated with C(CO3)(a molar ratio close to
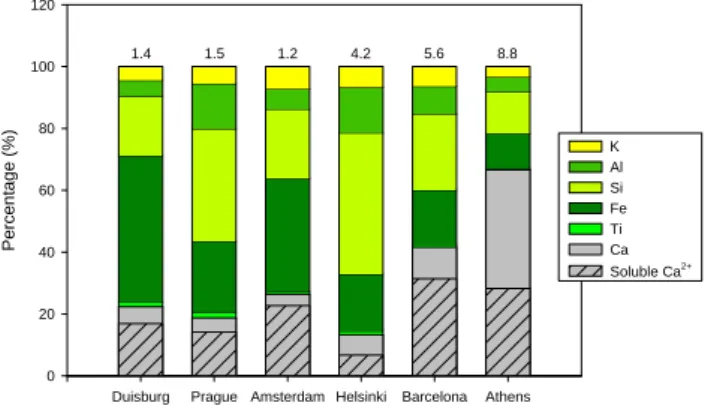
1) during summertime in the Eastern Mediterranean. Figure 6 shows the portion of crustal elements in the soil-derived coarse particles of the six sampling campaigns.
These data further support the view of CaCO3 appearance
in the PM2.5−10samples of Athens and Barcelona. Calcium
had its largest contributions to the PM2.5−10of Athens and
Barcelona, whereas Al and Si had major contributions in the other four cities. In addition, the fine-coarse ratio of to-tal Ca was lower in Barcelona (0.064) and Athens (0.068) than in the other four cities (0.086–0.183), indicating a strong coarse particle dominance in Ca distribution. The
contribu-tion of watersoluble Ca2+to the total amount of Ca was
de-termined on the basis of results from the IC (soluble frac-tion) and ED-XRF (total amount) analyses. A relatively low
contribution of total Ca to PM2.5−10, together with its high
water-solubility, in Duisburg, Prague and Amsterdam indi-cates that Calcium appeared mainly as water-soluble salts (e.g. oxide or sulphate) and not as poorly water-soluble salts
like CaCO3. On the contrary, a high contribution of insoluble
Ca, together with a low Si contribution, to PM2.5−10agrees
well with the appearance of CaCO3in Athens and Barcelona.
In Helsinki, the relatively high insoluble Ca (about 50%
of total), together with a high Si contribution, to PM2.5−10
suggests an appearance of other water-insoluble compounds
such as Calcium silicates in the absence of C(CO3)(Fig. 6).
Athens Sample number 1 2 3 4 5 6 7 8 9 10 11 12 13 14 CaC O3 (µg m -3) 0 5 10 15 20 25 30 35 Barcelona Sample number 1 2 3 4 5 6 7 8 9 10 11 12 13 14 15 Ca (neq m-3 ) 0 200 400 600 CO 3 2- (neq m -3) 0 200 400 600y = 0.9114x + 50.943 r = 0.9070 Ca (neq m-3 ) 0 50 100 150 200 CO 3 2- (neq m -3) 0 50 100 150 200y = 0.6315x - 20.921 r = 0.6147 Figure 5.
Fig. 5. Time-series of the mass concentration of CaCO3 in
PM2.5−10of Athens and Barcelona. The black dotted line is based
on the CO2−3 content analysed by the TOA, and the grey continu-ous line is based on the Ca content analysed by the ED-XRF. The linear regressions for the molar equivalent concentrations of Ca (x-axis) and CO2−3 (y-axis) are shown in the right upper corners of the panels for the two campaigns.
3.4.2 Thermal fractions of OC in PM2.5
The thermograms, i.e. the output from the TOA analysis of the OC and EC in the six-city samples, are comparable with each other, because the sampling devices, protocols and the analytical method were identical. The mean mass portions of
the five OC thermal fractions in PM2.5– labelled OC1, OC2,
OC3, OC4 and OCP – varied in the range of 26-33%, 6-10%, 7–10%, 9–22% and 29–50%, respectively (Fig. 7). The dif-ferences in the mass portions were relatively small between the cities. However, there was a trend that the pyrolysed OC fraction was higher (OCP 50%) in Prague than in the other cities (29–41%) and, vice versa, the OC peaks at temperature
steps of 480, 615 and 900◦C (i.e. OC2–OC4) were somewhat
smaller in Prague than in the other cities.
The OC concentration in PM2.5 correlated inversely with
the OC1 (r=−0.32 to −0.75), OC2 (r=−0.022 to −0.58), OC3 (r=−0.51 to −0.69) and OC4 (r=−0.31 to −0.94) in all the six-city data, whereas the OCP had a relatively high positive correlation with the OC (r=0.70 to 0.93). This pat-tern in results suggests a too short residence time at each temperature step of the TOA method, which may be partly a consequence of the 3- to 4-day sampling duration and
rel-atively large masses of PM2.5particles on our filters. In any
case, the too short residence time at temperature steps in-creases charring of the OC (Yu et al., 2002), irrespectively of the organic composition of particulate samples. The trans-mittance of laser light through the filter gradually decreases, which suggests that a part of OC is pyrolysed during each OC temperature step (OC1–OC4).
The dominating thermal fraction from the PM2.5 backup
filters was OC1 (56–62%), whereas the OC2–OC4 (10–16%) and OCP (0–3%) were found only in minor quantities. The thermogram profiles from the six-city samples were similar
Duisburg Prague Amsterdam Helsinki Barcelona Athens Pe rce n tage (%) 0 20 40 60 80 100 120 1.4 1.5 1.2 4.2 5.6 8.8 Ti Fe Si Al K Ca Soluble Ca2+ Figure 6.
Fig. 6. The relative contribution (%) of crustal elements (Ca, Ti, Fe,
Si, Al and K) to the soil particles in PM2.5−10. The value above the bar indicates to the sum of mean concentrations (µg m−3)of the crustal elements during the six sampling campaigns. The portion of water-soluble Ca2+from the total Ca is shown as a striped bar.
to each other, irrespective of the geographical location or sea-son. In this study, the OC on the backup filter was anticipated to be comprised of adsorbed organic gases, but some part of it may have been formed via evaporation of semivolatile or-ganics from particles collected on the front filter (Turpin et al., 2000). Regardless of its origin (positive or negative arte-fact), the OC on backup filter seemed to be easily volatile (i.e. a large OC1).
Only very limited conclusions can be drawn from the chemical content of thermal fractions, because the evolution of organic components depends on several factors. First, the presence of some catalytically active inorganic salts such as
Na+ and K+ (Novakov and Corrigan, 1996) or ammonium
sulphate and phosphate (Yu et al., 2002) can increase the combustion rate of certain compounds (Novakov and Cor-rigan, 1996) or the charring of insoluble organic materials (Yu et al., 2002). Second, as mentioned above, the too short steps of the temperature program cause overlapping of the OC peaks and increase the charring. Third, organic gases can be adsorbed on quartz filter with more than a single binding energy (Kirchstetter et al., 2001), which results in an appear-ance of a certain compound in more than one thermal frac-tion.
4 Conclusions and implications
The advantages of this study were as follows: 1) all the sam-ples were collected using the same sampling devices and fol-lowing a uniform protocol, 2) the samples were analysed with the same TOA method in one central laboratory, and 3) the long sampling duration and the use of filters from one manufacturing lot improved the accuracy of the tandem quartz filter subtraction method. All of these factors im-proved the comparability of the EC, OC and POM results be-tween the six contrasting sampling campaigns. However, we
OC1 OC2 OC3 OC4 OCP
Per c entage (%, x/totOC ) 0 10 20 30 40 50 60 70 Duisburg Prague Amsterdam Helsinki Barcelona Athens Figure 7. 1
Fig. 7. The mean ± SD relative contributions (%) of the four OC
thermal fractions (OC1-OC4) and pyrolysed OC (OCP) to the total OC in PM2.5of the six sampling campaigns.
could not reliably separate the four thermal fractions (OC1– OC4) and the pyrolysed OC from each other, because the residence time in our modified NIOSH programme of TOA was too short for the rather large amounts of particles on our filters. Moreover, the long sampling duration may have in-creased evaporative OC losses from collected particles.
Our present validation indicates that carbonate (C(CO3))
in PM2.5−10 can be reliably quantified from the TOA
ther-mograms and subtracted from the OC with the help of the described integration. This simple method can be used as an alternative for the more time-consuming HCl pre-treatment method (Cachier et al., 1989). In a future study, it would
be worth while investigating, how C(CO3) behaves in the
IMPROVE thermal program. As CaCO3 decomposes at a
relatively high temperature of about 800◦C, its appearance in
particulate samples would probably lead to an overestimation of the EC concentration compared to the NIOSH programme. It is obvious that combustion emissions from vehicle
en-gines affected the POM content in PM2.5of all the six
sam-pling campaigns. However, our analysis of the sources of organic material in POM revealed some important
differ-ences. The PM2.5 of Prague (winter) had obviously large
impacts on POM from local residential heating with solid
fuels (biomass, coal), while the POM in PM2.5 of
Amster-dam (winter) and Duisburg (autumn) might be mainly im-pacted by regional aerosols from the same origins. The POM
in PM2.5 of Barcelona (spring) seemed to have the largest
relative contribution of all the six campaigns from fuel oil combustion, most likely in ships at the large harbour.
Fi-nally, the POM in PM2.5 of Barcelona (spring) and Athens
(summer) seemed to have a much larger contribution than the other campaigns from secondary organic compounds formed in photochemical oxidative reactions in the atmosphere. The on-going toxicological studies will clarify the health signifi-cance of these findings.
2878 M. Sillanp¨a¨a et al.: Organic, elemental and inorganic carbon Acknowledgements. This study was conducted within the
frame-work of the project “Chemical and biological characterisation of ambient air coarse, fine, and ultrafine particles for human health risk assessment in Europe” (PAMCHAR) co-ordinated by the Na-tional Public Health Institute of Finland (http://www.pamchar.org/). The project has been funded by the EC-FP5 Quality of Life and Management of Living Resources Programme (Contract QLK4-CT-2001-00423), the Academy of Finland (FINE-contract 201701), and the Centre of Excellence Programme 2002–2007 of the Academy of Finland (Contract 53307) and the National Technology Fund (TEKES, Contract 40715/01) and it belongs to the COST Ac-tion 633 “Particulate matter: properties related to health effects”. The authors are grateful to the teams of T. Kuhlbusch (Institut f¨ur Energie- und Umwelttechnik, Duisburg, DE), M. Branis (Charles University in Prague, CZ), B. Brunekreef (University of Utrecht, NL), J. Sunyer (Institut Municipal d’Investigaci M`edica, Barcelona, ES), and K. Katsouyanni and I. Kavouras (National and Kapodis-trian University of Athens and National Observatory of Athens, GR), for conducting the sampling campaigns. R. E. van Grieken and Z. Spolnik (University of Antwerp, BE) are acknowledged for the ED-XRF analysis.
Edited by: R. Hitzenberger
References
Bardouki, H., Liakakou, H., Economou, C., Sciare, J., Smol´ık, J., ˇ
Zd´ımal, V., Eleftheriadis, K., Lazaridis, M., Dye, C., and Mi-halopoulos, N.: Chemical composition of size-resolved atmo-spheric aerosols in the eastern Mediterranean during summer and winter, Atmos. Environ., 37, 195–208, 2003.
Cachier, H., Br´emond, M. P., and Buat-M´enard, P.: Determination of atmospheric soot carbon with a simple thermal method, Tellus, 41B, 379–390, 1989.
Chow, J. C., Watson, J. G., Crow, D., Lowenthal, D. H., and Mer-rifield, T.: Comparison of IMPROVE and NIOSH carbon mea-surements, Aerosol Sci. Technol., 34, 23–34, 2001.
Heal, M. R., Hibbs, L. R., Agius, R. M., and Beverland, I. J.: To-tal and water-soluble trace meTo-tal content of urban background PM10, PM2.5and black smoke in Edinburgh, UK, Atmos. Envi-ron., 39, 1417–1430, 2005.
Kavouras, I. G., Koutrakis, P., Cereceda-Balic, F., and Oyola, P.: Source apportionment of PM10and PM2.5in five Chilean cities
using factor analysis, J. Air Waste Manage. Assoc., 51, 451–464, 2001.
Kawamura, K. and Ikushima, K.: Seasonal changes in the distribu-tion of dicarboxylic acids in the urban atmosphere, Environ. Sci. Technol., 27, 2227–2235, 1993.
Kirchstetter, T. W., Corrigan, C. E., and Novakov, T.: Labora-tory and field investigation of the absorption of gaseous organic compounds onto quartz filters, Atmos. Environ., 35, 1663–1671, 2001.
Kukkonen, J., Salmi, T., Saari, H., Konttinen, M., and Kartastenp¨a¨a, R.: Review of urban air quality in Finland, Boreal Environ. Res., 4, 55–65, 1999.
Lighty, J. S., Veranth, J. M., and Sarofim, A. F.: Combustion aerosols: factors governing their size and composition and
im-plications to human health, J. Air Waste Manage. Assoc., 50, 1565–1618, 2000.
Lim, M. C. H., Ayoko, G. A., and Morawska, L.: Characterization of elemental and polycyclic aromatic hydrocarbon compositions of urban air in Brisbane, Atmos. Environ., 39, 463–476, 2005. Liu, B. Y. H. and Pui, D. Y. H.: Aerosol sampling inlets and
inhal-able Particles, Atmos. Environ., 15, 589–600, 1981.
Loo, B. W. and Cork, C. P.: Development of high efficiency virtual Impactor, Aerosol Sci. Technol., 9, 167–176, 1988.
Metzger, K. B., Tolbert, P. E., Klein, M., Peel, J. L., Flanders, W. D., Todd, K., Mulholland, J. A., Ryan, P. B., and Frumkin, H.: Ambient air pollution and cardiovascular emergency department visits, Epidemiology, 15, 46–56, 2004.
Na, K., Sawant, A. A., Song, C., and Cocker III, D. R.: Primary and secondary carbonaceous species in the atmosphere of Western Riverside County, California, Atmos. Environ., 38, 1345–1355, 2004.
National Atmospheric Emissions Inventory (NAEI): UK emission of air pollutants 1970-2001, National Environmental Technology Centre, Abingdon, UK, available at: www.naei.org.uk, 2003. Novakov, T. and Corrigan, C. E.: Cloud condensation nucleus
activ-ity of the organic component of biomass smoke particles, Geo-phys. Res. Lett., 23, 2141–2144, 1996.
Nunes, T. V. and Pio, C. A.: Carbonaceous aerosols in industrial and coastal atmospheres, Atmos. Environ., 27A, 1339–1446, 1993. Pakkanen, T. A., Loukkola, K., Korhonen, C. H., Aurela, M.,
M¨akel¨a, T., Hillamo, R. E., Aarnio, P., Koskentalo, T., Kousa, A., and Maenhaut, W.: Sources and chemical composition of at-mospheric fine and coarse particles in the Helsinki area, Atmos. Environ., 35, 5381–5391, 2001.
Putaud, J.-P., Raes, F., Van Dingenen, R., Br¨uggemann, E., Fac-chini, M.-C., Decesari, S., Fuzzi, S., Gehrig, R., H¨uglin, C., Laj, P., Lobbeer, G., Maenhaut, W., Mihalopoulos, N., M¨uller, K., Querol, X., Rodriguez, S., Schneider, J., Spindler, G., ten Brink, H., Torseth, K., and Wiedensohler, A.: A European aerosol phe-nomenology – 2: chemical characteristics of particulate matter at kerbside, urban, rural and background sites in Europe, Atmos. Environ., 38, 2579–2595, 2004.
Querol, X., Alastuey, A., Ruiz, C. R., Artinano, B., Hansson, H. C., Harrison, R. M., Buringh, E., ten Brink, H. M., Lutz, M., Bruck-mann, P., Straehl, P., and Schneider, J.: Speciation and origin of PM10 and PM2.5 in selected European cities, Atmos. Environ., 38, 6547–6555, 2004.
Rodr´ıguez, S., Querol, X., Alastuey, A., and Plana, F.: Sources and processes affecting levels and composition of atmo-spheric aerosol in the western Mediterranean, J. Geophys. Res., 107(D24), 4777, doi:10.1029/2001JD001488, 2002.
Rogge, W. F., Mazurek, M. A., Hildemann, L. M., Cass, G. R., and Simoneit, B. R. T.: Quantification of urban organic aerosols at a molecular level: identification, abundance and seasonal varia-tion, Atmos. Environ., 27A, 1309–1330, 1993.
Russell, L. M.: Aerosol organic-mass-to-organic-carbon ratio Mea-surements, Environ. Sci. Technol., 37, 2982–2987, 2003. Salma, I., Chi, X., and Maenhaut, W.: Elemental and organic
car-bon in urban canyon and background environments in Budabest, Hungary, Atmos. Environ., 38, 27–36, 2004.
Sciare, J., Cachier, H., Oikonomou, K., Ausset, P., Srada-Est`eve, R., and Mihalopoulos, N.: Characterization of carbonaceous aerosols during the MINOS campaign in Crete, July–August
2001: a multi-analytical approach, Atmos. Chem. Phys., 3, 1743–1757, 2003,
SRef-ID: 1680-7324/acp/2003-3-1743.
Seinfeld, J. H. and Pandis, S. N.: Atmospheric chemistry and physics: From air pollution to climate change, John Wiley, New York, 1998.
Sillanp¨a¨a, M., Hillamo, R., M¨akel¨a, T., Pennanen, A. S., and Salo-nen, R. O.: Field and laboratory tests of a high volume cascade Impactor, J. Aerosol Sci. 34, 485–500, 2003.
Sillanp¨a¨a, M., Saarikoski, S., Hillamo, R., Pennanen, A., Makko-nen, U., Spolnik, Z., Van Grieken, R., Koskentalo, T., and Salo-nen, R. O.: Chemical composition, mass size distribution and source analysis of long-range transported wildfire smokes in Helsinki, Sci. Tot. Environ., 350, 119–135, 2005.
Simoneit, B. R. T., Schauer, J. J., Nolte, C. G., Oros, D. R., Elias, V. O., Fraser, M. P., Rogge, W. F. and Cass, G. R.: Levoglucosan, a tracer for cellulose in biomass burning and atmospheric particles, Atmos. Environ., 33, 173–182, 1999.
Song, X.-H., Polissar, A. V., and Hopke, P. K.: Sources of fine particle composition in the northeastern US, Atmos. Environ., 35, 5277–5286, 2001.
Turpin, B. J., Saxena, P., and Andrews, E.: Measuring and sim-ulating particulate organics in the atmosphere: problems and prospects, Atmos. Environ., 34, 2983–3013, 2000.
Viidanoja, J., Sillanp¨a¨a, M., Laakia, J., Kerminen, V.-M., Hillamo, R., Aarnio, P., and Koskentalo, T.: Organic and black carbon in PM2.5and PM10: 1 year of data from an urban site in Helsinki,
Finland, Atmos. Environ., 36, 3183–3193, 2002.
World Health Organization (WHO): Health aspects of air pollution with particulate matter, ozone and nitrogen dioxide, Report on a WHO Working Group; Bonn, Germany, 13–15 January 2003, available at: www.euro.who.int/document/e79097.pdf, 2003. Yao, X., Fang, M., Chan, C. K., Ho, K. F., and Lee, S. C.:
Charac-terization of dicarboxylic acids in PM2.5in Hong Kong, Atmos.
Environ., 38, 963–970, 2004.
Yu, J. Z., Xu, J., and Yang, H.: Charring characteristics of atmo-spheric organic particulate matter in thermal analysis, Environ. Sci. Technol., 36, 754–761, 2002.