HAL Id: hal-00298814
https://hal.archives-ouvertes.fr/hal-00298814
Submitted on 8 Feb 2007
HAL is a multi-disciplinary open access
archive for the deposit and dissemination of sci-entific research documents, whether they are pub-lished or not. The documents may come from teaching and research institutions in France or abroad, or from public or private research centers.
L’archive ouverte pluridisciplinaire HAL, est destinée au dépôt et à la diffusion de documents scientifiques de niveau recherche, publiés ou non, émanant des établissements d’enseignement et de recherche français ou étrangers, des laboratoires publics ou privés.
The effectiveness of polder systems on peak discharge
capping of floods along the middle reaches of the Elbe
River in Germany
S. Huang, J. Rauberg, H. Apel, K.-E. Lindenschmidt
To cite this version:
S. Huang, J. Rauberg, H. Apel, K.-E. Lindenschmidt. The effectiveness of polder systems on peak dis-charge capping of floods along the middle reaches of the Elbe River in Germany. Hydrology and Earth System Sciences Discussions, European Geosciences Union, 2007, 4 (1), pp.211-241. �hal-00298814�
HESSD
4, 211–241, 2007The effectiveness of polder systems on
the Elbe River S. Huang et al. Title Page Abstract Introduction Conclusions References Tables Figures ◭ ◮ ◭ ◮ Back Close
Full Screen / Esc
Printer-friendly Version
Interactive Discussion
EGU
Hydrol. Earth Syst. Sci. Discuss., 4, 211–241, 2007 www.hydrol-earth-syst-sci-discuss.net/4/211/2007/ © Author(s) 2007. This work is licensed
under a Creative Commons License.
Hydrology and Earth System Sciences Discussions
Papers published in Hydrology and Earth System Sciences Discussions are under open-access review for the journal Hydrology and Earth System Sciences
The effectiveness of polder systems on
peak discharge capping of floods along
the middle reaches of the Elbe River in
Germany
S. Huang, J. Rauberg, H. Apel, and K.-E. Lindenschmidt
GFZ GeoForschungsZentrum Potsdam, Section 5.4 – Engineering, Hydrology, Telegrafenberg, 14473 Potsdam, Germany
Received: 11 January 2007 – Accepted: 29 January 2007 – Published: 8 February 2007 Correspondence to: K.-E. Lindenschmidt (kel@gfz-potsdam.de)
HESSD
4, 211–241, 2007The effectiveness of polder systems on
the Elbe River S. Huang et al. Title Page Abstract Introduction Conclusions References Tables Figures ◭ ◮ ◭ ◮ Back Close
Full Screen / Esc
Printer-friendly Version
Interactive Discussion
EGU Abstract
In flood modelling, many one-dimensional (1-D) hydrodynamic models are too re-stricted in capturing the spatial differentiation of processes within a polder or system of polders and two-dimensional (2-D) models are very demanding in data requirements and computational resources. The latter is an important consideration when
uncer-5
tainty analyses using the Monte Carlo techniques are to complement the modelling exercises. This paper describes the development of a quasi-2-D modeling approach, which still calculates the dynamic wave in 1-D but the discretisation of the compu-tational units is in 2-D, allowing a better spatial representation of the flow in polders and avoiding large additional expenditure on data pre-processing and computational
10
time. The model DYNHYD (1-D hydrodynamics) from the WASP5 modeling package was used as a basis for the simulations and extended to incorporate the quasi-2-D approach. A local sensitive analysis shows the sensitivity of parameters and bound-ary conditions on the filling volume of polders and capping of the peak discharge in the main river system. Two flood events on the Elbe River, Germany were used to calibrate
15
and test the model. The results show a good capping effect on the flood peak by the proposed systems. The effect of capping reduces as the flood wave propagates down-stream from the polders (up to 0.5 cm of capping is lost for each additional kilometer from the polders).
1 Introduction
20
Polders are effective measures for capping the flood peak and reducing flood risk. After the extreme flood event in 2002 along the Elbe River, it was realized that flood and flood risk management needed to be revamped for this river basin (Petrow et al., 2006) and other basins in Germany. This has given impetus for large research activities at the national level, e.g. RIMAX, a consortium of projects in Germany to risk management of
25
HESSD
4, 211–241, 2007The effectiveness of polder systems on
the Elbe River S. Huang et al. Title Page Abstract Introduction Conclusions References Tables Figures ◭ ◮ ◭ ◮ Back Close
Full Screen / Esc
Printer-friendly Version
Interactive Discussion
EGU
(http://www.rimax-hochwasser.de). Of the approximately 40 projects launched, three are focused on improving flood management strategies using polders. Polder control is also a consideration in the EU funded project FLOODsite (http://www.floodsite.net) on integrated flood risk analysis and management methodologies.
Several polder systems have also been suggested for construction along the middle
5
reaches of the Elbe River (IWK, 2004) to minimize flood risk potential. In this study, it is aimed to analyze how effective some of these suggested polder systems are in capping flood discharges and how much this capping effect recedes as the flood wave propagates downstream from the polders. Also investigated is the impact of upstream dyke breaching on the discharge capping potential of the polder systems.
10
To simulate and predict the capping effects by polder systems during flood events, an array of models of varying complexity levels may be used. Following a catego-rization in the number of spatial dimensions, simulations are often carried out using one-dimensional (1-D) or two-dimensional (2-D) models. 1-D hydrodynamic models often solve the St.Venant full dynamic wave equations which respect to both
momen-15
tum and mass continuity of water transport through a meshed system. 2-D models are often based on shallow water equations, which are hyperbolic partial differential equations describing water motion (for examples, see Telemac-2-D by Galland et al., 1991, and MIKE21 by DHI, 1994). A combination of both 1-D and 2-D approaches have also been used in which the flow in the main river channel is solved in 1-D and
20
the overbank inundated areas are solved in 2-D using the diffusive wave equation or storage cells (for examples, see LISFLOOD-FD by Bates and De Roo, 2000, and an-other model by Blad ´e et al., 1994). 2-D and 1-D/2-D combination models are generally computationally more extensive and have more requirements on input data and pre-processing than 1-D models. This is particularly a concern when automated methods
25
for parameter optimization or Monte-Carlo methods for uncertainty analysis are to be implemented. However, 1-D models are not sufficient in describing the spatial variabil-ity of water depths, velocities and flows in floodplains, polders and other overbanked inundated areas during flood events. This is important for subsequent sediment and
HESSD
4, 211–241, 2007The effectiveness of polder systems on
the Elbe River S. Huang et al. Title Page Abstract Introduction Conclusions References Tables Figures ◭ ◮ ◭ ◮ Back Close
Full Screen / Esc
Printer-friendly Version
Interactive Discussion
EGU
substance transport modeling in the river-polder system.
In this study, a quasi-2-D approach using a 1-D hydrodynamic model is proposed that allows its discretisation to be extended into the polder system giving a 2-D represen-tation of the inundation area. One of the first and few applications using this approach was modeling the flood propagation through the Mekong River Delta (Cunge, 1975).
5
Aureli et al. (2006) have used a quasi-2-D numerical approach by adapting the hydro-dynamic model Mike 11 (DHI, 1992) for inundated areas enclosed by levees. Huang et al. (2007) have used quasi-2-D numerical modeling adopting the hydrodynamic module for flooded hinterland areas due to dyke breaching. The authors also compared their results with those from a 2-D storage cell model of the same dyke breach area
(Voro-10
gushyn et al., 2007) and found good agreement between the two models. The quasi-2-D representation of the polder system is pursued to allow future sediment transport simulations and Monte-Carlo uncertainty analyses. Due to its computational speed, the quasi-2-D approach may also be utilized for operational flood management.
2 Methods
15
2.1 Hydrodynamic model DYNHYD
In this study, the quasi-2-D approach can be realized with the model DYNHYD, which is part of the WASP5 (Water Quality Analysis Simulation Program) package developed by the U.S. Environmental Protection Agency (Ambrose et al., 1993). DYNHYD solves the 1-D equation of continuity and momentum for a branching or channel-junction
(link-20
node) computational network. The channels calculate the transport of water using the equations of motion:
∂U ∂t = −U
∂U
∂x + ag+ af (1)
where af is the frictional acceleration, ag is the gravitational acceleration along the longitudinal axisx, U is the mean velocity, ∂U/∂t is the local inertia term or the velocity
HESSD
4, 211–241, 2007The effectiveness of polder systems on
the Elbe River S. Huang et al. Title Page Abstract Introduction Conclusions References Tables Figures ◭ ◮ ◭ ◮ Back Close
Full Screen / Esc
Printer-friendly Version
Interactive Discussion
EGU
rate of change with respect to timet and U ∂U/∂xis the convective inertia term or the
rate of momentum change by mass transfer. The junctions calculate the storage of water described by the continuity equation:
∂H ∂t = 1 B · ∂Q ∂x (2)
whereB is the channel width, H is the water surface elevation (head), ∂H/∂t is the
5
rate of water surface elevation change with respect to timet, and ∂Q/∂x is the rate
of water volume change with respect to distance x. The discharge Q is additionally
related to river morphology and bottom roughness using Manning’s equation:
Q = r 2/3 H · A n r ∂H ∂x (3)
whereA is the cross-sectional area of the water flow, n is the roughness coefficient
10
of the river bed, rH is the hydraulic radius and ∂H/∂x is the slope of the free water
surface in the longitudinal directionx. Discharge over a weir is calculated by the weir
equation:
Q = α · b · h1.5 (4)
whereα is the weir coefficient, b is the weir breadth and h is the depth between the
15
upstream water level and the weir crest. Backwater effects were also taken into con-sideration.
2.2 Adaptations to DYNYHD for modelling flow through polders
Although the equation of motion and continuity are implemented in the model for a 1-D framework, the channel-junction methodology allows the channels to be linked to
sev-20
eral junctions, permitting a 2-D spatial representation of the discretisation network (see Fig. 1). Due to the condition of water continuity and stability requirements water levels
HESSD
4, 211–241, 2007The effectiveness of polder systems on
the Elbe River S. Huang et al. Title Page Abstract Introduction Conclusions References Tables Figures ◭ ◮ ◭ ◮ Back Close
Full Screen / Esc
Printer-friendly Version
Interactive Discussion
EGU
in the discretisation elements cannot fall dry, hence an extension to the model was im-plemented to capture the flooding and emptying of the polder during a flood simulation. In this algorithm the inlet and outlet discharges of a polder are controlled by a “virtual” weir. During low flow when the polder system is not in use a small amount of water is allowed to leak through the weir from the river into the polder to prevent the discretised
5
elements depicting the polder from becoming dry. This volume is very minute com-pared to the discharge in the river so that the error in the simulations is insignificant. To simulate the control of polders, the weir is opened by lowering the weir crest to the level of the hinterland ground level. The opening is not abrupt but done successively over a time period of up to 12 h to simulate the weir control process. This algorithm
10
has already been implemented successfully for floodplains (see Lindenschmidt et al., 2006) and dyke breach areas (see Huang et al., 2007).
3 Study site and model setup
The study site is the middle course of the Elbe River in Germany between the gages at Torgau and Wittenberg (see Fig. 2). This stretch of the river is heavily modified
15
with dykes running along both sides for most of the flow distance. The construction of polders along this stretch has been proposed and is in the planning stages. An evaluation of the efficiency of the polders is a motivation of this work. Characteristics of the discharges recorded at the gages at Torgau (Elbe-km 154.2) and Wittenberg (Elbe-km 214.1) are given in Table 1. Along this stretch one major tributary, Schwarze
20
Elster, flows into the Elbe River at Elbe-km 199. High water level markers and the water level readings from the gage at Pretzsch (at Elbe-km 184.5) and Wittenberg (Elbe-km 214.1) were used to compare measurements with hydrodynamic simulations. Model calibration was carried out with data from the flood event in January 2003 in which dyke breaching did not occur within this stretch of the river. The more severe flood
25
from August 2002 was modeled to simulate the capping effect by polder systems on the peak discharge. Of the polders suggested for construction three are simulated in
HESSD
4, 211–241, 2007The effectiveness of polder systems on
the Elbe River S. Huang et al. Title Page Abstract Introduction Conclusions References Tables Figures ◭ ◮ ◭ ◮ Back Close
Full Screen / Esc
Printer-friendly Version
Interactive Discussion
EGU
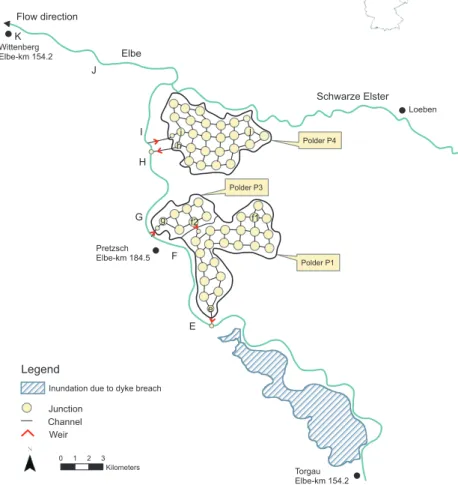
this study (see Fig. 3). Polder P1 and P3 constitute a polder system connected by a gate between them. This polder system can retain water up to a depth of 3 m. The downstream polder P4 has a smaller water capacity with a maximum filling depth of 1.4 m. Figure 3 also shows a possible inundated area due to dyke breaching (Huang et al., 2007) which was included in this study to show the effects of upstream dyke
5
breaching on peak discharge capping of the polders. 3.1 Input data
The model of the river reach was set up on the basis of cross-sectional profiles avail-able every 500 m along the river from which initial hydraulic radii and segment water volumes were derived. The time frame of the modeled flow event is 3–11 January 2003
10
for the calibration and 12–23 August 2002 for the simulation with polder flooding. Daily discharge recordings from the gages at Torgau, Loeben and Wittenberg were used as boundary conditions for the hydrodynamic model. Discharge and water level data were also available from these gages on a daily basis. Water level readings from Pretzsch, which have a higher temporal resolution (every 15 min), were also utilized. A
longitu-15
dinal profile of the maximum water level attained during the floods complemented the data used for calibrating and testing of the hydrodynamic model. The simulation results are output on an hourly time step.
3.2 Polder control strategy
The discretisation of channels and junctions with inlet and outlet weirs for the modeled
20
polders and inundated hinterland is shown in Fig. 3. There are four weirs which con-stitute the inlet and outlet of water flow through the polder systems. Figure 4 shows the control strategy for polder flooding emptying for optimum capping of the flood hy-drograph. All gates are initially closed. The gate at Locatione is opened first to begin
capping of the peak discharge in the river. The gate ath is opened shortly after at the
25
HESSD
4, 211–241, 2007The effectiveness of polder systems on
the Elbe River S. Huang et al. Title Page Abstract Introduction Conclusions References Tables Figures ◭ ◮ ◭ ◮ Back Close
Full Screen / Esc
Printer-friendly Version
Interactive Discussion
EGU
the gate connecting polders P1 and P3 (Location g) is opened. This gate is also the first to close (during Day 6), since the volume capacity of P3 is relatively small and fills up quickly. Both inlet gates of polders P1 and P4 are closed during Day 7. Emptying of all three polders commences on Day 9 by opening the gates atf 2, g and i.
3.3 Local sensitivity analysis
5
A sensitivity analysis was carried out to check the response of the system to state variables by varying different parameters. The parameters which were analyzed in this model include:
i. Weir coefficient α or weir breadth b from the weir discharge equation. Only α is used since the sensitivity ofα is analogous to b – the two are multiplicative factors
10
in the equation. In other words, the percentage deviations inα corresponding 1:1
to the percentage deviations in weir breadthb.
ii. Roughness coefficient n of the channel bed from Manning’s equation
iii. Percentage deviations in the discharge boundary conditions q at the Torgau,
Loeben and Wittenberg gages.
15
The state variables investigated are the water volume in the polders and the heads in the river channels. A base simulation was first run with the resultObase, which is used
as a base parameter value. After this base run, the parameters were decreased by 10% separately for each single run to obtain the resultsOx. The percentage changes in peak discharge capping in the river and the water volume in the flooded polders were
20
used to quantify the local sensitivity of the input parameters: Percentage change = Ox− Obase
Obase
× 100 (5)
A negative percentage change indicates a reduction in the output values. In polders, the percentage change of water volume also equate to the percentage change in the
HESSD
4, 211–241, 2007The effectiveness of polder systems on
the Elbe River S. Huang et al. Title Page Abstract Introduction Conclusions References Tables Figures ◭ ◮ ◭ ◮ Back Close
Full Screen / Esc
Printer-friendly Version
Interactive Discussion
EGU
water level since the surface area of the polderApolderused to calculate volumes cancel
out: ∆V Vbase = ∆h hbase ∗ Apolder Apolder = ∆h hbase (6)
4 Results and discussion
4.1 Model calibration (January 2003 flood)
5
The model was first calibrated on the basis of the January 2003 flood event. Figure 5 provides the measured and simulated longitudinal profiles of the maximum water levels attained during the flood for the entire modeled stretch between Torgau and Wittenberg. The simulation agrees well with the recorded values. The Manning’s roughness coeffi-cient between 0.030 to 0.035 s/m1/3provided the best fit of the simulations to the data.
10
The water levels recorded at the gage at Pretzsch and Wittenberg provided temporal data for a comparison between measurements and simulations results and they also show good agreement between each other (see Fig. 6).
4.2 Model testing (August 2002 flood)
We refer to model testing because it is difficult to validate the model for three reasons:
15
i. Data was not available from other floods that were more extreme than the floods of January 2003 and August 2002.
ii. A true validation of the model is not possible because each flood event has its own characteristics pertaining to flood depths and extent within the river-floodplain system which in turn affects the values for the bottom roughness. The roughness
20
coefficient must be “fine-tuned” for each flood event to capture the distinct flow characteristics of the flood.
HESSD
4, 211–241, 2007The effectiveness of polder systems on
the Elbe River S. Huang et al. Title Page Abstract Introduction Conclusions References Tables Figures ◭ ◮ ◭ ◮ Back Close
Full Screen / Esc
Printer-friendly Version
Interactive Discussion
EGU
iii. Dyke breaching occurs for the most extreme events and data on the water vol-umes diverted from the river to the hinterland are not available.
Hence, we perform a model testing, in which the calibrated model is transferred to the more severe August 2002 flood event, and the roughness coefficient is “fine-tuned” to depict the discharge behavior of the flood.
5
Figures 7 and 8 are the results using the boundary condition data from the flood event in August 2002. Using roughness coefficients for the main channel between 0.038 and 0.040 s/m1/3, the simulated head matches the maximum measured water levels quite well. At the gages at Pretzsch and Wittenberg, the simulated hydrographs have a good fit to the gage readings especially after the second simulation day. However, for
10
the first two days there is a 30∼40 cm overestimation of the model at the start of the rising limb in both flood events. The smaller the water discharge is, the greater the error becomes. This overestimation has been observed in other modeling studies of the same river reach (Vorogushyn et al., 2007) and is due to the model being fitted to the peak discharge. Varying the roughness coefficients during the flood to reflect the
15
dependency of bottom roughness with flood water depth and extent may alleviate this problem and is a subject of future work.
4.3 Peak discharge and water level capping (August 2002 flood)
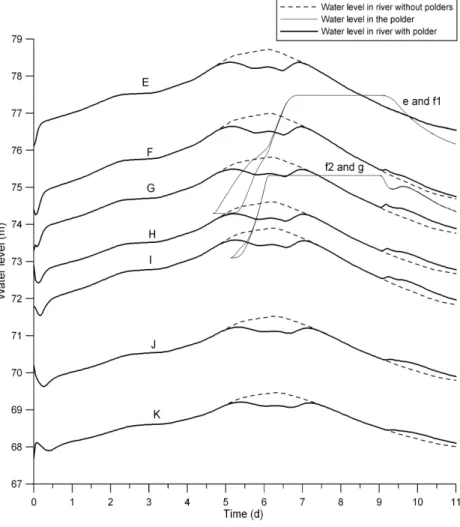
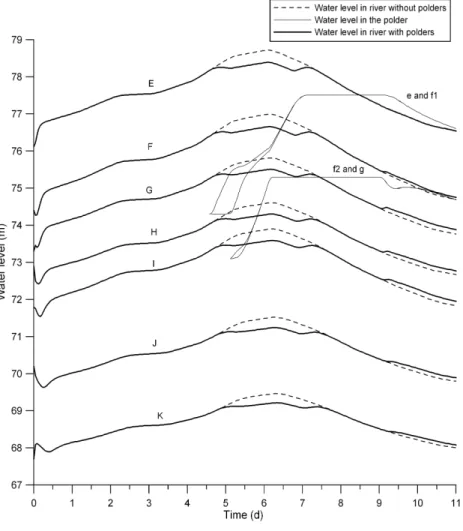
To show the potential of peak discharge capping of the different polder systems, several simulations were carried out. Firstly, the two polder systems P1+P3 and P4 were
20
inundated separately to see the capping effect by each system. From the design point of view, the influence of weir breadth was also considered. Figures 9 and 10 show the results of polder system P1+P3 with weir breadths of 100 and 50 m respectively. It is found that the capping effects are almost the same in both conditions, about 33 and 32 cm respectively in the reduction in the peak water levels in the river. In addition, the
25
narrower the weir breadth is, the longer it takes to fill the polder and capping occurs slower over a more extended period of time. Under both conditions, the capping effect
HESSD
4, 211–241, 2007The effectiveness of polder systems on
the Elbe River S. Huang et al. Title Page Abstract Introduction Conclusions References Tables Figures ◭ ◮ ◭ ◮ Back Close
Full Screen / Esc
Printer-friendly Version
Interactive Discussion
EGU
tends to recede along the river. From the locationI, J and K along the river, a distance
of 20 km, the degree of capping with weir breadth of 100 m decreases from 32 cm at
I to 29 cm and 25 cm at J and K , respectively. Hence, the capping effect recedes by
approximately 0.35 cm per river km downstream from the polder system. This is due to the widening of the floodplain between dikes in the downstream half of the studied
5
reach (see Fig. 2).
It is interesting to compare these results with another study of the same polder sys-tem (F ¨orster et al., 2006), in which a full 2-D model MIKE 21 (DHI, 1994) was used to simulate flow in the polders. The behavior of capping is similar to our model re-sults, however the degree of capping is somewhat less (maximum of 20 cm) due to the
10
smaller surface area and shallower filling level used in polder P1.
Figure 11 shows the velocity fields of the water currents in the polders P1 and P3 for two time frames, one representing filling of the polder system on simulation day 5.25 (6th hour of the 5th day) and another representing emptying on simulation day 9.5 (12th hour of the 9th day). The distinct differences in the magnitudes and directions of the
15
velocity vectors proves the efficacy of the quasi-2-D approach in capturing the spatial differentiation in flow characteristics, even though the model solves the equations in one dimensional form.
Since the extent of capping is almost independent of weir width and the time for polder filling and hydrograph capping are acceptable for the narrower weir breadths,
20
the subsequent simulations are based on weir widths of 50 m. Figure 12 shows the water level hydrographs using only polder P4 for discharge diversion. Due to its smaller water volume capacity according to the suggested design specifications, this polder has much less capping potential (maximum 12 cm) than the polder system P1+P3. The capping at the locationsI, J, K are about 15 cm, 14 cm and 12 cm respectively.
25
For P4, capping recession is approximately 0.15 cm/river km.
When both polder systems are inundated during this flood event, the capping effect increases to a maximum of 44 cm (see Fig. 13), which is 6% less than the summation of capping by each polder system considered separately. This coincides with results
HESSD
4, 211–241, 2007The effectiveness of polder systems on
the Elbe River S. Huang et al. Title Page Abstract Introduction Conclusions References Tables Figures ◭ ◮ ◭ ◮ Back Close
Full Screen / Esc
Printer-friendly Version
Interactive Discussion
EGU
obtained by De Roo (2003), who studied polders on the Oder River and calculated 15% less capping using the total polder system compared to the summation of capping of each polder considered separately. The reason is that polder P4 needs somewhat more time to fill due to the influence of polder P1+P3. The capping recession using all polders for flood water recession is 0.5 cm/river km.
5
4.4 Effect of upstream dyke breaching in polder discharge capping
The influence of upstream dyke breach on the effectiveness of peak discharge capping by the polders was also considered. Due to the dyke breach, the water levels at each river section are about 10 cm less than those without dyke breaching. However as long as both polder systems can be completely filled, the capping effects are not influenced.
10
The filling times were extended but not substantially (about 2 h). With the influence of dyke breaching and polder flood water retention, the water levels at Wittenberg can be as much as 50 cm lower for this extreme flood event. Hence, this system is very operational when extreme flooding occurs.
4.5 Local sensitivity analysis
15
All of the parameters were decreased separately by 10% keeping the opening and closing time points of all the polder gates fixed. The control strategy is based on the calibration and testing of the model using all three polders and the optimal use of the storage capacity of the polders. Hence, only a decrease in the parameters was considered, whereby the water volume entering the polders is less but the filling
20
capacity does not exceed its maximum potential. Changing the opening and closing times of the gates could then be avoided by which the influence of each parameter on the polder filling and hydrograph capping volumes could be compared. Figure 14 gives the percentage of water volume reduction in each polder. The most sensitive parameter in P1 and P4 is the boundary condition deviationq and the least sensitive is
25
HESSD
4, 211–241, 2007The effectiveness of polder systems on
the Elbe River S. Huang et al. Title Page Abstract Introduction Conclusions References Tables Figures ◭ ◮ ◭ ◮ Back Close
Full Screen / Esc
Printer-friendly Version
Interactive Discussion
EGU
more sensitive in P4 than in P1. This may be due to the smaller filling capacity of P4 and the influence of the upstream polder system P1+P3. The parameter effects on the water volumes for P3 are different than those of P1 and P4. Since the inlet to this polder is not directly connected to the river channel and its filling is controlled by the upstream polder P1, it seems to be less dependent on the characteristics of the river
5
itself but more directly on the inlet discharge (henceα).
With the reduction of water volume in polder systems, the capping effects reduce as well (see Fig. 15). The percentages of capping reduction byα remain relatively
con-stant at about 10% throughout the length of the river. The roughness coefficient and boundary deviation is more dependent on how much capping occurs. More capping
10
(e.g. at location I from all polders compared to location G for only P1+P3) leads to larger percentages in capping reduction. It is surprising to find that the deviation in the boundary condition lead to less water volume in polders, but more capping of the dis-charge hydrograph (referring to a smaller effect on capping reduction than roughness). This is because the time of opening the gate of the polder inlet is a little earlier in the
15
condition of varying roughness leading to a less effective capping of the peak discharge in the river. Generally, the opening time of the polder system is crucial in achieve the maximum capping effect and this time point is highly dependent on the characteristics of each flood, which is also confirmed by Hesselink et al. (2003).
5 Conclusions
20
1) Quasi-2-D modeling is a powerful tool for both provision and operational manage-ment of floods due to its robustness, ease of use and computational efficiency. For operational flood management, careful monitoring of dyke breaching is essential to obtain an optimal capping potential by the polder systems.
2) The polder systems can cap the flood peak effectively and this capping is relatively
25
HESSD
4, 211–241, 2007The effectiveness of polder systems on
the Elbe River S. Huang et al. Title Page Abstract Introduction Conclusions References Tables Figures ◭ ◮ ◭ ◮ Back Close
Full Screen / Esc
Printer-friendly Version
Interactive Discussion
EGU
system P1+P3 is more effective in capping capability and risk prevention.
3) The timing of opening the polder gates for flood water diversion is crucial for an optimal capping of the peak discharge and it is highly dependent on the discharge conditions.
4) Incorporating a variation of the roughness coefficient with the water level would
5
provide a better fit of the simulated heads with measures throughout the flood event, not just in the vicinity of the peak discharge. This is a subject of future work.
References
Ambrose, R. B., Wool, T. A., and Martin, J. L.: The water quality simulation program, 10
WASP5: model theory, user’s manual, and programmer’s guide, U.S. Environmental Pro-tection Agency, Athens, GA,http://www.epa.gov/ceampubl/swater/wasp/, 1993.
Apel, H., Thieken, A., Merz, B., and Bl ¨oschl, G.: Flood risk assessment and associated uncer-tainty, Nat. Hazards Earth Syst. Sci., 4, 295–308, 2004,
http://www.nat-hazards-earth-syst-sci.net/4/295/2004/. 15
Aureli, A., Maranzoni, A., Mignosa, P., and Ziveri, C.: Flood hazard mapping by means of fully-2D and quasi-2D numerical modeling: a case study, in: Floods, from defence to man-agement, edited by: van Alphen, J., van Beek, E., and Taal, M., 3rd Iinternational Symposium on Flood Defence, Nijmegen, Netherlands, Taylor & Francis/Balkema, ISBN: 0415391199, Blain, pp. 373–382, 2006.
20
Bates, P. D. and De Roo, A. P. J.: A simple raster-based model for floodplain inundation, J. Hydrol., 236, 54–77, 2000.
Blad ´e, E., G ´omez, M., and Dolz, J.: Quasi-two dimensional modelling of flood routing in rivers and flood plains by means of storage cells, in: Modelling of flood propagation over initially dry areas, edited by: Molinaro, P. and Natale, L., American Society of Civel Engineers, 1994. 25
Cunge, J. A.: Two-dimensional modeling of floodplains, in: Unsteady flow in open channels, Vol. 2, edited by: K. Mahood and V. Yevjevich, Water Resources Publications, Fort Collins, Colorado, USA, pp. 705–762, 1975.
HESSD
4, 211–241, 2007The effectiveness of polder systems on
the Elbe River S. Huang et al. Title Page Abstract Introduction Conclusions References Tables Figures ◭ ◮ ◭ ◮ Back Close
Full Screen / Esc
Printer-friendly Version
Interactive Discussion
EGU
De Roo, A.: The simulation of two polders for flood protection in the German part of the Oder catchment, European Communities, EUR 20739 EN, Joint Research Centre, Ispra, Italy, 2003.
DHI: MIKE 11 user manual, Danish Hydraulic Institute, Denmark, 1992.
DHI: MIKE21 user guide and reference manual, Danish Hydraulic Institute, Denmark, 1994. 5
Galland, J. C., Goutal, N., and Hervouet, J.-M.: TELEMAC – a new numerical-model for solving shallow-water equations, Advances in Water Resources, 14(3), 138–148, 1991.
Hesselink, A. W., Stelling, G. S., Kwadijk, J. C. J., and Middelkoop, H.: Inundation of a Dutch river polder, sensitivity analysis of a physically based inundation model using historic data, Water Resources Research, 39(9), 1234, 2003.
10
Huang, S., Vorogushyn, S., and Lindenschmidt, K.-E.: Quasi 2D hydrodynamic modelling of the flooded hinterland due to dyke breaching on the Elbe River, Adv. Geosci., accepted, 2007. IWK: Untersuchung von Hochwasserretentionsmaßnahmen entlang der Elbe im Bereich der
Landkreis Wittenberg und Anhalt-Zerbst (Kurzfassung), Institute f ¨ur Wasserbau und Kul-turtechnik, Universit ¨at Karlsruhe, 2004.
15
Lindenschmidt, K.-E., Rauberg, J., and Hohmann, R.: Stofftransport im Fluss- und Auenbereich bei Hochwasser: Quasi-2D hydrodynamische Simulation und Unsicherheitsanalyse, Gas-und Wasserfach: Wasser Gas-und Abwasser, 2006.
Saltelli, A., Chan, K., and Scott, E. M.: Sensitivity analysis, John Wiley & Sons, LTD, 2000. Vorogushyn, S., Apel, H., Lindenschmidt, K.-E., and Merz, B.: Coupling 1D hydrodynamic, dike 20
beach and inundation models for large-scale flood risk assessment along the Elbe River, Proceedings for 7th International Conference on Hydroinformatics HIC 2006, Nice, France, 4.–8. September 2006, Research Publishing Services, ISBN: 81-903170-2-4, pp. 481–488, 2007.
HESSD
4, 211–241, 2007The effectiveness of polder systems on
the Elbe River S. Huang et al. Title Page Abstract Introduction Conclusions References Tables Figures ◭ ◮ ◭ ◮ Back Close
Full Screen / Esc
Printer-friendly Version
Interactive Discussion
EGU
Table 1. Discharge statistics for the gages at Torgau and Lutherstadt Wittenberg (MQ – mean
discharge, MHQ – mean maximum annual flood, HQ – highest recorded flood event); source: Gew ¨asserk ¨undliches Jahrbuch, Elbegebiet Teil 1, 2003.
Discharge (m3/s)
Gage Elbe-km Series MQ MHQ HQ (date)
Torgau 154.2 1936–2003 344 1420 4420 (18 August 2002)
HESSD
4, 211–241, 2007The effectiveness of polder systems on
the Elbe River S. Huang et al. Title Page Abstract Introduction Conclusions References Tables Figures ◭ ◮ ◭ ◮ Back Close
Full Screen / Esc
Printer-friendly Version
Interactive Discussion
EGU
Fig. 1. 1-D hydrodynamic channel-junction (link-node) network allowing a 2-D spatial
HESSD
4, 211–241, 2007The effectiveness of polder systems on
the Elbe River S. Huang et al. Title Page Abstract Introduction Conclusions References Tables Figures ◭ ◮ ◭ ◮ Back Close
Full Screen / Esc
Printer-friendly Version
Interactive Discussion
EGU
Fig. 2. Variants of polders that have been proposed to be constructed along the middle reach
HESSD
4, 211–241, 2007The effectiveness of polder systems on
the Elbe River S. Huang et al. Title Page Abstract Introduction Conclusions References Tables Figures ◭ ◮ ◭ ◮ Back Close
Full Screen / Esc
Printer-friendly Version Interactive Discussion EGU Junction Channel Weir Flow direction E F G H I J K j h i e f1 f2 g Schwarze Elster Elbe Polder P1 Polder P3 Polder P4 Torgau Elbe-km 154.2 Pretzsch Elbe-km 184.5 Loeben Wittenberg Elbe-km 154.2 0 1 2 3 Kilometers Legend
Inundation due to dyke breach
Fig. 3. The study area of polders with the discretisation by junctions and channels and a
HESSD
4, 211–241, 2007The effectiveness of polder systems on
the Elbe River S. Huang et al. Title Page Abstract Introduction Conclusions References Tables Figures ◭ ◮ ◭ ◮ Back Close
Full Screen / Esc
Printer-friendly Version
Interactive Discussion
EGU
Fig. 4. Optimum control strategy for polder flooding and emptying to cap the peak discharge in
HESSD
4, 211–241, 2007The effectiveness of polder systems on
the Elbe River S. Huang et al. Title Page Abstract Introduction Conclusions References Tables Figures ◭ ◮ ◭ ◮ Back Close
Full Screen / Esc
Printer-friendly Version
Interactive Discussion
EGU
Fig. 5. Longitudinal profiles of the simulated and recorded values of the highest water levels
attained along the course of the Elbe River between Torgau and Wittenberg during the January 2003 flood event.
HESSD
4, 211–241, 2007The effectiveness of polder systems on
the Elbe River S. Huang et al. Title Page Abstract Introduction Conclusions References Tables Figures ◭ ◮ ◭ ◮ Back Close
Full Screen / Esc
Printer-friendly Version
Interactive Discussion
EGU
Fig. 6. Simulated and gage recordings of the water level at Pretzsch and Wittbenberg during
HESSD
4, 211–241, 2007The effectiveness of polder systems on
the Elbe River S. Huang et al. Title Page Abstract Introduction Conclusions References Tables Figures ◭ ◮ ◭ ◮ Back Close
Full Screen / Esc
Printer-friendly Version
Interactive Discussion
EGU
Fig. 7. Longitudinal profiles of the simulated and recorded values of the highest water levels
attained along the course of the Elbe River between Torgau and Wittenberg during the August 2002 flood event.
HESSD
4, 211–241, 2007The effectiveness of polder systems on
the Elbe River S. Huang et al. Title Page Abstract Introduction Conclusions References Tables Figures ◭ ◮ ◭ ◮ Back Close
Full Screen / Esc
Printer-friendly Version
Interactive Discussion
EGU
Fig. 8. Simulated and gage recordings of the water level at Pretzsch and Wittbenberg during
HESSD
4, 211–241, 2007The effectiveness of polder systems on
the Elbe River S. Huang et al. Title Page Abstract Introduction Conclusions References Tables Figures ◭ ◮ ◭ ◮ Back Close
Full Screen / Esc
Printer-friendly Version
Interactive Discussion
EGU
Fig. 9. Water levels in the river and polder system P 1+P3 with the weir breadth of 100 m. See
HESSD
4, 211–241, 2007The effectiveness of polder systems on
the Elbe River S. Huang et al. Title Page Abstract Introduction Conclusions References Tables Figures ◭ ◮ ◭ ◮ Back Close
Full Screen / Esc
Printer-friendly Version
Interactive Discussion
EGU
Fig. 10. Water levels in the river and polder system P 1+P3 with the weir breadth of 50 m. See
HESSD
4, 211–241, 2007The effectiveness of polder systems on
the Elbe River S. Huang et al. Title Page Abstract Introduction Conclusions References Tables Figures ◭ ◮ ◭ ◮ Back Close
Full Screen / Esc
Printer-friendly Version
Interactive Discussion
EGU
Fig. 11. Water levels in the river and P4 with the weir breadth of 50 m. See Fig. 3 for locations
HESSD
4, 211–241, 2007The effectiveness of polder systems on
the Elbe River S. Huang et al. Title Page Abstract Introduction Conclusions References Tables Figures ◭ ◮ ◭ ◮ Back Close
Full Screen / Esc
Printer-friendly Version
Interactive Discussion
EGU
HESSD
4, 211–241, 2007The effectiveness of polder systems on
the Elbe River S. Huang et al. Title Page Abstract Introduction Conclusions References Tables Figures ◭ ◮ ◭ ◮ Back Close
Full Screen / Esc
Printer-friendly Version
Interactive Discussion
EGU
HESSD
4, 211–241, 2007The effectiveness of polder systems on
the Elbe River S. Huang et al. Title Page Abstract Introduction Conclusions References Tables Figures ◭ ◮ ◭ ◮ Back Close
Full Screen / Esc
Printer-friendly Version
Interactive Discussion
EGU
Fig. 14. Percentage in volume reduction in each polder system by decreasing each parameter
HESSD
4, 211–241, 2007The effectiveness of polder systems on
the Elbe River S. Huang et al. Title Page Abstract Introduction Conclusions References Tables Figures ◭ ◮ ◭ ◮ Back Close
Full Screen / Esc
Printer-friendly Version
Interactive Discussion
EGU