HAL Id: hal-00296283
https://hal.archives-ouvertes.fr/hal-00296283
Submitted on 9 Jul 2007
HAL is a multi-disciplinary open access
archive for the deposit and dissemination of
sci-entific research documents, whether they are
pub-lished or not. The documents may come from
teaching and research institutions in France or
abroad, or from public or private research centers.
L’archive ouverte pluridisciplinaire HAL, est
destinée au dépôt et à la diffusion de documents
scientifiques de niveau recherche, publiés ou non,
émanant des établissements d’enseignement et de
recherche français ou étrangers, des laboratoires
publics ou privés.
Korea: impact of long range transport to a megacity
J. Y. Lee, Y. P. Kim
To cite this version:
J. Y. Lee, Y. P. Kim. Source apportionment of the particulate PAHs at Seoul, Korea: impact of long
range transport to a megacity. Atmospheric Chemistry and Physics, European Geosciences Union,
2007, 7 (13), pp.3587-3596. �hal-00296283�
Atmos. Chem. Phys., 7, 3587–3596, 2007 www.atmos-chem-phys.net/7/3587/2007/ © Author(s) 2007. This work is licensed under a Creative Commons License.
Atmospheric
Chemistry
and Physics
Source apportionment of the particulate PAHs at Seoul, Korea:
impact of long range transport to a megacity
J. Y. Lee and Y. P. Kim
Dept. of Environmental Science and Engineering, Ewha Womans University, Seoul, Korea Received: 22 November 2006 – Published in Atmos. Chem. Phys. Discuss.: 29 January 2007 Revised: 14 May 2007 – Accepted: 27 June 2007 – Published: 9 July 2007
Abstract. Northeast Asia including China, Korea, and Japan
is one of the world’s largest fossil fuel consumption regions. Seoul, Korea, is a megacity in Northeast Asia. Its emissions of air pollutants can affect the region, and in turn it is also affected by regional emissions. To understand the extent of these influences, major sources of ambient particulate PAHs in Seoul were identified and quantified based on measure-ments made between August 2002 and December 2003. The chemical mass balance (CMB) model was applied. Seven major emission sources were identified based on the emis-sion data in Seoul and Northeast Asia: Gasoline and diesel vehicles, residential coal use, coke ovens, coal power plants, biomass burning, and natural gas (NG) combustion. The ma-jor sources of particulate PAHs in Seoul during the whole measurement period were gasoline and diesel vehicles, to-gether accounted for 31% of the measured particulate PAHs levels. However, the source contributions showed distinct daily and seasonal variations. High contributions of biomass burning and coal (residential and coke oven) were observed in fall and winter, accounting for 63% and 82% of the to-tal concentration of PAHs, respectively. Since these sources were not strong in and around Seoul, they are likely to be re-lated to transport from outside of Seoul, from China and/or North Korea. This implies that the air quality in a mega-city such as Seoul can be influenced by the long range transport of air pollutants such as PAHs.
1 Introduction
Polycyclic aromatic hydrocarbons (PAHs) are ubiquitous or-ganic pollutants mainly formed during incomplete combus-tion processes of fossil fuels. Some of PAHs which mainly exist in the particle phase in the atmosphere are reported
Correspondence to: Y. P. Kim
to be probable human carcinogens. Moreover, transforma-tions of PAHs on particles such as nitro-PAHs are more toxic than parent PAHs (Marr et al., 2006). Thus, the studies for the PAHs in atmosphere have been progressed for more than 30 years and PAHs are designated as one of the considered Persistent Toxic Substances (PTS) in central and northeast Asia (Region VII) under the Stockholm convention (UNEP, 2002). Recently, it was reported that heterogeneous reactions of particulate PAHs could change the particle hydrophilicity in cloud processing (Marr et al., 2006).
The impact of air pollution in Northeast Asia to the region itself and all over the world has been recognized well. In addition, Northeast Asia is the world’s largest coal consump-tion region (IEA, 2006). Thus, it has been speculated that emissions and the impact of PAHs would be large from this region.
Since Seoul, Korea is one of the megacities in Northeast Asia with 10 million inhabitants and 2.5 million vehicles, the large emission of PAHs from Seoul itself might be expected. In addition, South Korea is surrounded by China and Japan as shown in Fig. 1, and Seoul might be influenced by transport of air pollutants from these areas in addition to local sources. Thus, understanding the contribution of the various emission sources to the ambient PAHs level in Seoul is essential in order to assess public exposure to PAHs and their associated health risk in Northeast Asia. Moreover, characterizing the emission sources of the ambient PAHs in Seoul will help to understand the effect of PAHs emission and transport from the megacities in this region.
In Korea, the criteria air pollutants such as SO2, NOx, CO,
O3, and PM10 (particulate matter with the aerodynamic
di-ameter less than or equal to 10 µm) have been monitored extensively at 198 stations in 2004 (MOE, 2005). However, monitoring of PAHs in Korea has not been well established compared to the criteria air pollutants and their levels have been reported by only few studies (Bae et al., 2002; Park et al., 2002; Lee et al., 2006ab). Bae et al. (2002) and Lee et
95 100 105 110 115 120 125 130 135 140 145 25 30 35 40 45 50 GY Korea China SE PH Japan SE Sampling site (37° 33´N, 126° 56´E)
Fig. 1. Map of the sampling site (SE) and coke oven locations (PH
and GY) in Korea (SE: Seoul, PH: Pohang, GY: Gwangyang).
al. (2006a) have measured the size distributions of particu-late PAHs and their dry depositions in 1999 in several areas of Korea. They found that the ambient levels and dry depo-sition amounts of PAHs in rural areas were comparable to those in Seoul. Park et al. (2002) measured gaseous and par-ticulate PAHs concentrations using a TSP sampler at Seoul during four intensive sampling periods. However, in these studies, identifications of sources to the ambient PAHs con-centrations have not been carried out. Further, trend of the PAHs level was not identified in these studies.
Receptor models have been widely used as a tool in air pol-lution source apportionment studies. In the receptor model, the contributions from major sources are apportioned from the concentration profiles of pollutants found at a specific re-ceptor site. Fundamentals of the rere-ceptor models have been described by Friedlander (1973) and Hopke (1991). The chemical mass balance (CMB) model is a class of receptor model. On the basis of the law of mass conservation, the CMB model calculation seeks to find the best-fit linear com-bination of the chemical compositions of the effluents from specific emission sources that is needed to reconstruct the chemical composition of chosen atmospheric samples (US EPA, 2004). The CMB model had been applied to the PAHs levels for some studies (Duval et al., 1982; Li et al., 2003). In addition, some CMB applications for ambient organic pollu-tants including PAHs as tracers for combustion sources were attempted in Beijing (Zheng et al., 2005) and southern Cal-ifornia (Schauer et al., 1996). However, in Korea, no study has been carried out to apportion the major sources of PAHs. The objectives of this study are to understand the contri-bution of the major sources for PAH at Seoul by applying the CMB model and to quantify the impact of regional transport of PAHs to the air quality in Seoul.
2 Measurement data
Samples were collected on a 3 m high platform on the roof of Asan hall in Ewha Womans University, a five-story building of 15 m height. It is adjacent to a road in west, Mt. Ansan in north, and stands on a hill commanding the campus. The sampling and analytical procedure used in this study was de-scribed in detail in Lee et al. (2006b).
Sampling was carried out for 24 h at every sixth day with no rain from August 2002 to December 2003. Total of 68 samples were obtained. The sampling procedures used in this study conformed to the methods of TO-13A (US EPA, 1999). In brief, a high volume TSP sampler (Ticsh, TE-1000)
was operated at a calibrated flow rate of 0.225 m3min−1
to obtain a total sample volume of greater than 300 m3
over the 24 h period. Particles were collected on the
pre-baked (at 400◦C for 5 h) quartz fiber filters (QFFs,
What-man, QM-A, 10.16 cm diameter). Particulate PAHs sam-ples collected on the QFFs were extracted by ultrasonica-tion with dichloromethane solvent. The extracts were fil-trated through a 0.45 µm pore size syringe filter. These
ex-tracts were concentrated at 20◦C to a volume of 1 mL using
an evaporator (Zymark, Turbovap 500). Then
phenanthrene-D10 was added to each concentrated sample solution as an
internal standard for analysis. Seventeen PAHs compounds were identified and quantified using a Hewlett Packard 5890 gas chromatograph (GC) equipped with a 5972 mass selec-tive detector (MSD). The names of the analyzed PAH com-pounds and their abbreviations are given in Table 1. The QFFs field blanks were prepared and analyzed for each set of field samples with the same procedure. The extraction re-covery for particulate PAHs are determined by spiking the PAHs standard solution (17 compounds) in the pre-extracted QFFs and the mean extraction recovery ranges from 80 to 94 %. These recoveries are accounted for in the concentration calculation. The accuracy of the analytical procedure was tested through the analysis of National Institute of Standards and Technology (NIST, USA) standard reference materials (SRM) 1649 urban dust sample. The extraction recoveries and analytical accuracy results for the SRM 1649 samples are also presented in Table 1.
In this study, 17 PAH compounds were identified and quantified. However, Nap, Ace, Acy, and Flu exist predomi-nantly in the gas phase in the atmosphere. Because the major focus of this study is on the particulate PAHs concentration, these compounds are excluded for further data analysis.
3 CMB Modeling and identification of major sources
The CMB 8.2 program (US EPA, 2004) was used to esti-mate the source contribution of the ambient concentrations for the particulate PAHs. In running the CMB 8.2 model, de-fault values were used for the option sets such as the iteration delta, the maximum source uncertainty and the minimum
J. Y. Lee and Y. P. Kim: ’Major sources of the PAHs at Seoul 3589
Table 1. Particulate PAHs extraction recovery and analysis results of the NIST SRM-1649 urban dust samples.
PAH compounds Abbrev. Recovery (%) Certified value Measured value (µg kg−1) (µg kg−1) Phenanthrene Phen 80 4.14±0.37 4.67±0.49 Anthracene Anthr 90 0.43±0.08 0.46±0.06 Fluoranthene Flt 91 6.45±0.18 5.50±0.18 Pyrene Pyr 94 5.29±0.25 4.37±0.22 Benz(a)anthracene BaA 83 2.21±0.07 1.84±0.59 Chrysene Chry 87 3.05±0.06 3.67±0.54 Benzo(b)fluoranthene BbF 90 6.45±0.64 5.43±0.40 Benzo(k)fluoranthene BkF 86 1.91±0.03 2.27±0.29 Benzo(e)pyrene BeP 84 – – Benzo(a)pyrene BaP 86 2.51±0.09 2.92±0.82 Indeno(1,2,3-c,d)pyrene Ind 88 3.18±0.72 2.87±0.66 Dibenz(a,h)anthracene DahA 92 0.29±0.02 0.35±0.04 Benzo(g,h,i)perylene BghiP 88 4.01±0.91 3.68±0.69
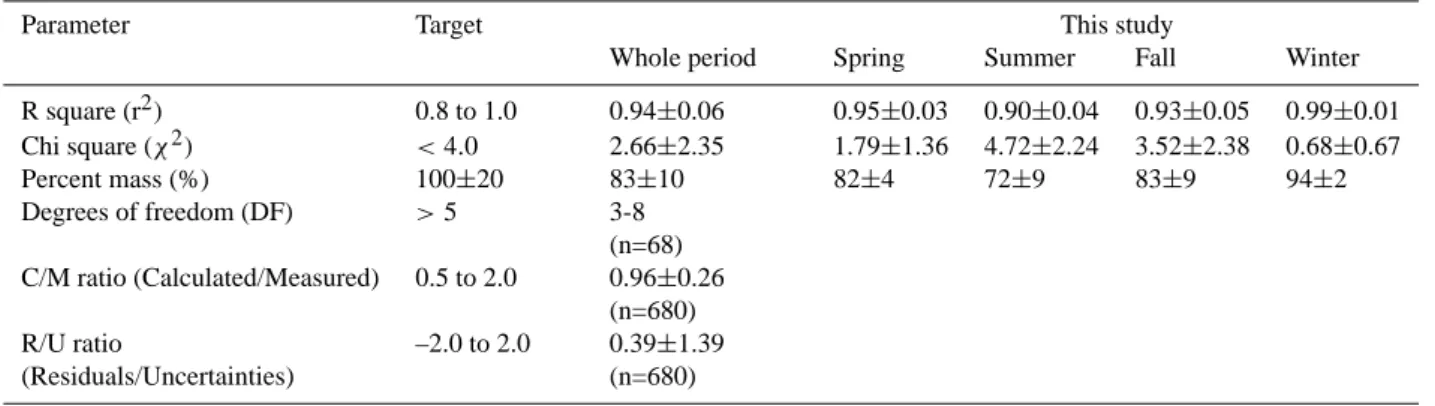
Table 2. Target values and modeling result values for the model performance measures (target values were set by US EPA, 2004).
Parameter Target This study
Whole period Spring Summer Fall Winter R square (r2) 0.8 to 1.0 0.94±0.06 0.95±0.03 0.90±0.04 0.93±0.05 0.99±0.01 Chi square (χ2) <4.0 2.66±2.35 1.79±1.36 4.72±2.24 3.52±2.38 0.68±0.67 Percent mass (%) 100±20 83±10 82±4 72±9 83±9 94±2 Degrees of freedom (DF) >5 3-8 (n=68) C/M ratio (Calculated/Measured) 0.5 to 2.0 0.96±0.26 (n=680) R/U ratio (Residuals/Uncertainties) –2.0 to 2.0 0.39±1.39 (n=680)
source projection. The option of source elimination was ap-plied in all results. The diagnostics for the results explained by the CMB model (US EPA, 2004) are given in Table 2.
To select probable major sources of PAHs affecting to the air in Seoul, major combustion and related activities at Seoul and Northeast Asia are investigated. The Ministry of Envi-ronment (MOE) in Korea has limited the use of solid fuel and heavy oils for heating and cooking in the Seoul metropoli-tan areas since 1985 and strongly enforced the rule since 1995 (MOE, 2005). Thus, the amount of coal consumption for residential, industrial, and commercial sectors at Seoul has been rapidly decreased since 1990 and the usage of coal has been negligible since 1995. The amount of natural gas (NG) consumption at Seoul has been rapidly increased since 1990. The amount of petroleum consumption at Seoul has not been changed much since 1990 (MOCIE, 2004). The ma-jor types for petroleum were butane (26%), gasoline (25%), diesel (24%), and propane (14%) at Seoul in 2003. These had been mainly used in transportation sector (94% of
bu-tane consumption, 99% of gasoline consumption, and 84% of diesel consumption were used for transportation (MOCIE, 2004)). Sixty percent of the total number of vehicles used gasoline vehicle at Seoul followed by diesel (27%) and liq-uefied petroleum gas (LPG) (12.5%). The major component of LPG was butane and LPG was mainly used for taxi cabs. About 66% of NG was used in residential sector (heating, cooking, and others) and 22% in commercial sector at Seoul in 2003 (MOCIE, 2004). Thus, the main fossil fuels used at Seoul were petroleum for vehicles and NG for residential heating and cooking.
Since Seoul might be affected from the emissions from China, Korea (including North Korea), Japan, the trends of the fossil fuel combustions in China, Japan, and Korea should be studied. The amounts of coal consumption in Japan and Korea have not been changed much since 1990. However, that in China has been rapidly increased since 2000. More-over, the consumption of coal in China was the first in the world (about 34% of the world consumption in 2003) and
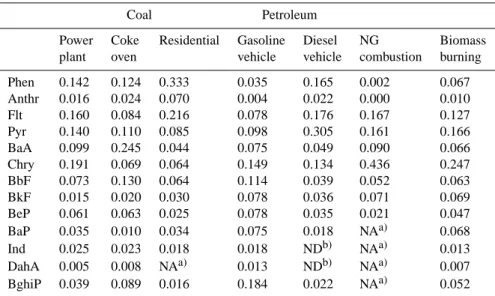
Table 3. Source composition of individual PAH compounds in the particle phase used for source profiles.
Coal Petroleum
Power Coke Residential Gasoline Diesel NG Biomass plant oven vehicle vehicle combustion burning Phen 0.142 0.124 0.333 0.035 0.165 0.002 0.067 Anthr 0.016 0.024 0.070 0.004 0.022 0.000 0.010 Flt 0.160 0.084 0.216 0.078 0.176 0.167 0.127 Pyr 0.140 0.110 0.085 0.098 0.305 0.161 0.166 BaA 0.099 0.245 0.044 0.075 0.049 0.090 0.066 Chry 0.191 0.069 0.064 0.149 0.134 0.436 0.247 BbF 0.073 0.130 0.064 0.114 0.039 0.052 0.063 BkF 0.015 0.020 0.030 0.078 0.036 0.071 0.069 BeP 0.061 0.063 0.025 0.078 0.035 0.021 0.047 BaP 0.035 0.010 0.034 0.075 0.018 NAa) 0.068 Ind 0.025 0.023 0.018 0.018 NDb) NAa) 0.013 DahA 0.005 0.008 NAa) 0.013 NDb) NAa) 0.007 BghiP 0.039 0.089 0.016 0.184 0.022 NAa) 0.052
a)NA: Not analyzed,b)ND: Not detected.
1) The values of source composition for individual PAH compounds were normalized to total PAHs concentration in each source.
2) References for the source profiles: Coal for power plant and residential – Li et al. (2003), coke oven – Yang et al. (2002), gasoline and diesel vehicles – Rogge et al. (1993a), NG combustion - Rogge et al. (1993b), and biomass burning – Rogge et al. (1998).
about one order higher than those in Korea and Japan (BP,
2005). Thus, the influence of PAHs emission from coal
combustions in China might influence the PAHs level in Ko-rea significantly. Coal was mainly used for industry (49%), power plant (37%), and residential (14%) at China in 1995 (Streets et al., 2001). Streets et al. (2001) reported that black carbon (BC) emissions arose primarily from the production and use of coke in the steel industry and from uncontrolled coal-fired stokers in the industry sector. Because PAHs are associated with BC, coke oven in steel work might be an im-portant source of PAHs in the industry sector.
In case of petroleum, the amounts of petroleum consump-tion in Japan and Korea have not been changed much while that in China has been constantly increased since 1990. To-tal consumption of petroleum in Japan has been three or four times higher than in China and Korea in the early 1990s, but, petroleum consumption in China became larger than that in Japan in 2003. The fractions of the petroleum consumption in China and Japan in 2003 were 8.2 and 6.4% of the world consumption, respectively (BP, 2005). The major product groups for petroleum consumption in China and Japan were gasoline and middle distillates (about 57 and 68% of the to-tal petroleum consumption, respectively) in 2003 (BP, 2005). Gasoline sector consisted of aviation and motor gasoline and light distillate feedstock. Middle distillates sector consisted of jet and heating kerosene, and gas and diesel oils. Al-though some heating fuels were included in the gasoline and middle distillates sectors, majority of petroleum be con-sumed for transportation, especially, gasoline and diesel
ve-hicles. In Korea, major products for petroleum consumption were naphtha (35% of the total consumption), diesel (20%), bunker-C (15%), and gasoline (8%) in 2003 (MOCIE, 2005). The NG consumption in Japan has been about three times higher than those in China and Korea since 1990.
Biomass burning activities have been wide spread in Asia; field burning after harvest, biofuel burning in rural areas for heating and cooking, and forest fire (Streets et al., 2003; Zheng et al., 2005; Lee et al., 2006a). The estimated annual amounts of biomass burned in whole Asia, China, Japan, and Korea were 727.3, 187, 3, and 1.9 Tg per year (Streets et al, 2003). China emitted 25.6% of the total biomass emissions in Asia. Thus, high contribution from biomass burning for PAHs in Northeast Asia including Seoul might be also ex-pected.
Based on the fuel consumption patterns at Seoul and the countries in Northeast Asia, seven major PAHs sources were selected; petroleum for (1) gasoline and (2) diesel vehi-cles, coal for (3) residential heating, (4) coke oven emission, and (5) power plant, NG for (6) residential heating, and (7) biomass burning.
Fully developed local source profiles for Seoul and North-east Asia are not available and the profiles in each coun-try should be different. Thus, in this study, the best avail-able estimates of the source profiles from previous studies in worldwide were adopted based on the CMB modeling per-formance. Catalyst-equipped gasoline vehicle profile is used because leaded gasoline has been phased out since 1988 at Seoul (MOE, 2005). In China, Euro I emission standard
J. Y. Lee and Y. P. Kim: ’Major sources of the PAHs at Seoul 3591 for whole China and Euro II standard for metropolitan areas
were adopted (He et al., 2001). Butane was one of the major petroleum products used in Seoul for transportation. How-ever, there is no available source profile for butane. Since the estimated PAHs emission amount from LPG consisting of butane was about one-tenth of that from gasoline in Korea (SNU, 2000) and the combustion efficiencies for butane and NG are very high, we did not include it in the analysis.
The source profiles of coal related emissions were ob-tained from Li et al. (2003) for power plant and residential and from Yang et al. (2002) for coke oven. The source pro-files for gasoline and diesel vehicles were from Rogge et al. (1993a), biomass burning from Rogge et al. (1998), and NG combustion from Rogge et al. (1993b). These source profiles used in this study are summarized in Table 3. The source profiles are fractional compositions of individual PAH compounds and, thus, the sum of source profile value for all PAH compounds is unity for each of the sources.
For a CMB model result being accurate, three factors should be accounted for; the assumption of non reactivity of the species of concern; the accuracy of the measurement data; and the reliability of the used source profiles.
In this study, to account for the loss of PAHs concentra-tions due to photodegradation and/or ozonolysis of the PAHs, the concentrations of individual PAHs compounds were nor-malized to that of BeP since photodegradation and ozonoly-sis of BeP would not be large compared to other compounds. For example, half-live of BeP under the simulated atmo-spheric condition was one order higher than that of BaP and Anthr (Katz et al., 1979). Furthermore, due to the lack of suf-ficient data for DahA and Ind in the used source profiles and strong photodegradation of BaP and Anthr, these compounds were not selected as the fitting species in running the model. Even with these considerations, there is still a possibility that the some species, especially, low molecular species, might undergo degradation processes that might change the mod-eling result. However, if the low molecular compounds are not included, the model performance might not be satisfac-tory such as the DF value not satisfying the suggested range. Thus, with PAHs compounds only, it is inevitable to include low molecular compounds for the CMB model application.
The uncertainties for the ambient data were set as 15% (the variation of the measurement) of the concentration for indi-vidual PAH compounds since the uncertainty for the method detection limit (MDL) values of individual PAH compounds were very small. Another possible problem that might af-fect the modeling result is the sampling artifacts. The sam-pling artifacts for particulate PAHs could be occurred due to gas/particle transport during the sampling. Thus, the sam-pling artifacts are higher in summer when temperature is high. They are classified into postive and negative artifacts. According to a research by Simcik et al. (1999) who has used a backup filter to quantify negative artifacts during sampling, the negative artifacts were small, about 2∼5% of the mea-sured particulate PAHs concentration. Though we did not
carry out correction for the sampling artifacts, the assigned uncertainty value of 15% for the ambient concentration of PAHs seemed to be enough to account for the sampling arti-facts.
The source profiles used in this study contained only par-ticulate phase PAHs. For uncertainties of the source profiles, 15% of the reported values were used since no information was reported on the accuracy of the values (Na, 2001; Zheng et al., 2005). As will be discussed in 4.2 and 4.3, for some sources there are several source profiles available. The se-lection criterion for the source profile in this study was the model performance. In other words, the source profile which gave the best model performance was selected. It is desirable that source profile obtained from that source area (for exam-ple, coal combustion source profiles obtained from China) be used. However, the coal composition in China might vary significantly depending on the source areas. Further, the re-liability of the profiles from source regions might be in ques-tion. Therefore, we set the selection criterion of the model performance for the source profiles.
4 Results and discussion
4.1 General characteristics
During the modeling, collinearity problem was not observed due to the distinctively different marker species of the each source profiles. For example, the concentration of Phen is high in coal residential source profile, BghiP and Pyr for gasoline and diesel vehicles, and Chry for natural gas. Also, low molecular compounds are higher for coal power plant, middle molecular compounds for coal coke overn, and Flt and Pyr for biomass burning. The statistical values for the model performance of this study are arranged in Table 2. Ex-cept summer and for the three samples in winter, all of the statistical values in this study are in the acceptable ranges. In summer, due to the high photochemical reactions, these variations are out of range values. The degrees of freedom (DF = number of fitting species – number of fitting sources) are small (ranged from 3 to 8 in all results (n=68)) since the number of fitting species are limited. For three samples in winter, the DF value of 3 is obtained due the number of fitted sources being higher than other samples. Due to the problem to accurately separate the contribution of gasoline and diesel vehicle emission at Seoul using the source profiles for USA, the sum of the contributions of gasoline and diesel vehicles is reported as transportation in this study.
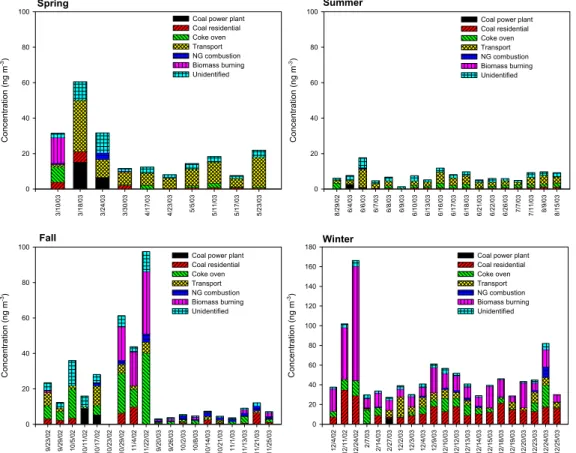
Six sources for particulate PAHs at Seoul in each sam-pling day are identified as shown in Fig. 2 and for the whole sampling period in Fig. 3. There is a wide variance of the contributions of six sources in each sample. For the whole sampling period, the major sources of particulate PAHs were transportation (31±22%), coke oven (16±7%), coal
resi-dential (15±9%), and biomass burning (14±15%). NG
Winter 1 2 /4 /0 2 1 2 /1 1 /0 2 1 2 /2 4 /0 2 2 /7 /0 3 2 /1 4 /0 3 2 /2 7 /0 3 1 2 /2 /0 3 1 2 /3 /0 3 1 2 /4 /0 3 1 2 /9 /0 3 1 2 /1 0 /0 3 1 2 /1 2 /0 3 1 2 /1 3 /0 3 1 2 /1 4 /0 3 1 2 /1 5 /0 3 1 2 /1 8 /0 3 1 2 /1 9 /0 3 1 2 /2 0 /0 3 1 2 /2 3 /0 3 1 2 /2 4 /0 3 1 2 /2 5 /0 3 C o n c e n tra ti o n ( n g m -3) 0 20 40 60 80 100 120 140 160 180
Coal power plant Coal residential Coke oven Transport NG combustion Biomass burning Unidentified Spring 3 /1 0 /0 3 3 /1 8 /0 3 3 /2 4 /0 3 3 /3 0 /0 3 4 /1 7 /0 3 4 /2 3 /0 3 5 /5 /0 3 5 /1 1 /0 3 5 /1 7 /0 3 5 /2 3 /0 3 C o n ce n tr a ti o n ( n g m -3) 0 20 40 60 80 100
Coal power plant Coal residential Coke oven Transport NG combustion Biomass burning Unidentified Summer 8 /2 9 /0 2 6 /4 /0 3 6 /6 /0 3 6 /7 /0 3 6 /8 /0 3 6 /9 /0 3 6 /1 0 /0 3 6 /1 3 /0 3 6 /1 6 /0 3 6 /1 7 /0 3 6 /1 8 /0 3 6 /2 1 /0 3 6 /2 2 /0 3 6 /2 6 /0 3 7 /7 /0 3 7 /1 1 /0 3 8 /9 /0 3 8 /1 5 /0 3 C o n ce n tr a ti o n ( n g m -3) 0 20 40 60 80 100
Coal power plant Coal residential Coke oven Transport NG combustion Biomass burning Unidentified Fall 9 /2 3 /0 2 9 /2 9 /0 2 1 0 /5 /0 2 1 0 /1 1 /0 2 1 0 /1 7 /0 2 1 0 /2 3 /0 2 1 0 /2 9 /0 2 1 1 /4 /0 2 1 1 /2 2 /0 2 9 /2 0 /0 3 9 /2 6 /0 3 1 0 /2 /0 3 1 0 /8 /0 3 1 0 /1 4 /0 3 1 0 /2 1 /0 3 1 1 /1 /0 3 1 1 /1 3 /0 3 1 1 /2 1 /0 3 1 1 /2 5 /0 3 C o n c e n tra ti o n ( n g m -3) 0 20 40 60 80 100
Coal power plant Coal residential Coke oven Transport NG combustion Biomass burning Unidentified
Fig. 2. The trend of source contributions for particulate PAHs at Seoul in each sampling day (the range of y-axis in winter is different from
that in other seasons).
1 % 1 % 1 % % 1% 1 % % i i NG i i i i i i
Fig. 3. The fraction of the source contributions for particulate PAHs
at Seoul for the whole sampling period.
combustion (4±6%) and coal power plant (3±1%) were mi-nor sources for the PAHs level at Seoul on the annual base. Even on the seasonal base, the contributions from the coal power plant and NG were small. This is due to the high effi-ciency of combustion and particle control equipments in coal power plants and high efficiency combustion in NG combus-tion. The small contribution of NG combustion was also
found by Zheng et al. (2002) and Schauer et al. (1996) in southeastern US. Thus, it is likely that the contribution from LPG be also small as stated in Sect. 3.
Zheng et al. (2005) carried out a source apportionment study for Beijing, China with more than 100 organic carbon (OC) species including some PAH compounds. The major sources for OC species in Beijing were gasoline and diesel vehicles (17.3±6.9%), biomass burning (16.1±18.1 %), dust (11.7±8.1%), and coal combustion (9.8±3.9%). The contri-bution of vehicles for OC species was also the highest on the annual base in Zheng et al. (2005).
The source contributions showed distinct seasonal varia-tion (Fig. 4). The PAHs concentravaria-tions from transportavaria-tion
emissions varied widely from 2.30 to 10.3 ng m−3(10∼49%
of the total PAHs concentrations) at Seoul. The transporta-tion emissions were most distinctive in spring (49%).
J. Y. Lee and Y. P. Kim: ’Major sources of the PAHs at Seoul 3593
4.2 Effect of biomass burning
The contribution of biomass burning was distinct in fall
and winter, accounting for 4.51 ng m−3 (21%) in fall and
20.3 ng m−3 (40%) in winter, respectively. No significant
biomass burning contributions for PAHs was found in spring or summer. The importance of the biomass burning to the air quality in Northeast Asia was reported by several measure-ment and emission estimation studies related to the frequent biomass burning activities after harvest during fall (He et al., 2001; Zheng et al., 2005; Lee et al., 2006a). Also, forest fires were frequent in spring all over Northeast Asia (Lee et al., 2005). However, the highest biomass burning contribu-tion for PAHs was estimated in winter in this study.
In order to verify the contribution of biomass burning in fall and winter, we tried to find other particulate PAHs emis-sion profile for biomass burning and only one suitable data set was obtained from Schauer et al. (2001). Recently, some studies for biomass burning profile including PAH com-pounds were reported in Europe, but these showed the re-sult of total (gas + particle) PAHs profile (e.g, Hedberg et al., 2002; Ross et al., 2002). When the source profile from Schauer et al. (2001) was used instead of the profile used in this study, the source contributions for particulate PAHs was also high in fall and winter with comparable model performance indices. On the average, the biomass burning contribution changed from 14% to 11% when the profile of Schauer et al. (2001) was used.
Forest fires during the sampling days in spring and sum-mer were not distinctly observed in Northeast Asia (ATSR world fire atlas in Ionia web site, http://dup.esrin.esa.int/ ionia/wfa/index.asp). Thus, it might be related to the heavy usage of biofuel during winter rather than forest fires in Northeast Asia, especially, in China. Biofuel dominated ru-ral residential energy supply and BC emission from biofuel was estimated to 45% of total in residential sector in China. Moreover, the BC emission from biomass burning in residen-tial sector in China was about seven times higher than that in field combustion (Streets et al., 2001).
The remaining question is the degree of contribution from China for biomass burning. An indirect indicator is the PAHs level observed at Gosan, a background site in Korea. Lee et al. (2006b) reported that the average level of particulate PAHs in cold period (from November to March between
2001 and 2004) was 6.43±5.74 ng m−3with the maximum
value of 20.9 ng m−3. They claimed that most of the
ob-served PAHs were from China based on the backward tra-jectory analysis and the ratio values of individual PAH com-pounds. This concentration level observed at Gosan is lower than the estimated average value of biomass contribution in
winter (20.3 ng m−3)at Seoul. Thus, it suggests that not all
of the estimated biomass burning contribution in winter at Seoul was influenced by China and/or the transport pattern from China to Seoul was different from that to Gosan due to shorter distance between China and Seoul.
Sp ri n g Su mme r F a ll W in te r C o n c e n tra ti o n ( n g m -3) 0 10 20 30 40 50 60
Coal power plant Coal residential Coke oven Transport NG combustion Biomass burning Unidentified
Fig. 4. Seasonal source contributions to particulate PAHs at Seoul.
One possible PAHs source affecting Seoul is North rea. The information for the biomass burning in North Ko-rea is not available, but, high emission of PAHs from biofuel in North Korea is also expected during winter. According to the report of International Energy Agency (IEA, 2006), the amount of primary solid biomass used for fuel in 2003 was 42 795 GWh in North Korea, about three times higher than that in South Korea, although the oil consumption in North Korea is far lower than that in South Korea, 1680 and
208 264×103tonnes, respectively (IEA, 2006). In the report
of IEA (2006), there is no consumption of NG in 2003 in North Korea.
4.3 Effect of coal combustion
The contribution of coal for residential usage increased dras-tically in winter (28 %) compared to other seasons (8–10%).
The amount of coal residential in winter (13.7 ng m−3)was
about one order higher than that in other season (0.62–
2.14 ng m−3)mainly due to the increase of the coal usage
for residential heating. This finding is in agreement with the result by Zheng et al. (2005), in which the importance of coal combustion became obvious in January accounting 13.9% of the measured OC species in January at Beijing. However, in the result of Zheng et al. (2005), the contribution of coal combustion was also high in October (12.7%). In this study, the contribution of coal residential was relatively low in fall (10%) compared to winter (28%). This is probably due to the impact of coal combustion in Beijing being local emissions while that Seoul being transport from outside.
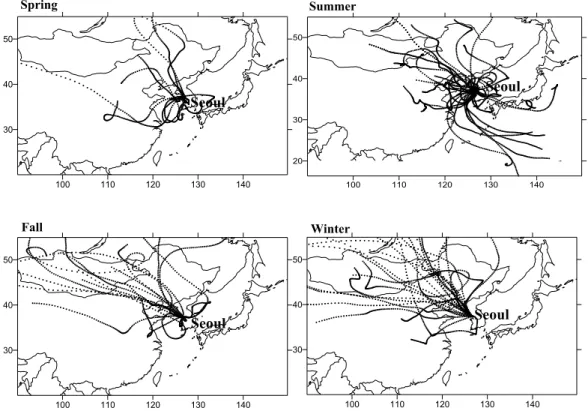
The major fossil fuel for residential heating at Seoul and surrounding areas is NG. Thus, the influence of PAHs emis-sion from coal residential might be transported from the out-side of Korea, especially from China due to the high con-sumption of coal for residential heating and cooking (He et al., 2001; Streets et al., 2001) and dominant wind direction
100 110 120 130 140 30 40 50 100 110 120 130 140 20 30 40 50 Spring Summer Seoul Seoul 100 110 120 130 140 30 40 50 100 110 120 130 140 30 40 50 Fall Winter Seoul Seoul
Figure 5. Typical air parcels movement arriving at Seoul during the sampling days in each season.
Fig. 5. Typical air parcels movement arriving at Seoul during the sampling days in each season.
being the westerly and northwesterly during winter as shown in Fig. 5. The backward trajectory of air parcels were cal-culated for 0900 LT (sampling starting time) on the sam-pling days using the Hybrid Single-Particle Lagrangian Inter-grated Trajectory (HYSPLIT4) model (http://www.arl.noaa. gov/ready/hysplit4.html) developed in National oceanic and atmospheric administration (NOAA).
Moreover, the contribution of PAHs from coal in North Korea might be significant. The coal consumption in South Korea was two times higher than that in North Korea, but, about 89% of total coal was consumed at power plants in South Korea (IEA, 2006). In North Korea, about 85% of total coal was consumed by industry sector and the coal consump-tion from industry sector in North Korea was three times higher compared to South Korea (IEA, 2006). As mentioned in section 4.1, the emission of PAHs from the coal combus-tion power plant was small due to high combuscombus-tion efficiency and particle control equipments. Thus, the contribution of coal combustion from South Korea might be small. There is a possibility that a significant fraction of the contribution from coal combustion be from North Korea in addition to the contribution from biomass burning.
The high contribution of PAHs concentrations from coke
oven was observed in fall (6.64 ng m−3, 31%) and winter
(6.98 ng m−3, 14%). In Korea, two steel works having coke
oven were located at south-east (Pohang) and south-west (Gwangyang) of Korea as shown in Fig. 1. The main
di-rections of the wind at Pohang and Gwangyang were from southwest and northwest, respectively. In China, represen-tative steel works are mainly located near to Beijing and Shanghai (Price et al., 2002). Moreover, the prevailing wind was the northwesterlies observed during the sampling period in fall and winter as shown in Fig. 5. The wind directions were variable in spring and summer. According to Streets et al. (2001), the BC emissions from coal in industry sector were 84% of total in China and this were mainly related to the production and use of coke in the steel works. Thus, it might be related to the transport from China not rather than the influence of local emissions in Korea. Also, the influence of coke oven emission from North Korea is expected.
Because the coal residential profile used in this study was obtained for Europe, these might not be an accurate indica-tor to explain the influence from China. Thus, we tried to find PAHs emission profile from residential coal combustion measured in Northeast Asia, especially in China and only one suitable data set was obtained from Chen et al. (2004). When the source profile from Chen et al. (2004) was used instead of the profile used in this study, the seasonal trend of the source contributions for particulate PAHs was similar with this study result. When using the profile of Chen et al. (2004), the con-tribution of coal increased with reduced unidentified. But,
there were some statistical problems such as the values of χ2
being higher and the percent mass value having higher devia-tions. It indicates that some PAH compounds concentrations
J. Y. Lee and Y. P. Kim: ’Major sources of the PAHs at Seoul 3595 were not well explained by the source contribution estimates
of Chen et al. (2004). Thus, the source profile for coal resi-dential shown in Table 3 by Li et al. (2003) was used in this study.
4.4 Implications
The high concentrations of particulate PAHs in winter at Seoul were mainly due to the increase of the emissions from biomass burning, the coal residential heating, and coke oven. These account for 82% of the total PAHs concentration and mainly transported from outside of Seoul, especially China. Moreover, the influence of PAHs emission from North Korea is expected.
Seoul is the largest city in Korea, still the long range trans-port of air pollutants such as PAHs was clearly observed. Therefore, in order to control the level of hazardous air pol-lutants such as PAHs at Seoul, the transport from outside as well as the local emission source must be considered. This finding is also appicable for other megacities in Northeast Asia. Further, the international convention such as Stock-holm convention should be needed for managing the level of PTS and health effect in global environment.
Another implication is the potential impacts on climate change such as radiation balance because PAHs are associ-ated with BC particles and the atmospheric behavior of PAHs is changed by the long range transport from Northeast Asia.
It is important to note that application of local source pro-files is the key for reliable CMB results. Uncertainty is in-evitable when not using source profiles from local sources. Thus, further study is warranted to reduce the uncertainties related to the source profiles.
5 Summary
Seoul proper is a large city and surrounded by China and Japan which have several megacities. Thus, Seoul might be influenced by transport of air pollutants from these areas in addition to local sources. The CMB model was used to ap-portion the major sources of particulate PAHs observed be-tween 2002 and 2003 at Seoul based on the patterns of fossil fuel consumption in Seoul and Northeast Asia. The major source of particulate PAHs at Seoul for the whole sampling period was gasoline and diesel vehicles accounting for 31% of total particulate PAHs. The source contributions of PAHs showed distinct seasonal variation. Coal emission (residen-tial and coke oven) and biomass burning became important in fall (63% of total PAHs) and winter (82% of total PAHs). Since these sources were strong in China and the prevail-ing wind was the northwesterlies observed durprevail-ing samplprevail-ing period in fall and winter, it might be transported from the outside of Korea, especially from China. Moreover, the in-fluence of PAHs emission from North Korea is expected.
Megacities in Asia are significant sources for air pollu-tants. Thus, several research programs to investigate the con-tribution of pollutant emissions from Asian megacities to lo-cal and regional air quality have been carried out. This study result implies that even the large urban city such as Seoul can be influenced by the long range transport of air pollutants such as PAHs emitted from the outside of Seoul, especially other megacities. Thus, the transport from outside must be considered even at urban areas in order to control the level of PTS such as PAHs at urban area in Northeast Asia.
Acknowledgements. This work was supported from the National Research Laboratory (No. M10600000221-06J0000-22110) funded by Korea Science and Engineering Foundation. The authors thank to NOAA, USA for the backward trajectory analysis service. Edited by: M. G. Lawrence
References
BP: Statistical review of world energy 2005 (available at http: //www.bp.com/downloads.do?categoryId=9003093&contentId= 7005944), 2005.
Bae, S. Y., Yi, S. M., and Kim, Y. P.: Temporal and spatial variations of the particle size distribution of PAHs and their dry deposition fluxes in Korea, Atmos. Environ., 36, 5491–5500, 2002. Chen, Y., Bi, X., Mai, B., Sheng, G., and Fu, J.: Emission
charac-terization of particulate/gaseous phases and size association for polycyclic aromatic hydrocarbons from residential coal combus-tion, Fuel, 83, 781–790, 2004.
Duval, M. M. and Friedlander, S. K.: Source resolution of poly-cyclic aromatic hydrocarbons in the Los Angeles atmosphere: Application of a chemical species balance method with first-order chemical decay, EPA-600/S2-81-161, U.S., 1982. Friedlander, S. K.: Chemical element balances and identification of
air pollution sources, Environ. Sci. Technol., 7, 235–240, 1973. He, K., Yang, F., Ma, Y., Zhang, Q., Yao, X., Chan, C. K., Cadle,
S., Chan, T., and Mulawa, P.: The characteristics of PM2.5 in
Beijing, China, Atmos. Environ., 35, 4959–4970, 2001. Hedberg, E., Kristensson, A., Ohlsson, M., Johansson, C.,
Johans-son, P. – ˚A., Swietlicki, E., Vesely, V., Wideqvist, U., and West-erholm, R.: Chemical and physical characterization of emissions from birch wood combustion in a wood stove, Atmos. Environ., 36, 4823–4837, 2002.
Hopke, P. K.: Receptor modeling for air quality management. Else-vier Press, Amsterdam, The Netherlands, 1991.
IEA, International Energy Agency: Energy statistics (available at http://www.iea.org/Textbase/stats/index.asp), 2006.
Katz, M., Chan, C., Tosine, H., and Sakuma, T.: Relative rates of photochemical and biological oxidation (in vitro) of poly-cyclic aromatic hydrocarbons, in: Poly Nuclear Aromatic Hy-drocarbons, edited by: Jones, P. W. and Leber, P., 171–189, Butterworth-Heinemann, Woburn, Mass., USA, 1979.
Lee, J. Y., Kim, Y. P., and Yi, S. M.: Size distributions and dry de-position fluxes of particulate Polycyclic Aromatic Hydrocarbons (PAHs) at several sites in Korea in 1999, Environ. Eng. Sci., 23, 393–404, 2006a.
Lee, J. Y., Kim, Y. P., Kang, C. H., Ghim, Y. S., and Kaneyasu, N.: Temporal trend and long range transport of particulate PAHs at Gosan in Northeast Asia between 2001 and 2004, J. Geophys. Res., 111, D11303, doi:10.1029/2005JD006537, 2006b. Lee, K. H., Kim, J. E., Kim, Y. J., Kim, J. H., and von
Hoyningen-Huene, W.: Impact of the smoke aerosol from Russian forest fires on the atmospheric environment over Korea during May 2003, Atmos. Environ., 39, 85–99, 2005.
Li, A., Jang, J. K., and Scheff, P. A.: Application of EPA CMB8.2 model for source apportionment of sediment PAHs in Lake Calumet, Chicago, Environ. Sci. Technol., 37, 2958–2965, 2003. Marr, L. C., Dzepina, K., Jimenez, J. L., Reisen, F., Bethel, H. L., Arey, J., Gaffney, J. S., Marley, N. A., Molina, L. T., and Molina, M. J.: Sources and transformations of particle-bound polycyclic aromatic hydrocarbons in Mexico City, Atmos. Chem. Phys., 6, 1733–1745, 2006,
http://www.atmos-chem-phys.net/6/1733/2006/.
MOCIE, Ministry of Commerce, Industry and Energy, Korea: Year-book of regional energy statistics. Korea, 2004.
MOCIE, Ministry of Commerce, Industry and Energy, Korea: Year-book of energy statistics. Korea, 2005.
MOE, Ministry of Environment, Korea: Annual report of air quality in Korea 2004. Korea, 2005.
Na, K.: Characteristics of atmospheric volatile organic compounds in Seoul: Measurements and chemical mass balance receptor modeling. Ph. D thesis, Yonsei University, Korea, 2001. Park, S. S., Kim, Y. J., Kang, C. H.: Atmospheric polycyclic
aro-matic hydrocarbons in Seoul, Korea, Atmos. Environ., 36, 2917-2924, 2002.
Price, L., Sinton, J., Worrell, E., Phylipsen, D., Xiulian, H., and Ji, L.: Energy use and carbon dioxide emissions from steel produc-tion in China, Energy, 27, 429–446, 2002.
Rogge, W. F., Hidlemann, L. M., Mazurek, M. A., Cass, G. R., and Simoneit, B. R. T.: Sources of fine organic aerosol. 2. Noncat-alyst and catNoncat-alyst-equipped automobiles and heavy duty diesel trucks, Environ. Sci. Technol., 27, 636–651, 1993a.
Rogge, W. F., Hidlemann, L. M., Mazurek, M. A., Cass, G. R., and Simoneit, B. R. T.: Sources of fine organic aerosol. 5. Natural gas home appliances, Environ. Sci. Technol., 27, 2736–2744, 1993b. Rogge, W. F., Hidlemann, L. M., Mazurek, M. A., and Cass, G. R.: Sources of fine organic aerosol. 9. Pine, oak, and synthetic log combustion in residential fireplaces, Environ. Sci. Technol., 32, 13–22, 1998.
Ross, A. B., Jones, J. M., Chaiklangmuang, S., Pourkashanian, M., Williams, A., Kubica, K., Andersson, J. T., Kerst, M., Danihelka, P., and Bartle, K. D.: Measurement and prediction of the emis-sion of pollutants from the combustion of coal and biomass in a fixed bed furnace, Fuel, 81, 571–582, 2002.
Schauer, J. J., Rogge, W. F., Hildemann, L. M., Mazurek, M. A., and Cass, G. R.: Source apportionment of airborne particulate matter using organic compounds as tracers, Atmos. Environ., 30, 3837–3855, 1996.
Schauer J. J., Kleeman, M. J., Cass, G. R., and Simoneit, B. R. T.: Measurement of emissions from air pollution sources. 3. C1-C29 Organic compounds from fireplace combustion of wood, Envi-ron. Sci. Technol., 35, 1716–1728, 2001.
SNU, Seoul National University: The influence and plan of domes-tic industries for the global agreement of POPs. Korea, 2000. Simcik, M. F., Eisenreich, S. J., and Lioy, P. J.: Source
apportion-ment and source/sink relationships of PAHs in the coastal at-mosphere of Chicago and Lake Michigan, Atmos. Environ., 33, 5071–5079, 1999.
Streets, D. G., Gupta, S., Waldhoff, S. T., Wnag, M. Q., Bond, T. C., and Yiyun, B.: Black carbon emissions in China, Atmos. Environ., 35, 4281–4296, 2001.
Streets, D. G., Yarber, K. F., Woo, J.-H., and Carmichael, G. R.: Biomass burning in Asia: Annual and seasonal esti-mates and atmospheric emissions, J. Geophys. Res., 17, 1099, doi:10.1029/2003GB002040, 2003.
UNEP, United Nations Environment Programme: Regionally based assessment of persistent toxic substances, Central and North East Asia regionally report. Global Environment Fa-cility, URR (http://www.chem.unep.ch/pts/regreports/C&NE% 20Asia%20full%20report.pdf), 2002.
US EPA, Environmental Protection Agency: Determination of poly-cyclic aromatic hydrocarbons (PAHs) in ambient air using gas chromatography/mass spectrometry (GC/MS). EPA publication No. EPA/625/R-96/010b, Cincinnati, OH, USA, 1999.
US EPA, Environmental Protection Agency: EPA-CMB8.2 Users manual. EPA publication No. EPA-452/R-04-011, Research Tri-angle Park, NC, USA, 2004.
Yang, H. H., Lai, S. O., Hsieh, L. T., Hsueh, H. J.,and Chi, T.: Profiles of PAH emission from steel and iron industries, Chemo-sphere, 48, 1061–1074, 2002.
Zheng, M., Cass, G. R., Schauer, J. J., and Edgerton, E. S.: Source apportionment of PM2.5 in the southeastern United States using solvent-extractable organic compounds as tracers, Environ. Sci. Technol., 36, 2361–2371, 2002.
Zheng, M., Salmon, L. G., Schauer, J. J., Zheng, L., Kiang, C. S., Zhang, Y., and Cass, G. R.: Seasonal trends in PM2.5 source contributions in Beijing, China, Atmos. Environ. 39, 3967–3976, 2005.