HAL Id: hal-00304961
https://hal.archives-ouvertes.fr/hal-00304961
Submitted on 1 Jan 2004HAL is a multi-disciplinary open access archive for the deposit and dissemination of sci-entific research documents, whether they are pub-lished or not. The documents may come from teaching and research institutions in France or abroad, or from public or private research centers.
L’archive ouverte pluridisciplinaire HAL, est destinée au dépôt et à la diffusion de documents scientifiques de niveau recherche, publiés ou non, émanant des établissements d’enseignement et de recherche français ou étrangers, des laboratoires publics ou privés.
INCA model
A. Bastrup-Birk, P. Gundersen
To cite this version:
A. Bastrup-Birk, P. Gundersen. Water quality improvements from afforestation in an agricultural catchment in Denmark illustrated with the INCA model. Hydrology and Earth System Sciences Discussions, European Geosciences Union, 2004, 8 (4), pp.764-777. �hal-00304961�
Water quality improvements from afforestation in an agricultural
catchment in Denmark illustrated with the INCA model
A. Bastrup-Birk and P. Gundersen
Danish Centre of Forest, Landscape and Planning, University of Veterinary and Agricultural Sciences, Hørsholm Kongevej 11, DK-2970 Hørsholm, Denmark Email for corresponding author: ab@kvl.dk
Abstract
Intensive agricultural land use across Europe has altered nitrogen (N) budget of catchments substantially, causing widespread N pollution of freshwater. Although the N cycle in forests has changed due to increased N deposition, most forest soil waters in Europe have low nitrate concentrations. The protective function of forests on water quality has led to increasing interest in the planting of new forests on arable land as a measure to protect valuable or sensitive freshwater resources. The paper illustrates the effects of afforestation on water and N cycling using the Integrated Nitrogen Catchment (INCA) model. The model was calibrated on the Horndrup catchment in the eastern part of Jutland, Denmark, which is dominated by agricultural land use but also covered by 18% of forest land. The dynamics of nitrate concentrations in the stream water were simulated successfully by INCA over a three-year period. The simulation of the dynamics of nitrate concentrations in the soil water is closely linked to the simulation of the hydrological dynamics and especially to the rainfall. The best fit was achieved for both arable and forest land during the wettest year of the study period. The model was then used to simulate the effect of afforestation of a catchment dominated by agriculture on N fluxes with seepage and runoff. Scenarios of whole catchment conversion to forest were run, based on observations of evapotranspiration and N deposition from other Danish sites. The simulated conversion to mature forest reduced runoff by 3045% and reduced the nitrate concentrations in the soil water by 5070%. The simulated effect of afforestation on N leaching was an almost direct reflection of the change in the N input: substantial changes in the plant demand and soil N dynamics over the afforestation period were not simulated. To simulate the N dynamics over longer time-scales, appropriate for the study of afforestation, it is suggested that the INCA model be run with transient scenarios and linked to more detailed plant and soil models.
Keywords: afforestation, arable land, forest hydrology, INCA, modelling, nitrogen, nitrate leaching
Introduction
Intensive agricultural production systems have altered the nitrogen (N) budget substantially in Europe, causing widespread N pollution of freshwater. Surface water and shallow groundwater in agricultural catchments often have nitrate concentrations exceeding the drinking water standard of 11.3 mg N l1 (Egmont et al., 2002). Although the N cycle
in forests has changed due to increased N deposition, most forest waters in Europe have low nitrate concentrations (Kristensen et al., 2004). In a national Danish survey of nitrate concentrations in soil water at more than 1000 sites, the median concentration was 18 and 1.6 mg N l1 for arable
and forested land, respectively (Callesen et al., 1999). The protective function of forests reducing nutrient and pesticide concentrations in the water under forests has led
to increasing interest in using forest waters for drinking water supply. Recently, new forests have been planted on arable land to protect valuable or sensitive freshwater resources in Denmark (DFNA, 1999), despite concerns that water yield may decrease due to higher evapotranspiration from forests (Calder, 1990). Afforestation of arable land (or natural re-growth after abandonment) may also increase considerably in Europe as a result of changes in Community Agricultural Policy (CAP) linked to the enlargement of the European Community. Afforestation of arable land may also grow because of the increased C-sequestration from afforestation, which may be accounted as a sink in national CO2 budgets and so help to fulfil the reduction agreed in
the Kyoto Protocol.
arable land after afforestation would significantly decrease the impacts on water quality. However, such effects are not well documented. Studies of arable soils afforested 50100 years ago have shown that N cycling characteristics (mineralisation, nitrification rates) and organic matter C: N ratios still differ significantly from those of old growth forest soils even up to 100 years after afforestation (Compton et al., 1998; Koerner et al., 1999). Arable soils, which are currently afforested, are very different from those afforested 50100 years ago, especially in respect of N status. Thus, the knowledge from former studies on afforestation cannot be applied directly to present-day and future conditions, even though earlier studies indicate that forests on former arable land will differ significantly from old growth forest over the course of centuries. To predict the impact of afforestation on water quality, a study of N cycling was initiated in a chronosequence of forest stands (030 years) planted on intensively used arable land at the Vestskoven, south of Copenhagen. This study is now part of the EU-project AFFOREST (Hansen, 1999), where a database on nutrient cycling has been made available for this study.
This paper focuses on the impact of afforestation on arable soils on hydrological processes and on seepage and stream water quality. The aim was to evaluate the suitability of the dynamic model INCA (Integrated Nitrogen Model for European Catchments, ver. 1.7; Wade et al., 2002) as a tool to predict the impact, on water and N cycles, of a land-use
change from intensive agriculture to forest. This was done in three steps by: (i) calibrating the INCA model to a detailed three-year data record from a Danish catchment under intensive agricultural use (the Horndrup catchment); (ii) evaluating the data from AFFOREST and other sources for information on quantitative changes in water and N cycles after afforestation (mainly from the Vestskoven afforestation area); (iii) using this quantitative information as model targets in scenarios for afforestation in the agricultural catchment without recalibrating the model.
Study sites
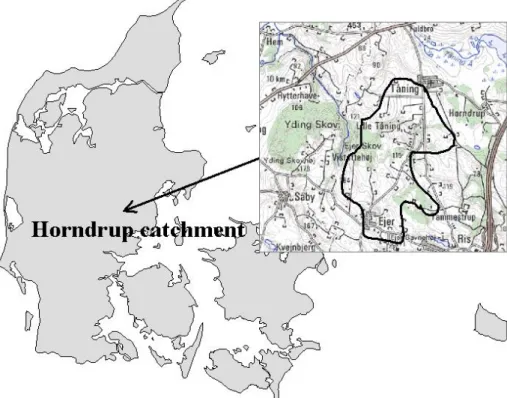
THE HORNDRUP AGRICULTURAL CATCHMENT
The Horndrup catchment is in the eastern part of Jutland, Denmark, about 6 km from Skanderborg (about 55o96N,
9o48E), Fig.1. The catchment extends in a northsouth
direction with a maximum width of 1.8 km and a length of 4 km with a total area of approximately 550 ha. The topography is hilly with a 131 m gradient from south to north and with a well delimited catchment boundary. The soils are developed on glacial till, which covers about 80% of the area. The rest of the area is characterised by glacial stream sand and by some freshwater peat close to the rivulets. The till soil is sandy loam described in more detail by Jensen and Madsen (1990). The relatively steep terrain
gradient results in a fast flowing stream through the Horndrup catchment and the bed of the brook consists of stone, gravel and sand. The catchment can be considered representative of Danish catchments, with mainly agricultural land cover (about 80% of the catchment) and a sparse population. Forests and other wooded land cover about 18% of the catchment area, a major part of it being an 80-year old beech forest. The main crops are winter wheat and grassland covering 55% and 25% of the agricultural land, respectively.
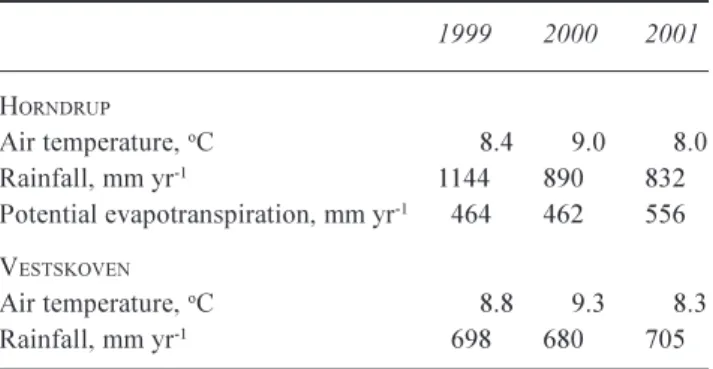
Rainfall is measured at the southern part of the catchment by the Danish Meteorological Institute (DMI) and corrected for evaporation and wind factors (Vejen et al. 1999). Air temperature, potential evapotranspiration and global radiation are measured as a part of the climate monitoring network of the Danish Institute for Agricultural Sciences. The climate variability at the site during the three-year measurement period is shown in Fig. 2 and summarised in Table 1. The average rainfall for the period 19611990, 918 mm, was exceeded by 226 mm in 1999. The rainfall excess was distributed over the whole year. The rainfall in 2001 was about 86 mm below the normal rainfall of 1961 1990. Potential evapotranspiration rates for 1999 to 2001, calculated using the Penman-Monteith equation were 433
mm yr1, 424 mm yr1 and 535 mm yr1 respectively (Nielsen
and Hansen, 2002).
The catchment is part of the Danish fresh water-monitoring programme, NOVA-2003 (Grant et al., 2002). There are three types of sampling stations in the catchment for monitoring water quality: soil water, drain water and groundwater sampling. Due to the soil characteristics and the hilly topography of the catchment, water was rarely sampled from the drain stations; thus there is no database for this water type. Water samples were collected from six
Table 1. Mean climate at the Horndrup catchment and Vestskoven
during the study period.
1999 2000 2001 HORNDRUP Air temperature, oC 8.4 9.0 8.0 Rainfall, mm yr-1 1144 890 832 Potential evapotranspiration, mm yr-1 464 462 556 VESTSKOVEN Air temperature, oC 8.8 9.3 8.3 Rainfall, mm yr-1 698 680 705
Fig. 2. Hydrological input data for the period January 1999 to December 2001 at the Horndrup catchment in Jutland, Denmark. SMD is Soil
soil water stations in the catchment: stations 15 are situated on agricultural land and station 6 is situated in the 80-year old beech forest. Each soil water station consisted of ten soil water samplers placed at a depth of 120 cm and two sets of three groundwater samplers placed at a depth of 150, 300 and 500 cm. Another eight stations sampled groundwater within the catchment area. All soil and groundwater samples were analysed for nitrogen and phosphorus. Discharge and water level were registered continuously at Sortholmvej situated at the northern (and lowest) part of catchment, where concentrations of nitrate and ammonium were measured weekly. Table 2 presents the statistics of the in-stream discharge and concentrations of nitrate and ammonium for the database available. The mean concentrations of NO3-N and NH4-N were 6.0 and
0.04 mg N l1, respectively. More details on monitoring and
sampling in the Horndrup catchment can be found in Hansen (2000, 2001) and Nielsen and Hansen (2002).
Nitrogen leaching at 120 cm soil depth was estimated to be about 90 kg N ha1yr1, mainly as nitrate from the
agricultural land and about 17 kg N ha1yr1 from the forested
land (Nielsen and Hansen, 2002). The mean yearly leaching in Denmark is currently estimated to be 66 kg N ha1 yr1
(Anon., 2002). Leaching from the Horndrup River catchment is higher than average due to high rainfall and high intensity of cattle production (Hansen, 2000).
The atmospheric N deposition was not measured at the site. An estimate was obtained from a monitoring station situated in an agricultural landscape in the southern part of Jutland (Lindet) with rainfall conditions comparable to the Horndrup catchment (Hansen, 2003). The bulk precipitation deposition of N amounted to 8.0 kg N ha1 yr1 as NH
4-N
and 5.8 kg N ha1 yr1as of NO
3-N for the years 19992001.
Based on throughfall data from a younger beech stand (30-yr) at the Lindet site the N deposition to the Horndrup beech forest was estimated to be 25 kg N ha1 yr1.
THE VESTSKOVEN AFFORESTATION AREA
The Vestskoven afforestation area is 15 km west of Copenhagen (55° 70N, 12° 35E), Denmark. Afforestation was started in the late 1960s and is still ongoing. Preceding afforestation, Vestskoven had been used intensively as arable fields, market gardens or nurseries. Today, Vestskoven covers a total area of 1340 ha with forest stands of about 1 to 10 ha and large clearings of permanent pasture. The soil is a nutrient-rich sandy loam and is relatively homogeneous over the area. More information on the soil and the changes in soil properties after afforestation can be found in Ritter et al. (2003) and Vesterdal et al. (2002). At Vestskoven, the average rainfall for the study period was 100300 mm lower and the average temperature 0.4 °C higher than that at Horndrup (Table 1).
Throughfall and litterfall production and chemistry, soil moisture and soil solution chemistry (at 90 cm depth) were studied over three years by monthly sampling and analysis in two chronosequence of oak (Quercus robur) and of spruce (Picea abies). In each chronosequence, five stands from 1 to 33 years since conversion were sampled within three replicated circular (20 m diameter) plots. Meteorological data are available from a nearby station operated by the Royal Veterinary and Agricultural University, Denmark. In this study, data from the 33 year-old stands were used to represent the long-term impact from afforestation on arable land. The current N input from atmospheric deposition to the area is approximately 10 kg N ha1 yr1 and 17 kg N ha1
yr1 in mature stands of oak and spruce, respectively (Hansen,
2003).
Modelling current agricultural use
THE INCA MODEL
INCA is a dynamic and process-based model simulating nitrogen dynamics in catchments. The model includes major processes determining inputs, transformations and outputs of nitrogen in the soil. Hydrological data are required to drive the hydrological component of the INCA model. The data required for the set-up of INCA include mean daily flow, stream water nitrate and ammonium concentrations, both as nitrogen and loads from major land use and vegetation types within the catchment (Whitehead et al., 1998; Wade et al., 1999, 2001, 2002; Wade, 2004). Inputs to the hydrological part of the model are daily time series of meteorological data (rainfall and temperature), soil moisture deficit and hydrological effective rainfall (HER), which is the rainfall penetrating the ground after evapotranspiration and interception losses. Inputs to the nitrogen cycling part of the model are atmospheric deposition of nitrogen,
Table 2. Statistics for the period 19992001 at the Horndrup Brook.
Statistics Flow Nitrate-N Ammonium-N
(m3 s-1) (mg N l-1) (mg N l-1) Mean 0.085 6.0 0.039 Maximum 0.44 11 0.073 Minimum 0.066 1.15 0.045 Median 0.44 9.7 0.073 Range 0.0066 5.7 0.00044 Variance 0.081 2.4 0.021 Standard deviation 0.0025 0.07 0.0006 Standard Error 95% 0.25 10.7 0.08
fertiliser applications, land use area, soil N process rates and crop management. Model outputs are nitrogen leaching, uptake and denitrification, stream flow (discharge) and stream water nitrate and ammonium concentrations.
APPLICATION OF INCA TO THE HORNDRUP CATCHMENT
Data on daily air temperatures, rainfall and global radiation were obtained from nearest meteorological stations operated by the Danish Meteorological Institute (DMI) and the Danish Institute for Agricultural Sciences. The hydrological effective rainfall (HER) was calculated using a simple water balance model (Bastrup-Birk et al., 2003) which incorporates the development of leaf area index and simulates the variations in interception, important when modelling the hydrology of forested areas. The hydrological input data are shown in Fig. 2, illustrating the seasonality with dry conditions and no HER in the growing season except in the wet summer of the first year (1999).
The catchment land uses were grouped into four categories: (i) 54% arable land (cereals), (ii) 26% short vegetation fertilised, (iii) 2% short vegetation unfertilised, ungrazed, and (iv) 18% forest based on inventories in Hansen (2000, 2001) and Nielsen and Hansen (2002). The growth season was estimated to start on March 15 and end on October 31. For arable land, the growth season ended at harvest time in mid-August. Fertiliser applications on arable and grassland were taken from a fertiliser survey performed at the Horndrup catchment during the modelling period (Hansen, 2000).
CALIBRATION
Process-based models like INCA need to be calibrated against observations to be used as tools for scenario runs. The simulation of nitrogen concentrations and loads in both catchment and stream components is dependent on water volumes and the routing of the water through the soil, groundwater and brook reaches. Therefore, it is important to simulate hydrology accurately before modelling the N processes in the catchment. As a first step, INCA was set up to simulate hydrology in terms of dynamics and flow. Because there was only one discharge gauging station, the main stem of the Horndrup Brook was used to model nitrogen in the catchment using INCA. The length of the main stem was approximately 5 km.
Velocity and flow information was needed to estimate residence times of water within the brook. The flow-velocity relationship is defined as V= a Q b. There was no assessment
of the relationships between flow and velocity at the
Horndrup Brook. Values of the constants a and b were taken as a=0.02 and b=0.67 from another catchment application of INCA (Jarvie et al., 2002). Constants defining residence times of the water through the soil and ground water reservoirs were determined through calibration until the simulated mean daily flows matched the observed mean daily flows for the period closely. The baseflow index is used to partition the water moving between the soil water and the groundwater reservoirs. Having no information on the partitioning of the runoff and the base flow in the catchment, the baseflow index was set as 0.55 assuming that about half of the water was running directly to the groundwater and half through the soil water reservoir.
INCA was calibrated against daily discharge data from the gauging station at Sortholmvej. Figure 3 (panel a) presents time-series of the daily variations in simulated and observed flow of the Horndrup Brook for the period 1999 to 2001. Observed values are shown as stars. The model shows a good fit in terms of flow dynamics, which suggests the estimates of the a and b parameters and baseflow index are reasonable. The timing and the magnitude of the flow peaks are well reproduced by the INCA model but the model did in general overestimate the discharge of the brook. The coefficient of efficiency (E) of Nash and Sutcliffe (1970) was used to assess the quality of model calculations. When the measured variable is simulated exactly by the model, E = 1. If E is less than 0, the predictive precision of the model is lower than when the mean of values measured is used. The model fits had an average E of 0.51, which gives an acceptable fit. The r2 between measured and simulated flow
was 0.67 (Fig. 4a).
Following the hydrological calibration, the parameter values describing the soil properties, land use, initial values, threshold and constants, stream processes and soil nitrogen processes were adjusted to calibrate the stream N concentrations and fluxes. The simulated nitrate concentrations matched the observed concentrations satisfactorily (Fig. 3, panel b) including the distinct seasonal variations in nitrate concentrations with summer minima and sharply increasing levels in the wet and dormancy period. The model fits for nitrate concentrations had an average E of 0.70, which is acceptable. The r2 between
measured and simulated nitrate concentrations was 0.77 (Fig. 3b). The ammonium concentrations were low in the Horndrup Brook. INCA does not include sorption and desorption of ammonium to soil particles, nor does it include sediment movement. This may explain the poor simulation of stream water ammonium concentrations (not shown).
The magnitudes of simulated annual fluxes for the catchment processes and annual leaching loads were compared to expected ranges of published data for the
Fig. 3. Simulated (lines) and measured (dots) time-series of discharge (m3 s-1), nitrate and ammonium (mg N l-1) at the Horndrup brook under
the study period of January 1999 to December 2001.
Fig. 4. Observed and simulated flow, m3 s-1 (a) and nitrate concentrations, mg N l-1 (b) in the Horndrup Brook.
relevant land use types. N-leaching and process loads were also compared to observations previously made in Denmark. (Kyllingsbæk et al., 2000). Table 3 presents the process loads that were used in the final model for the two land uses, arable and forest. The differences in magnitude and the dynamics
of soil water nitrate concentrations between the arable and forest land uses were captured by the model (Fig. 4). The mean simulated N fluxes for arable and forest land use are summarised in Table 4 where the large difference in input between the land uses is reflected in most of the fluxes.
Table 3. Parameters used in the INCA modelling of the Horndrup
catchment.
Parameters Unit Arable Forest
Surface flow m3 s-1 0.001 0.001 Subsurface flow m3 s-1 0.001 0.001 surface nitrate mg N l-1 13 3 Subsurface nitrate mg N l-1 0 0 Surface ammonium mg N l-1 0 0 Subsurface ammonium mg N l-1 0 0
Surface drainage volume m3 500 500
Subsurface drainage volume m3 500 500
Denitrification rate day-1 0.002 0.003
Nitrogen fixation kg N ha-1 day-1 0.003 0.003
Plant nitrate uptake rate day-1 0.002 0.03
Maximum nitrate uptake kg N ha-1yr-1 105 70
Nitrate addition rate day-1 0.5 0
Nitrification rate day-1 0.02 0.07
Mineralisation kg N ha-1 day-1 0.5 0.4
Immobilisation rate day-1 0.005 0.07
Ammonium addition rate kg N ha-1 day-1 0.4 0
Plant ammonium uptake rate day-1 0.1 0.005 Plant growth start day julian 60 60 Plant growth period days 180 253 Fertiliser addition start day julian 120 0 Fertiliser addition period days 90 0 Soil moisture deficit maximum mm 90 90 Max. temperature difference oC 4.5 4.5
Soil reactive zone time constant days 2 2 Groundwater zone time constant days 30 40
Table 4. Simulated N fluxes in the root zone at Horndrup catchment
for the period January 1999 to December, 2001.
Fluxes, kg N ha1 yr1 Arable Forest
Input nitrate-N total (model input) 100 12
Input ammonium-N total (model input) 82 13
Ammonium-N Net mineralisation 19 2
Ammonium-N nitrification 32 9 Nitrate-N uptake 54 11 Ammonium-N uptake 46 3 Nitrate-N denitrification 23 1.6 Nitrate-N leaching 58 10 Ammonium-N leaching 10 2
Change in soil storage -11 0
Land use change impacts
To analyse the impact of land use change from agriculture to forest on N cycling, information is required on how these land uses differ with respect hydrology and N dynamics.
Such information is not available for the Horndrup catchment. Therefore, data are required for comparable soils and climate conditions. The following two sections describe the differences in the water cycle and N cycling between forest and agricultural land.
WATER CYCLE IN FORESTS AND AGRICULTURAL LAND
It is widely accepted that trees generally use more water than low vegetation (e.g. Bosch and Hewlett, 1982; Calder, 1990; Whitehead and Robinson, 1993). This higher water use is caused mainly by higher rates of interception and transpiration. The afforestation of arable land may lead to a gradual decrease in the rainfall surplus. To obtain an estimate of this effect under Danish climate conditions, data were compiled from hydrological modelling of water balances on different sites in Denmark. It is, however, difficult to compare water balance data since the results vary with e.g. rainfall, climate and type and detail of the simulation model (Ladekarl, 2001). Sites with comparable rainfall depths (and observation periods) were available only for sandy soils. These sites were all from a small region in West Jutland, less than 60 km apart (Table 5).
Rainfall is the main driver of water yield, but significant differences in water yield exist between land uses (Fig. 5). Cereals and heath land had similar water yields; trees had generally lower water yields, lower in conifers (Norway spruce) compared to deciduous trees (oak). To estimate the difference in water yield between forest and agricultural land at Horndrup, the differences were normalised to the rainfall levels in Horndrup (918 mm yr1) using linear regressions
for each site (Table 5). Across the sites, deciduous trees and conifers had 90 mm yr1 (65125) and 200 mm yr1 less water
yield than agriculture, respectively. These estimates were used as targets for simulation of afforestation in Horndrup although they relate to sandy soils. The soil at Horndrup is loamy, but very few simulations of forest water balances have been done for Danish sites on loam, and then mainly for significantly lower rainfall levels. It was assumed for scenario purposes that at the relative high rainfall level, the Horndrup soil type would have only a marginal influence on the evapotranspiration.
N CYCLING IN FORESTS ON AGRICULTURAL LAND
Forests planted on modern agricultural soils may be different from old growth forests especially with respect to nitrogen. In Denmark, forest soils have C/N ratios around 2030 whereas agricultural soils usually have C/N ratios around 10. This indicates that forests on agricultural soils have
higher nitrate leaching than old growth forests, since nitrate leaching from forests is mainly dependent on the C/N ratio (Gundersen et al., 1998).
Data from Vestskoven (where the C/N ratio of the old plough layer is 1012) show that some leaching occurs when the stands are mature (Fig. 6). However, the chronosequence showed a more complex pattern. After planting of the trees, the nitrate leaching was high for up to 34 years until weed
Table 5. Water balance data (mm yr1) from different land uses on sandy soils. Heath land and forest data were derived from SOIL/COUP
(Jansson, 1998) model simulations.
Land use Site Period Preci- Evapotrans- Out flow from Out flow at Reference pitation piration from root zone 918 mm yr-1*
Agriculture Borris, cereals 19911996 860 389 471 534 K. Schelde and C.D. Børgesen, unpublished data Heath land Hjelm Hede 19931998 896 366 530 543 Ladekarl et al., 2001 Oak, old Hald Ege, 19921999 880 490 390 418 Ladekarl, 2001
150 years
Oak, young Ulborg, 1985-1997 838 414 424 478 Bille-Hansen, J. 20-32 years unpublished data Norway spruce, Ulborg, 19851997 838 536 302 337 Ibidem young 20-32 years
Norway spruce, Klosterhede, 19921995 877 566 311 339 Beier, 1998 old 80 years
* Estimated at normal rainfall for Horndrup from regression lines (not shown) for each land use, excluding a very dry year on the heath land site.
Fig. 5. Simulated (lines) and measured (symbols) time-series of soil water NO3-N concentrations in the Horndrup catchment in the period from
January 1999 to December 2001.
control ceased. Thereafter, stands of both oak and Norway spruce between 5 and 20 years old all showed practically no N leaching. In this period trees have a large N demand to satisfy the growth of N-rich compartments like roots, bark, twigs and foliage. When the stands mature and the main growth is in the woody, N-poor compartments, there is apparently an excess of N from deposition, which is evident as elevated soil water nitrate concentrations of 1.8
and 7.5 N mg N l1 for oak and Norway spruce, respectively
(Fig. 6). The nitrate concentration in oak was thus comparable to that observed in the old beech forest at Horndrup (Fig. 6). The nitrate concentrations observed in the soil water of the older stands at Vestskoven were therefore assumed to be characteristic of the long-term effect of afforestation at Horndrup, although rainfall is higher at Vestskoven than at Horndrup. More dilution is expected at Horndrup but, on the other hand, N deposition is much higher at Horndrup than at Vestskoven.
INCA analysis of land use change
The INCA model was used to investigate the effect of different forest types on the N fluxes, compared to arable land use, without changing the calibrated parameters given in Table 3. Scenario analysis focused on the soil water nitrate concentration where time series from both Vestskoven and Horndrup were available for comparison. Five different scenarios were defined, representing the hydrological and N deposition responses to different canopy characteristics. Scenario 1 was run as a reference scenario assuming that the whole catchment was converted to arable land. In scenarios 2 to 5, the whole catchment was afforested and the simulations were first done for young (c. 10 years old) deciduous and coniferous forest, respectively (scenarios 2 and 3) and then for mature (c. 30 years old) deciduous and coniferous forest, respectively (scenarios 4 and 5). Scenario input files were generated based on differences in hydrological effective rainfall and deposition due to differences in mainly interception and evapotranspiration caused by the different land use types.
The INCA model was run for the five above-mentioned scenarios. Using the corrected HER, runoff was reduced by about 30% when the land use was converted from arable
land to deciduous forest and up to 45% when converted to coniferous forest. For nitrate, the simulations of mature forests gave mean soil water concentrations in deciduous forest matching those in oak from Vestskoven and beech at Horndrup, but for coniferous forest the simulation gave concentrations lower than found in spruce from Vestskoven (Fig. 6). This could be explained as an effect of the lower rainfall at Vestskoven (Table 1). The characteristic seasonality in soil water nitrate concentrations of arable land (increasing in summer due to minimal soil water amounts and decreasing again in autumn due to increased net rainfall and leaching rates, Fig. 4) was damped for the forest scenarios (Fig. 7). The largest difference was observed between mature and young forest, reaching up to 70% lower soil water nitrate concentrations in young forests. The scenarios illustrated the large differences between coniferous and deciduous forest where both young and mature conifers always had higher concentrations of nitrate in soil water than both young and mature deciduous trees (Fig. 7). However, when calculating the leaching flux of N there were no substantial differences between the different forest types (data not shown), so the concentration difference between deciduous and coniferous in the model was due to the difference in HER. As expected, afforestation of the whole catchment reduced N leaching in the catchment substantially, from 90 kg N ha1 yr1 at current land use to 15 kg N ha1 yr1
independent of forest type.
Discussion
AGRICULTURAL LAND USE
The Horndrup catchment represents intensive agricultural land use in Denmark on the fine textured soils that extends throughout the eastern part of Jutland and the major islands. 100 200 300 400 500 600 700 800 500 700 900 1100 1300 Precipitation, mm yr-1 Outflow of root z one , mm yr -1 Agriculture Heathland Oak, old Oak, young N. spruce, young N. spruce, old
In the catchment, the mean nitrate concentration in soil water is 6.3 mg N l1 (Fig. 6), which is considerably lower than
the 18 mg N l1 found in the national survey around 1990
(Callesen et al., 1999). This reflects the general increase in N use efficiency in Danish agriculture over the last two decades (Anon., 2002).
The INCA application captured the seasonal water and N dynamics in the stream (Fig. 2) though the N-leaching from the root zone 68 kg N ha1 yr1 (Table 4) was somewhat
lower than the estimates (90 kg N ha1yr1 as a mean for the
monitoring stations situated on farm land) based on other models (Nielsen and Hansen, 2002). The INCA model also simulated the soil water nitrate concentrations within the range observed (Fig. 6), although compared to the measurements, the daily dynamics seemed to be displaced a few months (Fig. 4). This may, however, be due to difficulties in obtaining samples during the dry season. The best model fit was in the first and wettest year of 1999, where the hydrology of the brook is driven mainly by rainfall.
The simulated uptake rate of N (100 kg N ha1yr1, Table
4) is comparable to the estimated removal in crops (122 kg N ha1yr-1) determined by Nielsen and Hansen (2002). The
annual denitrification of 23 kg N ha1 yr1 is within the range
of values obtained from the literature for Denmark for sandy loam soils (Kyllingsbæk et al., 2000). With this calibration of the model, a loss from the soil N pool was predicted for arable land of 11 kg N ha1yr1 (Table 4). This is in line with
observations from fine textured soils in Denmark where losses of 60±20 kg N ha1yr1 have been shown (Kyllingsbæk
et al., 2000).
The INCA model functioned well for the agricultural high inputhigh output system, where hydrology is driving the
N flows. The fact that the wet year produced the best fit emphasises this behaviour of the model. The yearly N leaching flux in agricultural systems in Denmark can be predicted quite accurately from N input, crop type, soil texture and rainfall in a simple empirical model (Simmelsgård et al., 2000). This is an even simpler approach for arable land than that used in the INCA model. However, the INCA model accounts for the seasonal variations in rainfall and temperature, and provides daily estimates of flow and stream water nitrate concentrations thereby identifying the extremes and the within-year variations.
FOREST ON OLD FOREST LAND
The deciduous forest in the Horndrup catchment had a higher nitrate concentration in the soil water at a depth of 120 cm (2.9 mg N l1, Fig. 4 and 6) than usually observed in
Denmark. Approximately 75% of the Danish forests would have lower concentration, typically of less than 1.5 mg N l1
(Callesen et al., 1999). In patchy forests in an agricultural landscape such as Horndrup N deposition is expected to be higher (here estimated to be 25 kg N ha1yr1) than in larger
forest areas, which may lead to higher nitrate concentration in soil water. In fact Callesen et al. (1999) found higher than average nitrate concentrations in small forests.
The simulated uptake rates of N for the forested area (14 kg N kg ha1 yr1, Table 4) is within the range 1022 kg N
kg ha1yr1 calculated for other Danish beech stands
(Hansen, 2003). A denitrification flux of 2 kg N ha1yr1
compares well with observations in forests (Persson et al., 2000). The N leaching of 12 kg N ha1yr1 (NO
3-N plus NH4
-N) is higher than expected for two reasons. Firstly, ammonium leaching in forests occurs only at very high
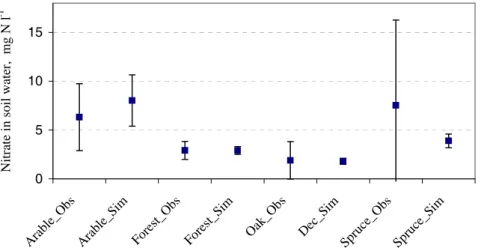
0 5 10 15 Arab le_Ob s Ara ble_S im Fores t_O bs For est_S im Oak _Obs Dec_ Sim Spru ce_O bs Spruc e_Sim Nitra te in soil wa te r, m g N l -1
Fig. 7. Nitrate concentrations in soil water in mg N l-1 over the 19992001 period mean and standard deviation of monthly observed (suffix
Obs) and monthly simulated (suffix Sim) for arable and forest land use at Horndrup (left side). In the right side of the diagram observed concentrations from oak and spruce from Vestskoven and deciduous and spruce simulations from the Horndrup catchment.
ammonium inputs (Kristensen et al., 2004; Gundersen et al., 1998). Secondly, the model was set up for a mixed land use area with only one hydrological input file for the whole area. In this way, the higher evapotranspiration loss of approx. 100 mm yr1 from the forest is unaccounted for.
Thus, the water flow in the forest soil is overestimated. This is also reflected in the dynamics of the nitrate concentration in soil water (Fig. 4), where the measured concentrations are well predicted in the very wet first year but underestimated in the drier years where the error in the soil water outflow is more pronounced. The model, thereby, underestimates the variability in the soil water nitrate concentration (Fig. 6). Future work with the model should use multiple hydrological time-series to account for the spatial variation in rainfall and temperature. Nielsen and Hansen (2002) estimated that leaching under the forest was 17 kg N ha1yr1; however, they did not correct for the higher
evapotranspiration in the forest. As a consequence of the overestimated N leaching and N uptake, the model calculates no increase in the soil N storage which, from a simple mass balance calculation, must be occurring in most Danish forest that are not yet N saturated.
AFFORESTATION ON ARABLE LAND
In the simulations of N dynamics in the afforested catchment, the hydrology was adjusted to account for the higher evapotranspiration from forest. This is an important aspect
to consider in any plans to afforest larger areas, since the water yield may decrease by 100200 mm yr-1 (Table 5). In
the Horndrup catchment, afforestation would cause a reduction in runoff of by 30 and 45% for deciduous and coniferous forest, respectively.
The simulated afforestation reduced N leaching, and the simulated soil water nitrate concentration was within the range observed in Vestskoven (Fig. 6). The differences in soil water nitrate concentration between forest types (Fig. 8) result from the differences in N deposition and the hydrological response. Thus, some N leaching is simulated for the young forests, but in forests with ages ranging from 520 years in Vestskoven and other afforestation areas, practically no leaching is observed, since in this period trees have high N demand (Gundersen et al., 2003). To obtain a more accurate simulation, the model parameters would have to be changed specifically for each forest type. This would be difficult to implement in the current formulation of INCA since plant N uptake would be far from constant over the years after afforestation and, therefore, a time-dependent uptake is recommended to make INCA able to simulate the transient change from agriculture to forest. When the newly established forest has matured, N uptake rates will become more constant.
The accumulation or loss of N in soil organic matter is an important unknown in the N balance, following afforestation. The low C/N ratio of arable soil may indicate minimal soil N accumulation and, more probably, a loss to
Fig. 8. Simulated daily concentrations of NO3-N (mg N l-1 d-1) in the soil water at Horndrup catchment (1999-2001) when the whole catchment
is converted to i) mature deciduous forest, ii) mature coniferous forest, iii) young deciduous and iv) young coniferous forest. Compare with concentration observed and simulated for arable land use in Figure 5.
satisfy the N demand in plant components. In Vestskoven, no net accumulation or loss of N (and C) in the soil could be demonstrated in the chronosequence of oak or spruce (Ritter et al., 2003). However, the pools of N and C were higher in a nearby 200-year-old forest, indicating a potential for some accumulation in soil organic matter in the long term.
THE INCA MODEL
Although the structure of the INCA model is relatively simple compared to other dynamic process-based models, the number of parameters adds to the complexity, resulting in parameter equifinality and therefore uncertainty in obtaining the optimum parameter set (Beven, 1993). When working with the INCA model, there are three difficult issues. Some of the parameters are seldom measured in the field and certainly not assessed on a regional scale. Therefore, there may be differences in scale between the measurements of process flux in the field, which are typically made in heterogeneous conditions and a model lumped value which tries to describe the average flux for an entire homogeneous land-use unit. Another issue is using constant parameter values to describe the transition from one land-use system to another, as in this study from agriculture to forested land. This is a process where the whole ecosystem and its processes will change gradually. By using fixed, calibrated parameters, the relationships between the different processes represented within INCA are fixed. It was not possible to verify the soil nitrogen process rates, which were defined in the parameter file and kept constant. These constants are producing the right dynamics for the period in question but it is not known whether these parameters are valid in the long-term under changes in land use. Under real land changes these processes are expected to change. Moreover, since plants are represented only as a net sink, changes in the internal N cycling (uptake to build the foliar canopy and root system, litterfall and mineralisation) are not considered. Thus, the effects of changes in cropping systems, tillage, establishment of a permanent forest crop etc. that may change the sourcesink balance of N will not be predicted unless they are specifically parameterised.
The use of the INCA model is most appropriate where the N sourcesink balance is dominated by relatively constant large inputs as in agricultural catchments, and it is not suitable for analysing long-term changes due to afforestation in its present structure. In this case the nitrogen requirements of the trees change dramatically with the age of the stand and the accumulation of nitrogen in the forest floor may have large implications for nitrogen cycling. Thus, to make the model applicable to forest systems, the C: N
ratios must be accounted for as well as changes in plant uptake rates and evapotranspiration.
Conclusions
INCA has been calibrated and applied to the Horndrup catchment to simulate flow and nitrogen dynamics over a three-year period. INCA reproduced the seasonal dynamics of the flow and the N-concentrations of the Horndrup Brook successfully, describing both the low flow periods and the spring flow peaks. The soil water nitrate concentrations were simulated within the observed ranges for both arable and forestland, but the seasonal dynamics were correct only in the wet year. The annual fluxes for the processes were consistent with data from other Danish studies of arable land. Leaching from the forested part of the catchment was overestimated, since no separate hydrology could be specified for forest in this patchy mixed land use.
Scenarios of afforestation of the Horndrup catchment were run with the calibrated parameter file for forest unchanged. The hydrological input data were adjusted to match the water yield for forest and the N-deposition was changed to the levels observed in forest throughfall. The model scenarios demonstrated the improvement of water quality with respect to nitrate concentrations in the soil water when converting from arable to forested land. The decrease in soil water nitrate concentrations as well as differences among conifers and deciduous stands observed in the experimental afforestation area Vestskoven were reproduced in the scenarios. The simulated effect of afforestation on N leaching was an almost direct reflection of the change in input and does not incorporate the substantial changes in plant demand and soil N dynamics, particularly accumulation of N that will happen over time after afforestation. The model was set up to compare two different land uses, arable and forest. To follow changes in plant demand and soil N dynamics when converting from arable land to forest, it is recommended to set up the model to simulate the transient conversion between arable and forest by specifying the changing hydrological and N input parameters. This could be achieved by running INCA with transient scenarios representing the temporal changes in hydrological and N inputs. To simulate and predict the changes in N dynamics more closely over longer time scales, the INCA model should be linked to other models that include more detailed plant and soil components or empirical models.
This study has contributed to the discussion on the potential benefits of afforestation of agricultural land. A change of land use from intensive agriculture to forest substantially reduces the leaching fluxes of nitrate to ground
and surface water, largely through the cessation of fertiliser and manure N input. The reductions in soil water nitrate concentrations are however less pronounced since forests (especially coniferous) have a higher evapotranspiration loss than agricultural crops. Afforestation with broadleaf species can be recommended for improvement of water quality in most agricultural areas of Denmark, whereas the coniferous species may not always yield the desired improvement. The scavenging of air pollutants by the forest canopy, especially by coniferous species, can give rise to highly elevated N inputs that far exceed the N demand of mature forest trees. This has been observed in west and central Europe. In such regions, water quality may not improve sufficiently in response to afforestation. Furthermore, in regions with limited or sparse water resources, afforestation cannot be generally recommended because of the increase in evaporation loss from forest areas..
Acknowledgements
This study has been supported by the Commission of the European Union, the INCA project (EVKI-CT-1999-00011). The AFFOREST project (EVK1-CT1999-00020) provided data from Vestskoven, thanks to Karin Hansen. The authors thank the Danish Meteorological Institute, the Royal Veterinary and Agricultural University of Copenhagen, Højbakkegård, the Danish Agricultural Research Station, Vejle County and Aarhus County for providing data for the project. A special thanks to Per Hansen and Sanne Østergaard Nielsen for making the Horndrup Brook catchment data and reports available for this study. Finally the authors thank the reviewers for very constructive comments to the present paper.
References
Anonymous, 2002. Effekten af virkemidlerne i Vandmiljøplan I og II. (The effect of measures applied in the Water Environment Plan I and II). Danish Institute for Agricultural Sciences & National Environmental Research Institute, Note of November 2002, 13pp.
Bastrup-Birk, A., Gundersen, P. and Hansen, K., 2003. Vand i skovene. I: Raulund-Rasmussen, K. & Hansen, K. (Red.), 2003. Grundvand fra skove muligheder og problemer.
Skovbrugsserien nr. 34, Skov & Landskab, Hørsholm.
Beier, C., 1998. Water and element fluxes calculated in a sandy forest soil taking spatial variability into account. Forest Ecol.
Manage., 101, 269280.
Beven, K., 1993. Prophecy, reality and uncertainty in distributed hydrological modelling. Adv. Water Resour., 16, 4151. Bosch, J.M. and Hewlett, J.D., 1982. A review of catchment
experiments to determine the effect of vegetation changes on water yield and evapotranspiration. J Hydrol., 55, 323 Calder, I.R., 1990. Evaporation in the uplands. Wiley. Chichester,
UK, 148pp.
Callesen, I., Raulund-Rasmussen, K., Gundersen, P. and Stryhn, H., 1999. Nitrate concentrations in soil water below Danish forests. Forest Ecol. Manage., 114, 7182.
Compton J.E., Boone R.D., Motzkin, G. and Foster D.R., 1998. Soil carbon and nitrogen in a pine-oak sand plain in central Massachusetts: Role of vegetation and land-use history.
Oecologia, 116, 536542.
DFNA, 1999. Planlægning af skovrejsning i regionplaner (Regional planning of afforestation). Skov- og Naturstyrelsen (Danish Forest and Nature Agency) http://www.sns.dk/skov/ vejlplanl.htm
Durand, P., 2001. Simplified assessment of hydrological effective rainfall (HER) and soil moisture deficit (SMD), unpublished technical note (durand@roazhon.inra.fr).
Egmont, K.v., Bresser, T. and Bouwman, L., 2002. The European nitrogen case. Ambio, 31, 7278.
Grant, R., Blicher-Mathiesen, G., Andersen, H.E., Grewy Jensen, P., Pedersen, M. and Rasmussen, P., 2002. Landover-vågningsoplande, 2001 - NOVA 2003 (Catchment monitoring 2001 NOVA 2003). National Environmental Research Institute, Report 420, 125 pp., http://www.dmu.dk/1_viden/ 2_Publikationer/3_fagrapporter/rapporter/FR420.pdf
Gundersen P., Callesen I. and de Vries W., 1998a Nitrate leaching in forest ecosystems is related to forest floor C/N ratios. Environ.
Pollut., 102 (S1), 403407.
Gundersen, P., Schmidt, I. K., Hansen, K., Pedersen, L.B. and Vesterdal, L., 2003. Nitrat i vand under skove. I: Raulund-Rasmussen, K. & Hansen, K. (Red.), 2003. Grundvand fra skove muligheder og problemer. Skovbrugsserien nr. 34, Skov & Landskab, Hørsholm, 3160.
Hansen, K. (Ed.), 1999. Afforestation management in North Western Europe - influence on nitrogen leaching, groundwater recharge, and carbon sequestration (AFFOREST), description of work. Danish Forest and Landscape Research Institute, Hørsholm. http://www.fsl.dk/afforest/html/getfile.asp?l=1& file=187
Hansen, K. (Ed.), 2003. Næringsstofkredsløb i skove Ionbalanceprojektet (Nutrient cycles in forests the Ionbalance project). - Forest & Landscape Research, No. 33-2003. Danish Forest and Landscape Research Institute, Hørsholm, 300pp. Hansen, P., 2000. Horndrup Bæk (LOOP 3) 1999. Landbrugsdrift.
Næringsstofudvaskning. Stoftransport. Vejle Amt, Teknik og Miljø. 83pp.
Hansen, P., 2001 Horndrup Bæk (LOOP 3) 2000. Landbrugsdrift. Næringsstofudvaskning. Stoftransport. Vejle Amt, Teknik og Miljø. 83pp.
Jansson, P.E., 1998. Simulation model for soil water andheat conditions. Description of the SOIL model. Communications 98:2 Division of Agricultural Hydrotechnics, Swedish University of Agricultural Sciences, Uppsala, 81pp.
Jarvie, H.P., Wade, A.J., Butterfield, D., Whitehead, P.G., Tindall, C.I., Virtue, W.A., Dryburgh, W. and McGraw, A., 2002. Modelling nitrogen dynamics and distributions in the River Tweed, Scotland: an application of the INCA model. Hydrol.
Earth Syst. Sci., 6, 433453.
Jensen, N.H. and Madsen, H.B., 1990. Jordprofilundersøgelser i Vandmiljøplanens Landovervågningsoplande (Soil profiles in freshwater monitoring chatchments). Landbrugsministeriet. Statens Planteavlsforsøg, Afdeling for Arealdata og Kortlægning.
Koerner, W., Dambrine, E., Dupouey, J.L. and Benoît, M.,1999. d15N of forest soil and understorey vegetation reflect the former agricultural land use. Oecologia, 121, 421425.
Kristensen, H.L., Gundersen, P., Callesen, I. and Reinds, G., 2004. Throughfall N Deposition Influences Soil Solution Nitrate Concentration Differently in European Coniferous and Deciduous Forests. Ecosystems, 7, 180192.
Kyllingsbæk, A., Duus Børgesen, C., Andersen, J.M., Damgaard Poulsen, H., Børsting, C.F., Vinther, F.P., Heidmann, T., Jørgensen, V., Simmelsgaard, S.E., Nielsen, J., Christensen, B.T., Grant, R. and Blicher-Mathiesen, G., 2000. Kvælstofbalancer i dansk landbrug - mark- og staldbalancer (Nitorgen balances in Danish agriculture field and stable balances. National Environmental Research Institute. 74pp. Ladekarl, U.L., 2001. Soil moisture, evapotranspiration and
ground water recharge in forest and heathland. Ph.D. Thesis.
Aarhus University.
Ladekarl, U.L., Nørnberg, P., Rasmussen, K.R., Nielsen, K.E. and Hansen, B., 2001. Effects of a heather beetle attack on soil moisture and water balance at a Danish heathland. Plant Soil,
229, 147158.
Nash, J.E. and Sutcliffe J.V., 1970: River flow forecasting through conceptual models, 1, a discussion of principles. J. Hydrol., 10, 282290.
Nielsen, S.Ø. and Hansen, P., 2002. Horndrup Bæk (LOOP 3), 2001. Landbrugsdrift. Næringsstofudvaskning. Stoftransport. Vejle Amt, Teknik og Miljø. 83 sider.
Persson, T., Rudebeck, A., Jussy, J.H., Colin-Belgrand, M., Priemé, A., Dambrine, E., Karlsson, P.S. and Sjöberg, R.M., 2000. Soil nitrogen turnover mineralisation, nitrification and denitrification in European forest soils. In: Carbon and nitrogen
cycling in European forest ecosystems, E.-D. Schulze (Ed.) Ecol. stud., 142, 297231.
Ritter, E., Vesterdal, L. and Gundersen, P., 2003. Changes in soil properties with time after afforestation of former intensively managed soils with oak and Norway spruce. Plant Soil, 249, 319330.
Simmelsgaard, S.E., Kristensen, K., Andersen, H.E., Grant, R., Jørgensen, J.O. and Østergaard, H.S., 2000. Empirisk model til beregning af kvælstofudvaskning fra rodzonen. N_Les - Nitrate Leaching Estimator. Danish Institute for Agricultural Sciences, Repport Markbrug No. 32. September 2000.
Vejen, F., Madsen, H. and Allerup, P., 1999. Korrektion for fejlkilder på målinger af nedbør - Korrektionsprocenter ved udvalgte stationer 1989-1999. DMI-Teknisk Rapport 00-20. Trafikministeriet, DMI, Danish Meteorological Institute. Vesterdal, L., Ritter, E. and Gundersen, P., 2002. Change in soil
organic carbon following afforestation of former arable land.
Forest Ecol. Manage., 169, 137147.
Wade, A.J., Neal, C., Soulsby, C., Smart, R.P., Langan, S.J. and Cresser, M.S., 1999. Modelling stream water quality under varying hydrological conditions at different spatial scales. J.
Hydrol., 217, 266283.
Wade, A.J., Soulsby, C., Langan, S.J., Whitehead, P.G., Edwards, A.C, Butterfield, D., Smart, R.P., Cook, Y. and Owen, R.P., 2001. Modelling instream nitrogen variability in the Dee catchment, NE Scotland. Sci. Total Envir., 265, 229252. Wade, A.J., Durand, P., Beaujouan, V., Wessels, W., Raat, K.,
Whitehead, P.G., Butterfield, D., Rankinen, K. and Lepisto, A., 2002. A nitrogen model for European catchments: INCA, new model structure and equations. Hydrol. Earth Syst. Sci., 6, 559 582. (See also Errata. Hydrol. Earth Syst. Sci., 8, 858859.) Whitehead, P.G. and Robinson, M., 1993. Experimental basin
studies, an international and historical perspective of forest impacts. J. Hydrol., 145, 217230.
Whitehead, P.G., Wilson, E.J. and Butterfield, D., 1998. A semi-distributed integrated nitrogen model for multiple source assessment in catchments (INCA) Part I model structure and process equations. Sci. Total Envir., 210/211, 547-558. Whitehead, P.G., Lapworth, D.J., Skeffington, R.A. and Wade,
A.J., 2002. Excess nitrogen leaching and C/N decline in the Tillingbourne catchment, southern England. Hydrol. Earth Syst.