HAL Id: hal-00299351
https://hal.archives-ouvertes.fr/hal-00299351
Submitted on 19 Jul 2006
HAL is a multi-disciplinary open access
archive for the deposit and dissemination of
sci-entific research documents, whether they are
pub-lished or not. The documents may come from
teaching and research institutions in France or
abroad, or from public or private research centers.
L’archive ouverte pluridisciplinaire HAL, est
destinée au dépôt et à la diffusion de documents
scientifiques de niveau recherche, publiés ou non,
émanant des établissements d’enseignement et de
recherche français ou étrangers, des laboratoires
publics ou privés.
Avalanche risk assessment ? a multi-temporal approach,
results from Galtür, Austria
M. Keiler, R. Sailer, P. Jörg, C. Weber, S. Fuchs, A. Zischg, S. Sauermoser
To cite this version:
M. Keiler, R. Sailer, P. Jörg, C. Weber, S. Fuchs, et al.. Avalanche risk assessment ? a multi-temporal
approach, results from Galtür, Austria. Natural Hazards and Earth System Science, Copernicus
Publications on behalf of the European Geosciences Union, 2006, 6 (4), pp.637-651. �hal-00299351�
www.nat-hazards-earth-syst-sci.net/6/637/2006/ © Author(s) 2006. This work is licensed under a Creative Commons License.
and Earth
System Sciences
Avalanche risk assessment – a multi-temporal approach, results
from Galt ¨ur, Austria
M. Keiler1, R. Sailer2, P. J¨org2, C. Weber3, S. Fuchs4, A. Zischg5, and S. Sauermoser6
1Department of Geography and Regional Research, University of Vienna, Austria
2Federal Research and Training Centre for Forests, Natural Hazards and Landscape (BFW), Department of Natural Hazards
and Alpine Timberline, Innsbruck, Austria
3Federal Service for Torrent, Erosion and Avalanche Control, District Office Imst and Landeck, Austria
4Institute of Mountain Risk Engineering, University of Natural Resources and Applied Life Sciences, Vienna, Austria 5Geo Information Management, Gargazzone, Italy
6Federal Service for Torrent, Erosion and Avalanche Control, Section Tyrol, Innsbruck, Austria
Received: 1 August 2005 – Revised: 10 May 2006 – Accepted: 10 May 2006 – Published: 19 July 2006
Abstract. Snow avalanches pose a threat to settlements and infrastructure in alpine environments. Due to the catas-trophic events in recent years, the public is more aware of this phenomenon. Alpine settlements have always been con-fronted with natural hazards, but changes in land use and in dealing with avalanche hazards lead to an altering perception of this threat. In this study, a multi-temporal risk assessment is presented for three avalanche tracks in the municipality of Galt¨ur, Austria. Changes in avalanche risk as well as changes in the risk-influencing factors (process behaviour, values at risk (buildings) and vulnerability) between 1950 and 2000 are quantified. An additional focus is put on the interconnec-tion between these factors and their influence on the resulting risk.
The avalanche processes were calculated using different simulation models (SAMOS as well as ELBA+). For each avalanche track, different scenarios were calculated accord-ing to the development of mitigation measures. The focus of the study was on a multi-temporal risk assessment; conse-quently the used models could be replaced with other snow avalanche models providing the same functionalities. The monetary values of buildings were estimated using the vol-ume of the buildings and average prices per cubic meter. The changing size of the buildings over time was inferred from construction plans. The vulnerability of the buildings is un-derstood as a degree of loss to a given element within the area affected by natural hazards. A vulnerability function for different construction types of buildings that depends on avalanche pressure was used to assess the degree of loss. No general risk trend could be determined for the studied avalanche tracks. Due to the high complexity of the
vari-Correspondence to: M. Keiler
ations in risk, small changes of one of several influencing factors can cause considerable differences in the resulting risk. This multi-temporal approach leads to better under-standing of the today’s risk by identifying the main changes and the underlying processes. Furthermore, this knowledge can be implemented in strategies for sustainable development in Alpine settlements.
1 Introduction
Avalanches are natural processes in alpine regions. The ex-posure of people and properties as well as infrastructure ren-ders these natural processes hazardous. In the Alps, strate-gies to avert or to reduce the effects of natural hazards in areas of settlements and economic activities have a long tra-dition. In the second half of the nineteenth century, official authorities were founded in Switzerland (Frutiger, 1980) and in Austria (e.g. in the year 1884) (Bergthaler, 1975) to organ-ise protection against natural hazards. In the following half century, permanent measures reducing and deflecting haz-ard processes were developed and built. High investments were required for ‘reactive’ mitigation measures after ex-treme avalanche events and debris flow events in the 1950s and 1960s. Due to limited financial resources, it was not fea-sible to build such structures in all endangered areas. This situation changed the way in which natural hazards are dealt with, and additional “passive” mitigation measures, e.g. haz-ard zone maps, were introduced. To identify hazhaz-ard zones, defined design events are used in order to estimate the range and pressure distribution of the processes (Weiss, 2002). In spite of the successful application of the hazard zone maps since the mid-1970s, natural hazards caused large damage in
638 M. Keiler et al.: Avalanche risk assessment – a multi-temporal approach settlement areas in the 1990s, as shown for Switzerland by
Br¨undl and Hegg (2001), and particularly due to avalanches in the winter 1999 in the whole Alpine region (Heumader, 2000; SLF, 2000). The increased use of hazard-prone ar-eas for human settlement and related infrastructure has been assumed to be responsible for the increased losses during pe-riods of high hazard activity (see e.g. Ammann, 2001; Bar-bolini et al., 2002). This trend – recognised world-wide – induced White, Kates and Burton (2001) to publish a review of books addressing natural hazard research, with the title “Knowing better and losing even more – the use of knowl-edge in hazard management”. One of their proposed expla-nations for this observed increase includes a rise in vulnera-bility and in population, in wealth and in poverty (White et al., 2001). Additionally, the authors point out that compre-hensive data is lacking on recorded and estimated losses in proportion of the total monetary values.
The rising losses led to an increased emergence of the risk concepts in natural hazard research since the 1990s. In the area of natural science, risk (Ri,j)dependent on scenario i
and object j is defined as a function of the probability of scenario i (pSi), the value of object j (AOj), the probability
of exposure of object j to scenario i (pOj,Si)and the
vul-nerability of object j , dependent on scenario i (vOj,Si), see
Eq. (1):
Ri,j =pSi·AOj·pOj,Si·vOj,Si (1) A fundamental characteristic of risk resulting from natural hazards is the connectivity between the physical system (or geosystem, governing the physical part of the process) and the social system (including values at risk and vulnerabil-ity). Both systems are subject to continuous changes over time. Caused by these dynamics, new interaction emerges and therefore enhanced connectivity can develop. Increas-ing connectivity is likely to induce higher complexity (Huf-schmidt et al., 2005). Hence, rising losses related to natu-ral hazard processes can neither be solely connected to the changes of the natural processes nor to the development of the damage potential and the vulnerability. These losses are the result of increasing complexity.
In Alpine countries, the emphasis in natural hazard re-search has so far been on the determination of the hazard potential and the related probability of occurrence by exam-ining, modelling, and assessing individual processes. Only recently, attention has been given to damage potential (Keiler et al., 2004; Kleist et al., 2004; BWG, 2005; Fuchs et al., 2005; Zischg et al., 2005) and the vulnerability as well as to the connectivity of these factors used for the risk assessment. Furthermore, risk analyses applied to natural hazards are in general static approaches (J´onasson et al., 1999; Keylock et al., 1999; G¨achter and Bart, 2002; Bell and Glade, 2004). However, risk related to natural hazards is subject to tem-poral changes since the risk-influencing factors are variable over time (Fuchs and Keiler, 2006).
In the twentieth century, the natural avalanche activity seems to be neither significantly increasing nor decreasing, although the variability of events makes an exact statement difficult (Bader and Kunz, 1998; Schneebeli et al., 1998; Lat-ernser, 2002). Thus, it can be assumed that changes of the natural processes are due to the construction of permanent mitigation measures in the release areas or run out areas of avalanche tracks. In Switzerland, about EUR 1 billion has been invested for this purpose since 1950 (SLF, 2000).
The societies in the Alps have undergone considerable socio-economic changes since the mid-twentieth century. This development reflects a shift from farming-based activ-ities towards a tourism and leisure-time-orientated economy (B¨atzing, 1993). Contemporaneously, settlements and the population increased significantly in the Eastern Alps. A similar trend is outlined for the damage potential in Keiler (2004); Fuchs and Br¨undl (2005); Keiler et al. (2005).
The factor vulnerability is crucial for a coherent risk as-sessment. However, large gaps in the knowledge about vul-nerability exist, as well as different ways of understanding vulnerability. Cutter (1996) listed 18 definitions of vulnera-bility to environmental hazards, which arose between 1980 and 1995. She states that many of the discrepancies in the meanings of vulnerability develop from different epistemo-logical orientations (physical science, political ecology, hu-man ecology, spatial analysis). In natural science vulnera-bility is related to the susceptivulnera-bility of people, buildings and infrastructure with respect to the hazard. The consequences are expressed as the degree of loss and the results are the probability of lives or monetary values lost (IUGS, 1997). In social science vulnerability can be understood as “the char-acteristics of a person or group and their situation that in-fluence their capacity to anticipate, cope with, resist and re-cover from, the impact of a natural hazard” (Wisner et al., 2003: 11). There is a lack of studies on vulnerability related to avalanches in general as well as on temporal changes of vulnerability in both natural science and social science.
The objective of this study was to partly close this gap by studying temporal changes of avalanche risk. To as-sess the avalanche risk based on a temporal approach, risk-influencing factors have to be analysed over time. Changes of the risk-influencing factors have natural, social, econom-ical and techneconom-ical reasons. Therefore, the development of those factors has to be regarded separately and their inter-connections have to be analysed. In this study, the avalanche risk is calculated for the number and the value of endan-gered buildings using Eq. (1) in steps of decades from 1950 to 2000 to illustrate dynamic changes. Thus, the probability of exposure of object j to scenario i (pOj,Si)was given the
value of one since buildings are immobile property. These risk analyses are carried out on three avalanche tracks in the commune of Galt¨ur. The settlement of Galt¨ur is highly en-dangered by avalanches, a fact that has been publicly known since the avalanche event of 1999 (Heumader, 2000; SLF, 2000). The study area Galt¨ur is located in the inner Paznaun
valley in Tyrol, Austria. The community is endangered by 26 avalanche tracks; 111 buildings with a value of EUR 64 mil-lion (year 2000) are located in the run out zone of these avalanches. Due to passive (e.g. hazard zone map) mitigation measures, the increase of buildings in the avalanche-prone area could be reduced. Thus, in combination with active mitigation measures (supporting structures, deflecting dam), nearly 75% of the buildings were protected (Keiler, 2004). Recent findings on occurring avalanche impact pressures (p) after the avalanche event in 1999 led to changed pressure limits for the red (p>10 kPa) and the yellow hazard zones (1 kPa<p<10 kPa) in Austria1. Hence, the red as well as the yellow hazard zones will be extended in the course of the re-vision of the legally binding hazard zone map during the next years. When delimiting the new hazard zones for avalanche tracks, traditional methods such as field studies and analy-ses of former avalanche events are used as well as simulation models. Therefore, the results of this study might also pro-vide a basis for the implementation of the changed delimi-tation criteria and for the construction codes considering the vulnerability of the buildings.
2 Method
In the following sections the applied methods used for recording and analysing the changes of risk-influencing fac-tors are described. The calculation of the avalanche risk is based on the probability of occurrence of the legally defined design event of 150 years. Therefore, the avalanche risk is expressed as the potential monetary loss of building values resulting from this design event.
2.1 Avalanche processes and modelling
In this study, two different avalanche simulation models were applied aiming for an enhanced plausibility of the results. The models SAMOS (version SAMOS99) as well as ELBA+ were developed in Austria under the auspices of the Aus-trian Ministry for Agriculture during the late 1990s. Both models are in operational use by the Federal Service for Tor-rent, Erosion and Avalanche Control. A detailed description for the model SAMOS is given by Sailer et al. (2002) and Sampl and Zwinger (2004). ELBA+ is an improved version of the model ELBA, which is described in-depth by Volk and Kleemayr (1999). The focus of the study was on a multi-temporal risk assessment, thus the used models could be re-placed with other snow avalanche models providing the same functionalities.
1BMLF (Austrian Federal Ministry of Agriculture and
Forestry): Gefahrenzonenplanung, Richtlinien f¨ur die Abgrenzung von Gefahrenzonen, ¨Ubermittlung zur Anwendung, Bundesmin-isterium f¨ur Land- und Forstwirtschaft, Abteilung V Forstwesen, Gesch¨aftssache 52.240/10-VC6a/99, Wien, unpublished, 1999.
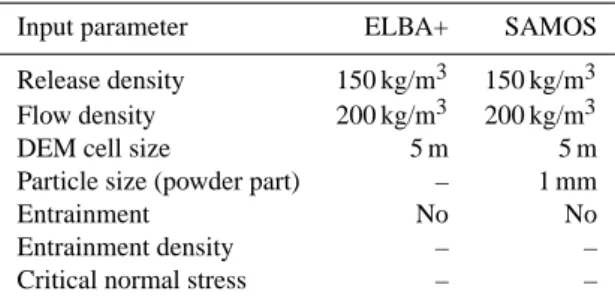
Table 1. Input parameters used for the simulation models SAMOS
and ELBA+.
Input parameter ELBA+ SAMOS Release density 150 kg/m3 150 kg/m3 Flow density 200 kg/m3 200 kg/m3 DEM cell size 5 m 5 m Particle size (powder part) – 1 mm
Entrainment No No
Entrainment density – – Critical normal stress – –
The flow part of the avalanches has been calculated with SAMOS and ELBA+. The associated powder part is a re-sult of calculations with SAMOS. The input parameters were chosen for the design event with a reoccurrence interval of 150 years. Since the local records of avalanche events do not cover a 150-year event, the extrapolated 150-year amount of new snow in three days was taken instead, in accordance with international practice. The 150-year event was applied because it serves as basis for the delimitation of the hazard zones in Austria. The values used during calculations are summarised in Table 1. For each avalanche track, the simula-tions were carried out first without any supporting structures in the release area (maximum scenario) and second under consideration of the existing mitigation measures (minimum scenario). For the minimum scenario it was assumed that the existing catching dam and the support structures are fully effective.
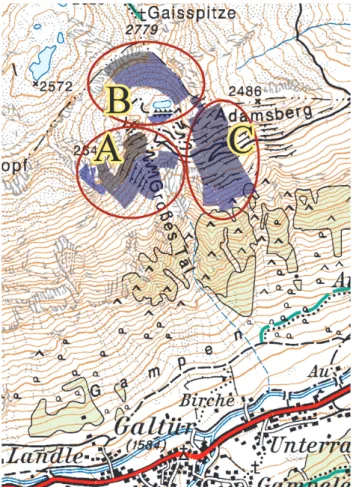
The settlement area in the study area is endangered by three main south-facing avalanches – Grosstal West, Grosstal East, Gidisrinner (cf. Fig. 1). Each of these avalanches was divided into several sub-release areas, concerning variable snow cover distributions and different protection measures (catching dam, support structures). Grosstal West shows the most differentiated release area and consists of seven sub-release zones at most (maximum scenario) with a total area of 96 000 m2(33 kt release mass). Approximately one third of this area has been covered with supporting structures since 1977. As the Grosstal West avalanche is not directly con-nected to the main mountain ridge the used snow depths (1.5 m to 2.25 m) for the simulation are slightly lower compared to the other two avalanches. In contrast, the Grosstal East avalanche starts directly beneath the main ridge and is di-vided only in two release areas (78 000 m2, 26.4 kt release mass). At the lower border of the cirque a catching dam was built by the Federal Service for Torrent, Erosion and Avalanche Control in 1982. The front of this dam itself acts as a small release area; according to the simulations, it may be neglected in this context. The release zone of the third avalanche track – the Gidisrinner avalanche – differs again from the two others; this release area shows a large vertical
640 M. Keiler et al.: Avalanche risk assessment – a multi-temporal approach
Fig. 1. Avalanche sites and release areas (Grosstal West avalanche
(A), Grosstal East avalanche (B), Gidisrinner avalanche (C)) in the study area of the community Galt¨ur. Areas of the release area coloured in light blue indicate small release depths (>1.0 m) and areas coloured in grey indicate large release depths (<2.4 m). Map basis reproduced with permission of Bundesamt f¨ur Eich- und Ver-messungswesen, Blatt 170, Galt¨ur.
range. The major part (80%) of the release zone has been covered with support structures since 1989. The remaining 20% are the lowermost region with a release depth in the or-der of 1.3 and 1.75 m due to the large distance to the moun-tain ridge. The Gidisrinner avalanche is subdivided into three release areas with a total area of 135 000 m2 and a release mass of at most 40 kt. The aggregated release areas and mass of each avalanche is shown in Table 2 for the minimum as well as for the maximum scenario of the simulation.
The simulations with SAMOS provide information on ve-locity, deposit distribution, deposit depth and impact pres-sure of each avalanche. For this study, the impact prespres-sure of the avalanche on buildings was the most important fac-tor. The following statements on peak pressures apply to the lowest layer of the three-dimensional grid used for simulat-ing the powder-snow part at approximately 2.5 m above the dense-flow part. The impact pressure at affected buildings
Table 2. Aggregated release areas and release masses of the three
avalanche tracks for the maximum and the minimum scenario.
Avalanche Release mass [kt] Release area [m
2]
minimum maximum minimum maximum
Grosstal West 19.0 33.0 59 000 96 000
Grosstal East 26.4 26.4 78 000 78 000
Gidisrinner 8.1 39.9 33 000 135 000
was taken to be the pressure at the respective polygon centre for the further vulnerability analysis.
2.2 Building values at risk
The monetary values of buildings were calculated using the volume of the buildings and average prices per cubic meter for new buildings, as used by insurance companies. The re-cent size of the buildings was recorded from digital datasets of the communality administration and provided the basis for the evaluation of the values. The changing size of the build-ings in the course of time was inferred from construction plans or construction descriptions. Thus, the original build-ing size could be traced back to the year 1950. For the value calculation different price levels were applied, depending on the function of the buildings as well as on the number and kind of storeys. This information was mapped in the field or extracted from the construction descriptions. The evaluation was carried separately for each decade using the 2002 price level. In order to allow intersection with the avalanche pro-cess data for the further analysis, digital information on the location of the buildings was provided by the government of the State of Tyrol, Division of Spatial Planning and Statistics (TIRIS). The digital data was incorporated in a Geographical Information System (GIS) and updated by fieldwork and in-terpretation of orthophotos. Additionally, the values and the functions of the buildings as well as their year of construction were joined to the spatial data in the GIS (Keiler, 2004). 2.3 Vulnerability
In natural hazard risk assessment, the vulnerability factor is used in different contexts. The term vulnerability is restricted in the perception of natural and technical science as the de-gree of loss (0 = no loss, 1 = total loss) to a given element or set of elements within the area affected by natural haz-ards (for a compilation, see Glade, 2003). However, stan-dardised approaches to evaluate the effects of avalanches to buildings are still missing (Hollenstein et al., 2002). Bar-bolini et al. (2004) proposed an empirical vulnerability rela-tion for alpine buildings based on the studies of J´onasson et al. (1999) and Keylock and Barbolini (2001). To this end, two avalanche events in Austria were re-calculated with the model SAMOS, and the impact pressure of the avalanches
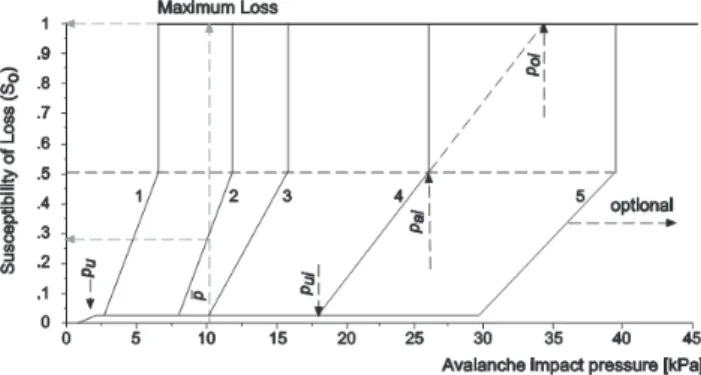
was estimated for each affected building. Knowing the de-gree of damage and the deduced specific loss of the build-ings, the vulnerability function was analysed for five impact pressure ranges (Barbolini et al., 2004). However, the hetero-geneous construction methods of buildings in the Alps due to their age and function as well as socio-economic changes are disregarded in the estimation of Barbolini et al. (2004). Especially for a temporal approach of avalanche risk assess-ment this perspective is very important in the vulnerability analysis. Therefore, the vulnerability functions for different construction types of buildings (building categories) related to avalanche pressure (expressed in kPa) were used in this study, as outlined in Wilhelm (1997) (Fig. 2). The suscepti-bility of loss to the building categories is partly based on the analyses of destroyed buildings during the avalanche winter 1954 in Vorarlberg, Austria, by Voellmy (1955) (cf. Wilhelm 1997).
Wilhelm (1997) differentiates between four vulnerability thresholds (see Fig. 2):
– The general damage level (pu) corresponds to an avalanche pressure of 2–3 kPa and causes mentionable damage (estimated at 3%), such as destroyed windows and doors.
– The specific damage level (pui)is the consequence of
an avalanche impact pressure that inflicts damage on the building structure. Thus, each building category has a different specific damage level due to its different con-struction type.
– The destruction level (poi)describes the avalanche
pres-sure that can produce maximum loss within each build-ing category.
– The detach limit (pai) of each building category
de-scribes a damage threshold below the destruction level, but demolition and reconstruction of the buildings is necessary. Therefore, maximum loss is postulated for a degree of susceptibility to loss of 50% and more be-cause additional costs arise for the demolition and re-construction that can add up to the maximum loss. For the vulnerability assessment, the existing buildings were categorised by mapping in the field. Additionally, the date of construction, the construction plans and descriptions as well as the functions of the buildings were used to identify the building categories back to the 1950s. The vulnerability of buildings can be remarkably reduced by integrated mitigation measures, like avalanche deflectors and reinforced construc-tion on the exposed side of the buildings (Fig. 3). In the study area, avalanche deflectors have a long tradition as protecting measures and can be traced back to the year 1613 (Gemeinde Galt¨ur, 2006). Therefore, avalanche deflectors were identi-fied in the field and their effectiveness was assessed. Since the introduction of the legally binding hazard zone maps in 1986, buildings in the red and in the yellow hazard zone have
Fig. 2. The degree of possible loss is a function of the avalanche
im-pact pressure and the vulnerability of buildings, the latter varies due to the material used for construction (building categories). Building categories: 1 = lightweight construction, 2 = mixed construction, 3 = massive construction, 4 = concrete reinforced construction, 5 = reinforced construction. Limiting values: pu= damage level,
pui= specific damage level, pai= detach limit, poi = destruction
level, p = avalanche pressure (outlined in Wilhelm, 1997: 72).
to fulfil special construction requirements to reduce possible damage. These requirements are defined for each existing building as well as for new buildings due to the specific haz-ard (avalanche pressure) by the Federal Service for Torrent, Erosion and Avalanche Control and are documented in the construction records of the commune. For the study it was assumed that these special requirements were implemented accordingly. Hence, they have been considered in the vul-nerability assessment. These construction requirements have only become operative in the legally binding hazard zones. However, the results of the simulated run-out zones might not always be congruent with these hazard zones. Thus, buil-dings outside the hazard zone can be exposed to the simu-lated avalanche pressures, but no special construction regu-lations exist for these buildings. Due to the different vul-nerability caused by this aspect, the proportion of buildings inside to buildings outside the hazard zones is calculated to get further information on losses.
3 Results
In the following sections, an overview of the general results for each factor of the risk equation (Eq. 1) associated with the temporal avalanche risk assessment is given. Changes of the avalanche risk related to the three avalanche tracks are shown in detail.
3.1 Changes in the avalanche run out zone and in the
avalanche pressure
The flow part of the avalanches, calculated with SAMOS and ELBA+ reaches the valley floor neither in the minimum nor in the maximum scenario. For the maximum scenario
642 M. Keiler et al.: Avalanche risk assessment – a multi-temporal approach
Fig. 3. Building with an integrated avalanche deflector on the uphill
side of a building located in the community of Galt¨ur.
of the Grosstal West avalanche track, only two very ex-posed buildings are marginally affected by the simulated flow part. However, the minimum and maximum scenarios of each avalanche differ significantly. The minimum scenarios predict short run-out lengths whereas no considerable differ-ences between SAMOS and ELBA+ are observable. Solely the lateral spread of the flow part calculated with SAMOS is slightly wider than that of ELBA+ simulations. This is a well known phenomenon with no effect on buildings or forests in this particular case. This malfunction is already improved in the advanced version of SAMOS (version SAMOS04), which is under development.
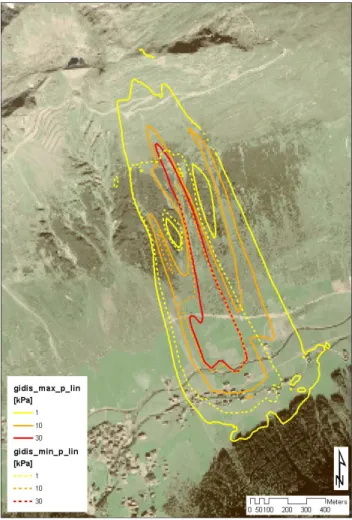
Due to the steep terrain, the variance of the powder part is less distinctive between minimum and maximum scenario. The reduced mass of the minimum scenario seems to be large enough to supply the powder part with sufficient snow. Af-ter the hold-up of the flow part, the powder part overflows the bottom of the unobstructed valley. In general, the peak pressures obtained from SAMOS simulations are relatively low for the calculated avalanches in the study area. For the maximum scenario, the highest impact pressure on a build-ing was calculated at 23 kPa. Eight percent of the buildbuild-ings are exposed to pressures above 10 kPa and nearly 28% to an impact above 5 kPa. Regarding the minimum scenario, the highest pressure amounts to 13 kPa and only three percent of the buildings are exposed to an impact above 10 kPa. The proportion of the number of buildings endangered by a pres-sure above 5 kPa was reduced to 13%. The 30 kPa outline does not touch the settlement area. The peak pressures of the powder part on other buildings in the investigation area are below this value. The results of the SAMOS model (powder part) of the Gidisrinner avalanche are illustrated in Fig. 4.
Fig. 4. Comparison of the extent of the avalanche run-out zone
of the Gidisrinner avalanche, calculated for the minimum (dashed lines) and maximum (solid lines) scenarios using the simulation model SAMOS to model the flow and powder part of the avalanche.
3.2 Changes of building values at risk
In the study area, the total building values (corresponding to the maximum scenario) rose by a factor of five between 1950 and 2000. This increase of values is below the development of the total value of all buildings in the community (factor of 8, Keiler, 2004). A similar trend is found for the number of buildings, however with a smaller difference (factor of 2.4 for the study area and a factor of 2.6 for the entire commune). The stronger increase of the building values compared to the number of buildings is due to changes in the function of the buildings from farm buildings or basic residential buildings to buildings with tourist infrastructure like guest houses or hotels. Additional factors are the rising building sizes as a result of the reconstruction of buildings and/or the extension of existing building (Keiler, 2004).
3.3 Changes of vulnerability
The vulnerability of the buildings in the study area was sub-ject to temporal changes. In general, buildings were shifted from category 2 to category 3 due to a) changes in the build-ing functions and b) associated changes of structure and of construction materials (see Fig. 2).
To determine a general development of the vulnerability factor, the total building values were compared to the cal-culated possible loss considering the susceptibility of the buildings to the avalanche pressure. In 1950, an average loss of 7% of the total building values was estimated for all avalanche tracks if a design event had occurred.
In 2000, this proportion was continuously reduced to about 3.5% for the Grosstal West avalanche and to about 2.8% for the Grosstal East avalanche due to changes in the building categories (Table 3 and Fig. 2).
For the area affected by the Gidisrinner avalanche, the de-velopment of the vulnerability was influenced by the con-struction of buildings in areas where high peak pressures of the powder part occur. Therefore, the proportion of possible losses to the total building values increased to 26.6% until 1980. The introduction of the construction requirements in the 1980s caused a change from the building category 4 to the building category 5. Thus, the proportion of the possible losses compared to the total building values exposed to the Gidisrinner avalanche was reduced to 6% in 2000.
3.4 Development of avalanche risk
The following results show the changes of the avalanche risk, expressed as the potential monetary loss of buildings result-ing from the occurrence of the defined design event. First, the development of the number of buildings exposed to the different impact pressures due to the calculation of the maxi-mum and the minimaxi-mum extent of the different avalanche run-out zones is given. Furthermore, for each avalanche track different risk scenarios were calculated in steps of decades between 1950 and 2000:
– Risk scenario A describes the development of the to-tal building values at risk in the maximum extent of the avalanche. Accordingly, the influence of mitigation measures and the vulnerability of the elements at risk were not considered (the factor vulnerability is set to one). This scenario corresponds to the term “possible maximum loss” (PML, total damage) in the insurance industry.
– Risk scenario B shows the cumulative possible loss re-garding the maximum extent of the avalanche if no mit-igation measures had been constructed. The vulnerabil-ity of the elements at risk was taken into account. – Risk scenario C illustrates the real-time change of the
possible loss, taking into account changes of all three
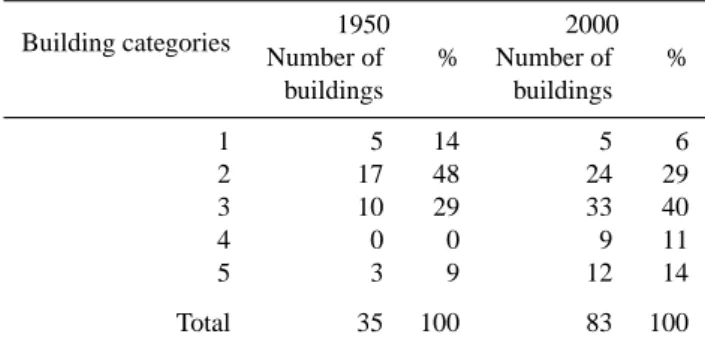
Table 3. Number of exposed buildings regarding the maximum
sce-nario of all three avalanches divided in the different building cate-gories cf. Wilhelm (1997) and their proportion to the total number of exposed buildings in the year 1950 and 2000. Building categories: 1 = lightweight construction, 2 = mixed construction, 3 = massive construction, 4 = concrete reinforced construction, 5 = reinforced construction. Building categories 1950 2000 Number of % Number of % buildings buildings 1 5 14 5 6 2 17 48 24 29 3 10 29 33 40 4 0 0 9 11 5 3 9 12 14 Total 35 100 83 100
risk-influencing factors, (1) the shifts in the values at risk, (2) the varying vulnerability of buildings and (3) the construction of supporting structures.
3.4.1 Number of buildings
Grosstal West avalanche
In the study area, the highest number of buildings has been located in the run-out zone of the Grosstal West avalanche (maximum scenario) since the 1950s (Fig. 5). Furthermore, in this area, the strongest increase in the number of buildings between 1950 and 2000 was calculated (by a factor of 2.5, Fig. 6). Considering the reduction of the run-out zone due to supporting structures (minimum scenario), this factor was 2.3 in the year 2000 (Fig. 6). The construction of avalanche supporting structures in the release area in 1977 showed nearly no effect on the simulated impact pressure and the extent of the run-out zone. However, only five of 42 buildings were exposed to an impact pressure higher than 5 kPa in the year 2000, according to the maxi-mum scenario (Table 4). In 2000, 39 buildings were located in the run-out zone of the minimum scenario (Fig. 5a) and still five buildings were exposed to an impact pressure higher as 5 kPa (Table 4). Concerning the simulation results, most of the buildings endangered by the Grosstal West avalanche were situated outside the legally declared avalanche-prone area (Fig. 5a). The proportion of buildings located inside a hazard zone (red or yellow) compared to the exposed buildings outside the hazard zones provided information on a) the influence of hazard zone map on the land use planning as well as b) on the amount of buildings inside the hazard zone which were affected by the construction requirements. This proportion increased continuously from
644 M. Keiler et al.: Avalanche risk assessment – a multi-temporal approach
Table 4. Number of buildings exposed to different impact categories (in kPa) in the run-out zones of the avalanche tracks in the year 1950
and 2000, considering both maximum scenario (= max, without supporting structure in the release area) and minimum scenario (= min, with supporting structure in the release area).
Avalanche Year <5 5–<10 10–<15 15–<20 20–<25 max min max min max min max min max min
Grosstal West 1950 15 – 0 – 2 – 0 – 0 – 2000 37 34 3 3 2 2 0 0 0 0 Grosstal East 1950 6 – 0 – 0 – 0 – 0 – 2000 14 8 1 1 0 0 0 0 0 0 Gidisrinner 1950 6 – 5 – 1 – 0 – 0 – 2000 10 10 12 2 3 0 1 0 1 0
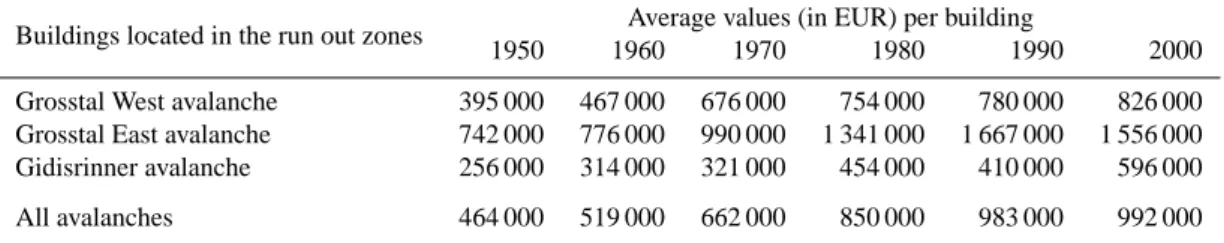
Table 5. Average values (in EUR) per building between 1950 and 2000 for buildings located in the run out zone of the study area, considering
the maximum scenario.
Buildings located in the run out zones Average values (in EUR) per building
1950 1960 1970 1980 1990 2000 Grosstal West avalanche 395 000 467 000 676 000 754 000 780 000 826 000 Grosstal East avalanche 742 000 776 000 990 000 1 341 000 1 667 000 1 556 000 Gidisrinner avalanche 256 000 314 000 321 000 454 000 410 000 596 000 All avalanches 464 000 519 000 662 000 850 000 983 000 992 000
24% in 1950 to 36% in 2000 (Fig. 5a). The buildings out-side the hazard zone were exposed to lower impact pressures.
Grosstal East avalanche
In contrast to the Grosstal West avalanche, only six buildings were exposed to the Grosstal East avalanche in 1950 (Fig. 5b). In 2000, the number of buildings in this area increased to 14 buildings in the maximum scenario (i.e., by a factor of 2.3, Fig. 6) and to nine buildings for the minimum scenario (Fig. 5b; equals a factor of 1.5, Fig. 6), respectively. According to the simulations, an impact pressure of 5 kPa occurred for one building both in the maximum and in the minimum scenario (Table 4). For all other buildings, the peak pressure of the powder part was below this value (Table 4). By 1970, the number of buildings in the simulated avalanche-prone area (maximum scenario) had doubled, whereas the proportion of buildings in the area of the legally binding hazard maps to buildings outside this area was 50% in 1950 and decreased to 42% until 1970 (Fig. 5b). This change was caused by intensified development in the fringe area of the avalanche run-out zone. Between 1970 and 1980, the number of buildings did not change in the area of the maximum scenario. It declined by one third to eight buildings due to the construction of the catching dam in the release area in 1982 (Fig. 5b). Regarding the simulated run-out zone of the minimum scenario, this dam
was more effective in protecting buildings in the hazard zones because in this area, the number of exposed buildings was more strongly reduced than outside the hazard zones. Therefore, the proportion of buildings inside the hazard zone to buildings outside the hazard zone was reduced to 22% (Fig. 5b), but for different reasons compared to the period between 1950 and 1970.
Gidisrinner avalanche
In 1950, twelve buildings were located in the simu-lated hazard-prone area of the Gidisrinner avalanche (maximum scenario, Fig. 5c). For the maximum scenario, this number increased to 27 buildings until 2000 (equals a factor of 2.3, Fig. 6). Regarding the minimum scenario after the construction of the supporting structures in the 1980s, the number of buildings in this avalanche-prone area was reduced from 20 to ten (Fig. 5c). Due to renewed construction activity during the 1990s, an equal number of buildings was situated in the avalanche-prone area in 2000 (minimum scenario) as it had been in 1950 for the maximum scenario (Fig. 5c). The simulations showed the highest impact pressure in the study area to occur in this avalanche track (Table 4). One very exposed building, which was con-structed in 1960, would be subjected to a pressure of 23 kPa (Table 4). According to the maximum scenario in 2000, the peak pressure of the powder part exceeds 10 kPa for five
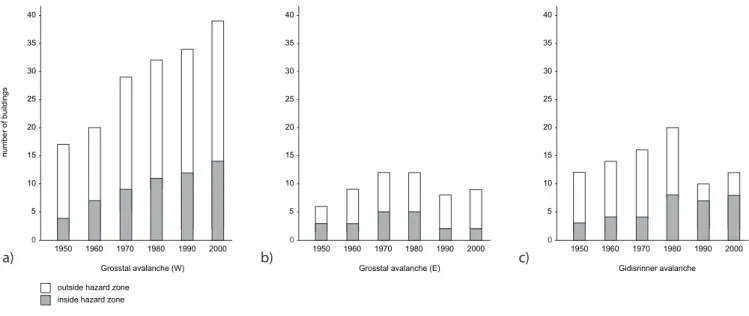
outside hazard zone inside hazard zone
Gidisrinner avalanche 1950 1960 1970 1980 1990 2000 c) 0 15 10 25 20 30 35 40 5 Grosstal avalanche (W) number of buildings 1950 1960 1970 1980 1990 2000 a) 0 15 10 25 20 30 35 40 5
Grosstal avalanche (E) 1950 1960 1970 1980 1990 2000 b) 0 15 10 25 20 30 35 40 5
Fig. 5. Development of the number of buildings between 1950 and 2000 located in the run-out zones of the maximum scenario and after the
construction of the mitigation measures (supporting structures, catching dam) in the run-out zones of the minimum scenario for the Grosstal West avalanche (a), the Grosstal East avalanche (b) and the Gidisrinner avalanche (c). The number of buildings is given separately for the buildings situated inside the legally binding hazard zones (introduced in the year 1986) and those situated outside the hazard zones.
0,8 1,0 1,2 1,4 1,6 1,8 2,0 2,2 2,4 2,6 1950 1960 1970 1980 1990 2000 Factor (1950 = 1,0)
Grosstal (W) maximum scenario Grosstal (E) maximum scenario Gidisrinner maximum scenario Grosstal (W) minimum scenario Grosstal (E) minimum scenario Gidisrinner minimum scenario
Fig. 6. Proportional development of the number of exposed buildings regarding the maximum scenario and the minimum scenario for all
three avalanche tracks, 1950 as basis.
buildings and 5 kPa for 17 buildings, respectively (Table 4). Due to the construction of supporting structures in 1989, the impact pressure on buildings was reduced to highest values of 7 kPa (one building) and 5 kPa (one building) (Table 4).
The proportion of buildings within the legal hazard zones to buildings outside hazard zones was almost a quarter until 1970 (Fig. 5c). During the 1970s, this proportion increased to 40% as a result of the construction of new buildings inside
646 M. Keiler et al.: Avalanche risk assessment – a multi-temporal approach
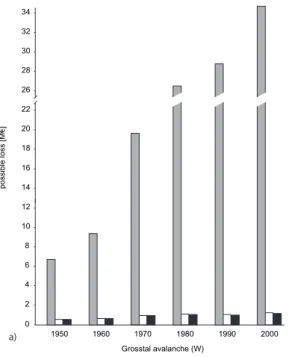
poss. loss without vulnerability (PML, risk scenario A) poss. loss including vulnerability (risk scenario B)
poss. loss including vulnerability and mitigation measures (risk scenario C) Grosstal avalanche (W) a) 1950 1960 1970 1980 1990 2000 possible loss [M€] 6 4 10 8 12 14 16 2 28 30 32 34 22 20 26 18 0
Grosstal avalanche (E)
b) 1950 1960 1970 1980 1990 2000 6 4 10 8 12 14 16 2 28 30 32 34 22 20 26 18 0 possible loss [M€] Gidisrinner avalanche 1950 1960 1970 1980 1990 2000 c) 6 4 10 8 12 14 16 2 28 30 32 34 22 20 26 18 0 possible loss [M€]
Fig. 7. Development of the possible losses related to the Grosstal West avalanche (a), the Grosstal East avalanche (b) and the Gidisrinner
avalanche (c) regarding risk scenarios A, B and C between 1950 and 2000. Risk scenario A describes the development of the total building values at risk in the maximum extent of the avalanche. Risk scenario B shows the cumulative possible loss regarding the maximum extent of the avalanche if no mitigation measures had been constructed. The vulnerability of the elements at risk is taken into account. Risk scenario C illustrates the time change of the possible loss, taking into account changes of all three risk-influencing factors, (1) the shifts in the values at risk, (2) the varying vulnerability of buildings and (3) the construction of supporting structures.
the hazard zones (Fig. 5c). When supporting structures were built to reduce the avalanche-prone area, the proportion of buildings in the hazard zones to buildings outside the hazard zones rose further to 70% in 2000 (Fig. 5c).
3.4.2 Risk scenario A
According to the high number of buildings in the run-out zone of the Grosstal West avalanche, total building values
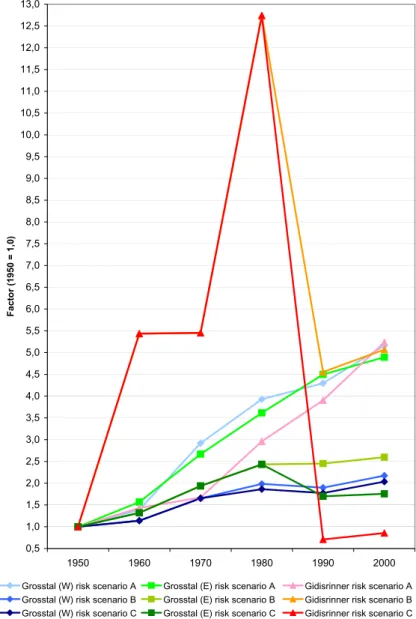
0,5 1,0 1,5 2,0 2,5 3,0 3,5 4,0 4,5 5,0 5,5 6,0 6,5 7,0 7,5 8,0 8,5 9,0 9,5 10,0 10,5 11,0 11,5 12,0 12,5 13,0 1950 1960 1970 1980 1990 2000 Factor (1950 = 1,0)
Grosstal (W) risk scenario A Grosstal (E) risk scenario A Gidisrinner risk scenario A Grosstal (W) risk scenario B Grosstal (E) risk scenario B Gidisrinner risk scenario B Grosstal (W) risk scenario C Grosstal (E) risk scenario C Gidisrinner risk scenario C
Fig. 8. Proportional development of risk scenarios A, B and C for the Grosstal West, the Grosstal East and the Gidisrinner avalanche, with
the values of 1950 serving as basis. Risk scenario A describes the development of the total building values at risk in the maximum extent of the avalanche. Risk scenario B shows the cumulative possible loss regarding the maximum extent of the avalanche if no mitigation measures had been constructed. The vulnerability of the elements at risk is taken into account. Risk scenario C illustrates the time evolution of the possible loss, taking into account changes of all three risk-influencing factors, (1) the shifts in the values at risk, (2) the varying vulnerability of buildings and (3) the construction of supporting structures.
added up to already EUR 6.7 million in the endangered area in 1950 (Fig. 7a). The cumulative values increased to EUR 34.7 million in 2000 (Fig. 7a) (equals a factor of 5.2, Fig. 8) – by far the highest value for risk scenario A of all three avalanche tracks (Fig. 7). However, the corresponding average values per building in 2000 (EUR 826 000) were be-low the mean values of the buildings of all three avalanche tracks (EUR 992 000 in 2000, see Table 5).
The total building value at risk of the Grosstal East avalanche increased continuously between 1950 and 2000 from EUR 4.5 million to EUR 21.8 million (equals a
fac-tor of 4.9, Figs. 7b and 8), although there was no increase of the number of buildings between 1970 and 1990 for this scenario (Fig. 6). This trend was caused by the change of building functions as well as by the extension of buildings, as described in Sect. 3.2, and resulted in the highest average value per building in 2000 in the run out zone of the Grosstal East avalanche (EUR 1 556 000; Table 5).
The total building values in the Gidisrinner avalanche path showed a slighter increase until 1970 than those in the Grosstal avalanche paths (Fig. 8). However, until 2000, the values rose to EUR 16.1 million by the highest
648 M. Keiler et al.: Avalanche risk assessment – a multi-temporal approach factor of 5.3 compared to 1950 (EUR 3.1 million, Fig. 7c).
The total building values endangered by the Gidisrinner avalanche in the maximum scenario were very low compared to the Grosstal East avalanche (EUR 4.5 million in 1950, EUR 21.8 million in 2000, see Fig. 7b), where at almost any time only half as many buildings were located as in the run-out zone of the Gidisrinner avalanche. This consider-able difference was caused by the different functions of the buildings; mainly large hotels and guest houses were endan-gered by the Grosstal East avalanche while mainly agricul-tural and residential buildings are threatened by the Gidisrin-ner avalanche. This was reflected in the lowest average value per building in 2000 (EUR 596 000; Table 5).
3.4.3 Risk scenario B
The possible loss in the Grosstal West avalanche run-out zone according to risk scenario B, which considers the vul-nerability of the buildings in the maximum scenario, showed a constant increase until the 1980s and a slight decrease after the introduction of the hazard zone map with special regula-tions for the building construction (Fig. 7a). Due to construc-tion of new buildings, especially outside the official hazard zones, the possible losses according to risk scenario B in-creased again (Fig. 7a). In 2000, risk due to the Grosstal West avalanche had more than doubled compared to the val-ues in 1950 (Fig. 8).
Risk scenario B for the Grosstal East avalanche showed a risk increase by a factor of 2.6 since the mid-20th century (Fig. 8). The introduction of the construction requirements in the hazard zones in 1986 has not resulted in a decline of the possible loss for this risk scenario as in the case of the Grosstal West avalanche (see Figs. 7a and b). However, the significant increase was slowed down. The effect of a reduc-tion of the vulnerability due to the construcreduc-tion requirements could be explained by a) the low proportion of buildings in-side the hazard zones to buildings outin-side the hazard zones and b) the above average increase of the values at risk in the years between 1970 and 1990 for the Grosstal East avalanche track.
The time evolution of risk in scenario B for the Gidisrin-ner avalanche is characterised by abrupt changes (Fig. 8). An increase by a factor of 5.4 between 1950 and 1960 was fol-lowed by a stable phase and a second increase with a dou-bling of the possible loss between 1970 and 1980 (equals a factor of 12.7 compared to 1950, Figs. 7c and 8). Due to the introduction of the construction requirements with the haz-ard zone map in 1986, the possible loss of risk scenario B in 1980 was reduced to nearly a third until 1990 (Fig. 7c). Therefore, the possible loss in risk scenario B for the Gidis-rinner avalanche rose by a factor of 5.1 between 1950 and 2000 (Fig. 8).
3.4.4 Risk scenario C
Risk scenario C considering all three risk-influencing factors of the Grosstal West avalanche showed a similar develop-ment as scenario B, but the increase between 1970 and 1980 was slightly lower due to the construction of the support-ing structures (Figs. 7a and 8). For risk scenario C, 3.3% of the total building values (risk scenario A) were calculated as possible loss in the year 2000 (Fig. 7a) because of the high number of buildings exposed to low pressures in this run-out zone. Taking into account the changes resulting from the construction of mitigation measures, the increasing values at risk and the varying vulnerabilities, the risk (scenario C) of the Grosstal West avalanche has doubled between 1950 and 2000 (Fig. 8).
The possible risk of loss for scenario C for the Grosstal East avalanche more than doubled already between 1950 and 1980 (Fig. 8). After the construction of a catching dam and the introduction of the hazard zone map in 1986, the values at risk in scenario C were reduced to 70% of the risk in 1980 (Fig. 7b). In general, this catching dam leads to a decline of risk, as illustrated by the proportion of the values resulting from risk scenario C to the total building values (risk sce-nario A). This proportion decreased from 5.5% in 1950 to 1.9% in 2000 (Fig. 7b). The decline of risk in scenario C was followed by a slight increase until 2000 and resulted in an increase by a factor of 1.8 compared to the risk in 1950 (Fig. 8).
Risk scenario C regarding all three risk-influencing factors of the Gidisrinner avalanche showed a similar trend as sce-nario B until 1980 (Fig. 8). At this time, the possible loss in risk scenario C was calculated to exceed a quarter of the total building values (risk scenario A) (Fig. 7c). Due to the construction of supporting structures and the decrease of the vulnerability, this proportion was reduced to 1% until 2000 (Fig. 7c). Thus, the risk (scenario C) in 2000 was below the values of 1950 (by a factor of 0.9, Fig. 8), although, an in-crease of the total building values was detectable.
4 Conclusions
In comparison between 1950 and 2000, the development of risk of the three studied avalanche tracks differs consider-ably. The risk (scenario C) related to the Grosstal West and East avalanche doubled and nearly doubled, respectively. In contrast, the risk associated with the Gidisrinner avalanche in 2000 was just beneath the risk of the year 1950. In the following section, those different developments are analysed with respect to the factors influencing the risk.
The changes of the process behaviour resulting from the implementation of the supporting structures in the release area entailed different effects on the extent of the run-out zone as well as on the occurring avalanche pressures. Both Grosstal avalanches show only a marginal change of the
extent of the run-out zone, and the associated pressures de-creased only slightly. Unlike the minor decline of the risk related to the Grosstal West avalanche (= risk scenario C), the risk of the Grosstal East avalanche has decreased signifi-cantly after the construction of supporting structures. This difference is caused by the location of the exposed build-ings. The area between the run-out zones of the Grosstal West avalanche regarding both the maximum and minimum scenario is nearly undeveloped. Therefore, the number of ex-posed objects was only reduced by a few buildings (Fig. 5). In the year 2000, more buildings are located in the fringe area of the Grosstal East run-out zone regarding the maximum scenario, which are not anymore exposed to the avalanche after the construction of the catching dam. The construction of supporting structures in the release area of the Gidisrinner avalanche effected a considerable reduction of the run-out zone as well as of the occurring pressures on the exposed buildings (Table 4). Thus, the risk decreased significantly af-ter 1989 (Figs. 7c and 8). Considering the development of the process behaviour, it has to be concluded that not only smaller run-out zones and declining impact pressures cause a risk reduction. Furthermore, this reduction is highly in-fluenced by the location, the distribution and the value of the exposed buildings in the area between the maximum scenario (without supporting structures) and the minimum scenario (considering supporting structures).
The development of the value at risk shows an increase of a factor of five between 1950 and 2000 for all three avalanche tracks. However, the trend during this period is slightly different between the Grosstal avalanches and the Gidisrinner avalanche (see Fig. 8). Nevertheless, a compar-ison of the total building values in the run-out zones of the three avalanches reveals remarkable differences. This dis-crepancy results from different numbers of exposed buildings and varying average values of the buildings due to changing building sizes and functions. There is no doubt that the in-crease of risk is a consequence of the rising total values of buildings, if it is assumed that changes in the avalanche activ-ity are solely based on the implementation of mitigation mea-sures. However, the trends of the total building values and the risk (regarding scenario B as well as C) are not directly corre-lated as shown especially for the Gidisrinner avalanche (see Fig. 8). An important aspect is the location of the buildings in the run-out zones. An increase of the building value in an area of high impact pressure (e.g. Gidisrinner avalanche) results in a higher risk than the same increase in the fringe area of the run-out zone with lower pressure (e.g. Grosstal avalanches).
The vulnerability of buildings to avalanche impacts de-clined for all three avalanche tracks between 1950 and 2000. Changes in the type of building construction after 1960 (from building category 2 to 3) led to a decline of the susceptibility of the buildings. This was shown in the different develop-ment of possible losses in risk scenario B and the total build-ing values (risk scenario A) of the Grosstal avalanches (see
Fig. 8). In areas with high avalanche pressure, the high sus-ceptibility of the buildings – especially in the building cat-egories 1 to 3 – results in high possible losses in risk sce-nario B (e.g. Gidisrinner avalanche). The construction re-quirements introduced in 1986 have only become operative in the legally defined hazard zones. Therefore, in the simu-lated run-out zones with a low proportion of buildings inside the hazard zones to buildings outside of the hazard zones, this regulation for decreasing the vulnerability of buildings shows no or only a slight decline of the possible loss in risk scenario B (see Grosstal avalanches in Figs. 7 and 8). In contrast, the regulation is considerably more effective in areas where high impact pressures occur and many buildings are already lo-cated in the hazard zones (e.g. Gidisrinner avalanche). Fol-lowing the concept of Wilhelm (1997), the susceptibility of each building category cannot be reduced below a damage level with a possible loss of 3% of the total building value if an avalanche pressure above 2 kPa occurs (see Fig. 2 and Sect. 2.3). This damage level is already reached regarding the proportion of the possible loss of risk scenario B to the total building values of the Grosstal East avalanche. The val-ues of the Grosstal West avalanche are just above this level. Therefore, the risk can only be reduced with the help of con-structive mitigation measures that decrease the impact pres-sures.
In this study, the temporal change of the risk related to three avalanche tracks in the community of Galt¨ur has been investigated for the period from 1950 to 2000. The influences of each factor (process, value at risk, vulnerability) to the re-sulting risk was analysed and the connections between these factors were discussed. No general trend could be deter-mined for the calculated risk. Similar results were obtained for both Grosstal avalanches comparing the years 1950 and 2000, but they are caused by different aspects and influences. These aspects were the spatial distribution of the exposed ob-jects, the values at risk, the occurring impact pressures and the related vulnerability of the objects, the effectiveness of the mitigation measures regarding both the extent of the run-out zone and the reduction of the pressure as well as legal regulations. Small changes of one of these aspects can cause considerable differences in the resulting risk. These findings are consistent with recent studies in the Swiss Alps (Fuchs et al., 2004). Therefore, the assumption of different authors (Ammann, 2001; White et al., 2001; Barbolini et al., 2002) that high damage in the 1990s is mainly due to increasing values at risk cannot be confirmed by abstracting the results of this study to a general statement. These losses are a result of increasing complexity caused by changes of the geosystem and the social system and the connectivity between these sys-tems.
The complexity of risk causes a high sensitivity of the calculated results to the risk-influencing factors. To deter-mine these factors, a number of subsequent steps has to be conducted, each of them including several inherent uncer-tainties. A sensitivity and uncertainty analysis for this study
650 M. Keiler et al.: Avalanche risk assessment – a multi-temporal approach is the subject of ongoing research. Regarding the
probabil-ity of occurrence of the process, uncertainties resulting from avalanche simulations have to be taken into consideration. In addition to some basic limitations that occur when using sim-ulation models, the major uncertainties result from the use of the input parameters, such as release depth and release extent. The values at risk are very sensitive to the build-ing volume, and thus to the construction plans. Regardbuild-ing the changing functions of the buildings, detailed research in archives has to be carried out to obtain the best suitable range of reinstatement costs (Keiler et al., 2004). Furthermore, fu-ture research has to be conducted regarding the vulnerability of buildings to avalanche impact pressure, since the method outlined in Wilhelm (1997) could only serve as a rough esti-mation.
Nevertheless, the multi-temporal approach applied in this study yields a better understanding of today’s risk in alpine settlements by identifying the main changes and the under-lying processes. Furthermore, this knowledge can be imple-mented in strategies for a sustainable development in Alpine settlements, which is promoted in the Agenda 21 (United Na-tions, 1992).
Acknowledgements. The authors would like to express their sincere
thanks to the colleagues at the University of Innsbruck, Department of Geography, for valuable discussion and support; as well as the public authorities in the municipality of Galt¨ur for providing data. Furthermore, the authors kindly acknowledge D. Issler and another referee for their insightful comments on an earlier version of the paper. Part of the research for this study was carried out by means of grants donated by Munich Re Reinsurance Company.
Edited by: T. Glade
Reviewed by: D. Issler and two other referees
References
Ammann, W.: Integrales Risikomanagement – der gemeinsame Weg in die Zukunft, B¨undnerwald, 5, 14–17, 2001.
Bader, S. and Kunz, P. (Eds.): Klimarisiken – Herausforderungen f¨ur die Schweiz, vdf Hochschulverlag, Z¨urich, 1998.
Barbolini, M., Natale, L., and Savi, F.: Effects on release condi-tions uncertainty on avalanche hazard mapping, Nat. Hazards, 25, 225–244, 2002.
Barbolini, M., Cappabianca, F., and Sailer, R.: Empirical estimate of vulnerability relations for use in snow avalanche risk assess-ment, edited by: Brebbia, C., Risk Analysis IV, WIT Press, Southampton, 533–542, 2004.
B¨atzing, W.: Der sozio-¨okonomische Strukturwandel des Alpen-raums im 20. Jahrhundert, Bern, Geographica Bernensia, P26, 1993.
Bell, R. and Glade, T.: Quantitative risk analysis for landslides – examples from B´ıldudalur, NW Iceland, Nat. Hazards Earth Syst. Sci., 4, 117–131, 2004,
http://www.nat-hazards-earth-syst-sci.net/4/117/2004/.
Bergthaler, J.: Grunds¨atze zur Erarbeitung von Gefahrenzo-nenpl¨anen in Wildb¨achen der N¨ordlichen Kalkalpen und der Grauwackenzone, ¨Osterr. Wasserwirtschaft, 27, 160–168, 1975. Br¨undl, M. and Hegg, C.: Die Naturereignisse der letzten Jahre im
¨
Uberblick, edited by: WSL (Swiss Federal Institute for Forest, Snow and Landscape Research), Forum f¨ur Wissen 2001, Bir-mensdorf, http://www.wsl.ch/slf/pdf/forum2001-bruendl-hegg. pdf, access 21 July 2005, 2001.
BWG (Swiss Federal Office for Water and Geology): Pri-orisierungsverfahren f¨ur Hochwasserschutzprojekte – Ab-sch¨atzung des Schadenpotentials, http://www.bwg.admin.ch/ service/download/d/index.htm\#schapo, access 25 May 2005, 2005.
Cutter, S.: Vulnerability to environmental hazards, Progr. Human Geogr., 20, 529–539, 1996.
Frutiger, H.: Rechtliche Aspekte der Nutzungsbeschr¨ankung des Grundeigentums wegen Lawinengef¨ahrdung, Proc. Inter-nationales Sympos. Interpraevent – Bad Ischl, Austria, 8–12 September 1980, 1, 33–48, 1980.
Fuchs, S. and Br¨undl, M.: Damage potential and losses resulting from snow avalanches in settlements in the Canton of Grisons, Switzerland, Nat. Hazards, 34, 53–69, 2005.
Fuchs, S. and Keiler, M.: Natural hazard risk depending on the vari-ability of damage potential, edited by: Brebbia, C. and Popov, V., Risk Analysis V, WIT-Press, Southampton, 13–22, 2006. Fuchs, S., Br¨undl, M., and St¨otter, J.: Development of avalanche
risk between 1950 and 2000 in the municipality of Davos, Switzerland, Nat. Hazards Earth Syst. Sci., 4, 263–275, 2004, http://www.nat-hazards-earth-syst-sci.net/4/263/2004/.
Fuchs, S., Keiler, M., Zischg, A., and Br¨undl, M.: The long-term development of avalanche risk in settlements considering the temporal variability of damage potential. Nat. Hazards Earth Syst. Sci., 5, 893–901, 2005,
http://www.nat-hazards-earth-syst-sci.net/5/893/2005/.
G¨achter, M. and Bart, R.: Risikoanalyse und Kostenwirksamkeit bei der Massnahmenplanung – Beispiel Diesbach, Schweiz. Z. f. Forstwesen, 153, 268–273, 2002.
Gemeinde Galt¨ur: Statistik Galt¨ur, http://www.galtuer.gv.at, access 27 June 2006, 2006.
Glade, T.: Vulnerability assessment in landslide risk analysis, Die Erde, 134, 123–146, 2003.
Heumader, J.: Die Katastrophenlawinen von Galt¨ur und Valzur am 23. und 24.2.1999 im Paznauntal/Tirol, Proc. Internationales Sympos. Interpraevent – Villach, Austria, 26–30 June 2000, 2, 397–410, 2000.
Hollenstein, K., Bieri, O., and St¨uckelberger, J.: Mod-ellierung der Vulnerability von Schadenobjekten gegen¨uber Naturgefahrenprozessen, Schlussbericht, ETH Z¨urich, Dept. Forstliches Ingenieurwesen, http://e-collection.ethbib.ethz.ch/ show?type=bericht&nr=173, access 8 April 2005, 2002. Hufschmidt, G., Crozier, M., and Glade, T.: Evolution of natural
risk: research framework and perspectives, Nat. Hazards Earth Syst. Sci., 5, 375–387, 2005,
http://www.nat-hazards-earth-syst-sci.net/5/375/2005/.
IUGS (International Union of Geological Sciences): Quantitative risk assessment for slopes and landslides – the state of the art, edited by Cruden, D. and Fell, R.: Landslide Risk Assessment., Proc. of the International Workshop on Landslide Risk Assess-ment – Honolulu, Hawaii, USA, 19–21 February 1997, Balkema,
Rotterdam, 3–12, 1997.
J´onasson, K., Sigurdsson, S., and Arnalds, T.: Estimation of avalanche risk, Icelandic Meteorological Office, Reykjav´ık, Ice-land, V´I-R99001- ´UR01, 1999.
Keiler, M.: Development of the damage potential resulting from avalanche risk in the period 1950–2000, case study Galt¨ur, Nat. Hazards Earth Syst. Sci., 4, 249–256, 2004,
http://www.nat-hazards-earth-syst-sci.net/4/249/2004/.
Keiler, M., Meißl, G., and St¨otter, J.: Determination of the damage potential: a contribution to the determination of avalanche risk, edited by: Brebbia, C., Risk Analysis IV, WIT Press, Southamp-ton, 187–196, 2004.
Keiler, M., Zischg, A., Fuchs, S., Hama, M., and St¨otter, J.: Avalanche related damage potential - changes of persons and mo-bile values since the mid-twentieth century, case study Galt¨ur, Nat. Hazards Earth Syst. Sci., 5, 49–58, 2005,
http://www.nat-hazards-earth-syst-sci.net/5/49/2005/.
Keylock, C. and Barbolini, M.: Snow avalanche impact pressure – vulnerability relations for use in risk assessment, Can. Geotech. J., 38, 227–238, 2001.
Keylock, C., McClung, D., and Magn´usson, M.: Avalanche risk mapping by simulation, J. Glaciol. 45, 303–314, 1999.
Kleist, L., Thieken, A., K¨ohler, P., M¨uller, M., Seifert, I., and Werner, U.: Estimation of building values as a basis for a com-parative risk assessment, edited by: Mahlzahn, D. and Plapp, T., Disasters and society, Logos Verlag, Berlin, 115–122, 2004. Laternser, M.: Snow and avalanche climatology in Switzerland,
PhD-thesis, Diss. ETH No. 14493, ETH Z¨urich, 2002.
Sailer, R., Rammer, L., and Sampl, P.: Recalculation of an artifi-cially released avalanche with SAMOS and validation with mea-surements from a pulsed Doppler radar, Nat. Hazards Earth Syst. Sci., 2, 211–216, 2002,
http://www.nat-hazards-earth-syst-sci.net/2/211/2002/.
Sampl, P. and Zwinger, T.: Avalanche simulation with SAMOS, Ann. Glaciol., 38, 393–396, 2004.
Schneebeli, M., Laternser, M., F¨ohn, P., and Ammann, W. : Wech-selwirkungen zwischen Klima, Lawinen und technischen Mass-nahmen, vdf Hochschulverlag, Z¨urich, 1998.
SLF (Ed.): Der Lawinenwinter 1999, SLF (Eidgen¨ossisches Institut f¨ur Schnee- und Lawinenforschung), Davos, 2000.
United Nations: Agenda 21, http://www.un.org/esa/sustdev/ documents/agenda21/index.htm, access 13 July 2005, 1992. Voellmy, A.: Ueber die Zerst¨orungskraft von Lawinen, Schweiz,
Bauzeitung, 73, 159–165, 1955.
Volk, G. and Kleemayr, K.: Lawinensimulationsmodell ELBA, Wildbach- und Lawinenverbau, 138, 23–32, 1999.
Weiss, G.: The political practice of natural hazards control in Aus-tria and the question of climate change, edited by: Steininger, M. and Weck-Hannemann, H., Global environmental change in alpine regions, Edward Elgar, Cheltenham, 131–149, 2002. White, G., Burton, R., and Kates, I.: Knowing better and loosing
even more: the use of knowledge in hazards management, Envi-ron. Hazards 3, 81–92, 2001.
Wilhelm, C.: Wirtschaftlichkeit im Lawinenschutz, Mtt. Eid-gen¨ossisches Institut f¨ur Schnee- und Lawinenforschung, 54, Davos, 1997.
Wisner, B., Blaikie, P., Cannon, T., and Davis, I. (Eds.): At risk, Routledge, London, 2003.
Zischg, A., Fuchs, S., Keiler, M., and St¨otter, J.: Temporal variabil-ity of damage potential on roads as a conceptual contribution to-wards a short-term avalanche risk simulation, Nat. Hazards Earth Syst. Sci., 5, 235–242, 2005,