HAL Id: hal-02932391
https://hal.archives-ouvertes.fr/hal-02932391
Submitted on 7 Sep 2020
HAL is a multi-disciplinary open access
archive for the deposit and dissemination of
sci-entific research documents, whether they are
pub-lished or not. The documents may come from
teaching and research institutions in France or
abroad, or from public or private research centers.
L’archive ouverte pluridisciplinaire HAL, est
destinée au dépôt et à la diffusion de documents
scientifiques de niveau recherche, publiés ou non,
émanant des établissements d’enseignement et de
recherche français ou étrangers, des laboratoires
publics ou privés.
Routine Analyses of Trace Elements in Geological
Samples using Flow Injection and Low Pressure On-Line
Liquid Chromatography Coupled to ICP-MS: A Study
of Geochemical Reference Materials BR, DR-N, UB-N,
AN-G and GH
Jean Carignan, Pascal Hild, Guy Mevelle, Jacques Morel, Delphine
Yeghicheyan
To cite this version:
Jean Carignan, Pascal Hild, Guy Mevelle, Jacques Morel, Delphine Yeghicheyan. Routine Analyses
of Trace Elements in Geological Samples using Flow Injection and Low Pressure On-Line Liquid
Chromatography Coupled to ICP-MS: A Study of Geochemical Reference Materials BR, DR-N,
UB-N, AN-G and GH. Geostandards and Geoanalytical Research, Wiley, 2001, 25 (2-3), pp.187-198.
�10.1111/j.1751-908X.2001.tb00595.x�. �hal-02932391�
Routine Analyses of Trace Elements in Geological Samples
using Flow Injection and Low Pressure On-Line Liquid
Chromatography Coupled to ICP-MS: A Study of Geochemical
Reference Materials BR, DR-N, UB-N, AN-G and GH
Geostandard Newsletters Vol. 25 — N° 2-3 p . 1 8 7 - 1 9 8
Jean Carignan, Pascal Hild, Guy Mevelle, Jacques Morel and Delphine Yeghicheyan
Service d’Analyse des Roches et des Minéraux (S ARM), CNRS-CRPG, 15 rue Notre-Dame des P auvres, BP 20, 54501 Vandoeuvre-lès-Nancy, France. e-mail: [email protected]
We describe analytical procedures for trace element determinations developed at the CNRS Service d’Analyse des Roches et des Minéraux (SARM) and report results obtained for five geochemical reference materials: basalt BR, diorite DR-N, serpentinite UB-N, anorthosite AN-G and granite GH. Results for rare earth elements, U and Th are also reported for other reference materials including dunite DTS-1, peridotite PCC-1 and basalt BIR-1. All rocks were decomposed using alkali fusion. Analyses were done by flow injection ICP-MS and by on-line low pressure liquid chromatography (LC)-ICP-MS for samples containing very low REE, U and Th concentrations. This latter method yielded limits of determination much lower than data by direct introduction and eliminated possible isobaric interference on these elements. Although results agree with most of the working values, when available, results for some elements differed slightly from the recommended concentrations. In these cases, we propose new values for Co, Y and Zn in basalt BR, Zr in diorite DR-N, Sr and U in granite GH, and Ga and Y in anorthosite AN-G. Furthermore, although the Sb concentration measured in AN-G was very close to our limit of determination, our value (0.3 ± 0.1 µg g-1) is much
lower than the reported working value of 1.4 ± 0.2 µg g-1. These new values would need to be
confirmed by a new inter-laboratory programme to further characterise these reference materials. Results obtained for REE, Th and U concentrations using the on-line low pressure LC-ICP-MS yielded good limits of determination (ng g-1 to sub-ng g-1
for rocks and ng l-1 to sub-ng l-1 for natural waters)
and accurate results. The efficiency of the matrix separation allowed accurate measurements of Eu without the need to correct the BaO isobaric
interference for samples having Ba/Eu ratios as high as 27700. For REE concentrations in PCC-1 and DTS-1, differences with values reported in the literature are interpreted as resulting from possible heterogeneity of the reference materials. Thorium and U values are proposed for these two samples, as well as for AN-G and UB-N.
Nous rapportons les procédures d’analyse pour les éléments traces développées au Service d’Analyse des Roches et des Minéraux (SARM) du CNRS et les résultats obtenus pour 5 géostandards: le basalte BR, la diorite DR-N, la serpentinite UB-N, l’anorthosite AN-G et le granite GH. Des résultats obtenus pour les Terres Rares (REE), l’uranium et le thorium sont aussi rapportés pour d’autres
matériaux de référence tels que la dunite DTS-1, la péridotite PCC-1 et le basalte BIR-1. Les roches ont été décomposées par fusion alcaline. Les analyses ont été faites par Flow Injection ICP-MS et par chromatographie liquide basse pression en ligne sur un ICP-MS pour les très faibles teneurs en REE, U et Th. Cette dernière méthode permet d’avoir une meilleure limite de détermination que celle par introduction directe et d’éliminer certaines interférences isobariques sur ces éléments. Bien que, dans la majorité des cas, nous ayons mesuré les valeurs de référence telles que rapportées dans la littérature, certaines concentrations mesurées diffèrent légèrement des valeurs recommandées. Ainsi, nous proposons de nouvelles valeurs de Co, Y et Zn pour le basalte BR, de Zr pour la diorite DR-N, de Sr et U pour le granite GH et de Ga et Y pour l’anorthosite AN-G. De plus, bien que la concentration en Sb mesurée pour AN-G soit très proche de notre limite de détermination, notre valeur (0.3 ± 0.1 µg g-1) est bien inférieure à celle
rapportée dans la littérature (1.4 ± 0.2 µg g-1). Ces
nouvelles valeurs devraient être confirmées par une nouvelle campagne de caractérisation inter laboratoire pour ces géostandards.
Les résultats obtenus pour les REE, U et Th par chromatographie liquide basse pression en ligne sur un ICP-MS sont justes et livrent des limites de détermination faibles au niveau du ng g-1 à
sub-ng g-1 pour les roches et ng l-1 à sub-ng l-1
pour les eaux naturelles. La séparation de la matrice est efficace et permet une mesure juste de Eu sans correction d’interférence générée par l’oxyde de Ba, et ce même pour des échantillons possédant des rapports Ba/Eu très élevés, de l’ordre de 27700. Les concentrations en REE mesurées pour les échantillons PCC-1 et DTS-1 peuvent être significativement différentes de celle rapportées dans la littérature, probablement à cause d’une
hétérogénéité de ces échantillons. Des valeurs de concentrations en U et Th sont proposées pour ces deux échantillons ainsi que pour AN-G et UB-N.
Keywords: geostandards, trace elements, flow injection, liquid chromatography, ICP-MS.
The Service d’Analyse des Roches et des Minéraux (SARM) is the French national analytical facility for geoanalyses. The SARM is part of CNRS and is located at the Centre de Recherches Pétrographiques et Géochimiques (CRPG). More than 6500 samples per year are analysed for major and trace element concentrations and the spectrochemistry laboratory of the Service has developed automatic procedures for sample preparation-dissolution, analysis, data reduction and storage. Some of these procedures (preparation- dissolution) have been already published in Govindaraju and Mevelle (1987). For routine trace element analysis, we use the flow injection (FI) technique coupled to ICP-MS. The advantages of FI are well documented in the literature (e.g. Denoyer et al. 1993, Hollenbach et al. 1994, Debrah and Alary 1999) and depend mainly on the fact that this technique improves the sample throughput in the ICP-MS, in terms of analysis time and washout, and facilitates the analysis of very small amounts of sample (e.g. 100-200 µl). This latter capability allows us to introduce fairly concentrated solutions (ca. 12 g l-1) into the ICP-MS without severe drift of the signal intensity with time.
For samples having very low contents of U, Th and REE, we have developed an automatic, on-line, low pressure, liquid chromatography technique as the sample introduction system on our ICP-MS. Matrix extraction prior to the analysis of trace and ultra-trace elements in geological materials is useful for several reasons. First, it removes possible isobaric interference; second, it eliminates signal suppression in the plasma and third, it makes possible the preconcentration of elements. On-line separation and preconcentration has already been used successfully with different instrumental techniques, including AAS (e.g. Schuster and Schwarzer 1998, Yerba-Biurrun et al. 2000), ICP-AES (e.g. Yan-zhong and Ning-wan 1995) and ICP-MS (e.g. Hollenbach et al. 1994). This report presents the methods that are used at the SARM, and the results obtained for different geostandards.
Geostandards
In the early 1960’s, Dr. Govindaraju and his team realised the usefulness of characterized geological materials used as controls for the geochemical analyses of rock samples. A series of geological samples was then prepared (crushed and homogenised) and sent to many laboratories for characterisation of their major, minor and trace element contents. To date, more than twenty five of these geological reference materials, called by Govindaraju “geostandards”, were characterized by the SARM and its collaborators (CRPG, ANRT, IWG-GIT). The SARM and many other analytical laboratories around the world now routinely use these reference materials.
Preparation, analysis and treatment of data
The procedures developed at the SARM for the analysis of rock samples are as follows. Rocks samples are powdered (300 mg) and fused in Pt crucibles along with 900 mg of ultra-pure LiBO2 at 980 ¢XC in an automatic tunnel oven. Samples were
passed through the oven on a rail over a period of about 60 minutes at a constant speed. This method ensured that all the samples encountered the same thermal gradient. A blank (900 mg LiBO2) and five international reference materials of
different compositions were prepared with all the batches of twenty five to thirty samples. These reference materials were: (1) the alkali basalt BR, (2) the anorthosite AN-G, (3) the serpentinite UB-N, (4) the d i o r i t e DR-N and ( 5 ) the granite GH (see Govindaraju (1995) for a review). When analysis of carbonates was performed, the in-house reference sample CAL-S (limestone) was used as a control. After cooling to room temperature, the fusion glass was dissolved in a HNO3 (1 mol l-1
fused. Water used for the dilution of acids was distilled and de-ionised. Hydrogen peroxide helped to stabilise in solution elements such as titanium and other HFSE. Glycerol was used to “wet” the sample introduction system and the nebulizer of the ICP-MS, hence reducing the amount of sample precipitated in the system and so limiting instrumental drift.
Trace elements were measured by FI ICP-mass spectrometry using a one point “linear through zero” calibration. The calibration solution was a multi-element doped solution of BR (Table 3). The ICP-MS used was a Sciex Perkin Elmer ELAN 5000a. Instrumental parameters are reported in Table 1.
A 200 µl calibrated loop mounted on an electro-valve (Cheminert®) was filled with the sample solution while distilled water was introduced into the ICP-MS. A control unit (CETAC® - Microneb 2000), originally designed for a Direct Introduction Nebuliser (DIN), controlled the electrovalve.
The liquid was aspirated with a peristaltic pump operated at a speed of 17 r otations per minute, corresponding to a flow rate of ca. 1 ml per minute. The electro-valve was located at 15-20 cm from the nebuliser (cross-flow, Perkin Elmer) to minimise dead volumes as much as possible. When the loop was filled, the electro-valve switched position so that the distilled water (carrier) passed through the loop and pushed the sample into the mass spectrometer. The loop was cleaned with 1mol l-1
HNO3 between each sample.
The sample yielded a transient signal at the detector, which was measured over a period of 24 s by making ten replicate measurements of 3 x 10 -2 s on each mass (fifty seven isotopes). The average counts per second was calculated for each
sample. Corrections for possible isobaric interferences on measured masses were monitored and corrected. All Pb isotopes were measured to take into account possible significant variations of isotopic composition between our calibration solution and samples.
Limits of determination were calculated from statistics on the blank samples prepared every day with the different sample batches. The reported limits represent six times the standard deviation of the mean plus the mean on measured concentrations for the whole procedural blank samples (Table 2). These limits were calculated every 2 to 3 months using forty to fifty different blank preparations. The overall uncertainties onconcentration measurements were calculated from results obtained on eight international geochemical reference materials (twenty five test portions for each sample) covering a large range of concentrations for most of the elements. Uncertainties represent a different concentration range for each element (Table 2) and correspond to the relative standard deviation of the mean.
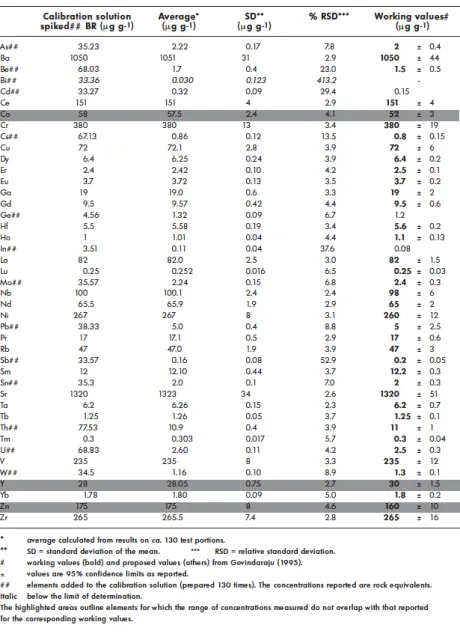
The reference material BR (alkali basalt) was used as the calibration solution into which additional aliquots of fourteen elements were added in order to increase their concentration and to give better control at the high calibration points (Table 3).
The analytical blank subtracted from the sample signal was a solution of LiBO2 (900 mg diluted in 100 ml of the HNO3 -
H2O2 - glycerol mixture). The spiked BR and analytical blank solutions were analysed every six samples and a linear
correction for detected drift was applied on all the masses measured. No internal standard was added to the sample solution. Although an internal standard correction using In or Re is widely used, we preferred to correct the instrumental drift on each measured isotope because of possible differences in behaviour of elements between two calibration points.
Figure 1 shows the drift observed between two calibration points for different elements and the effect of the linear correction. Although some elements may have been overcorrected, overall, the linear correction reduced considerably the effect of the observed drift. The accuracy of the linear correction was controlled by the analysis of the sample BR before each new calibration.
A comparison between corrected and uncorrected results on basalt BR is shown in Figure 2 for Ba concentrations. Corrected results are more accurate and reproducible. Our cleaning procedure between samples yielded an insignificant memory effect from one sample to another that varied between 5‰ and < 1‰, according to the element considered.
Trace element concentrations obtained for five different international geochemical reference materials are reported in Tables 3 to 7 and compared to their recommended or proposed values, when available. Most data are in good agreement with values reported by Govindaraju (1995). Table 3 reports the results we obtained for the basalt BR, calibrated against another preparation of BR, which had been doped with fourteen elements. For the other elements, this reference material was then analysed against itself and the results reflect mainly the homogeneity of the material (n = 130, over a 10 months period). The standard deviation of the mean for most elements is comparable to the uncertainty in the working values of concentration reported for the corresponding elements.
The concentrations in BR used for calibration were, for some elements, slightly different from the suggested working values (being preferred values), but are within the related uncertainties except for Co, Y and Zn. These three elements were measured in BR by ICP-MS using the standard additions technique. The results obtained differed significantly from the respective working values. Furthermore, AAS analyses of Co and Zn in BR yielded concentrations that also differed from the working values, though similar to those obtained by ICP-MS. Except for Y in AN-G (Table 6), the Co, Y and Zn
concentrations used for BR (Table 3) yielded accurate concentrations for the four other geochemical reference materials (Tables 4 to 7). For elements that have been added as spikes to the BR calibration solution, the concentrations found for BR are within error identical to the working values and their uncertainties. The Pb concentration in BR reported in this work was found to be much more precise than that previously reported by Govindaraju (1995), with a concentration of 5.0 ± 0.4 µg g-1
compared to 5 ± 2.5 µg g-1. In addition, the Cd concentration measured here in BR (0.32 ± 0.09 µg g-1) is higher than the one
reported in the literature (0.15 µg g-1, Govindaraju 1995). The Zr concentration measured in the diorite DR-N (Table 4) is
higher (142 ± 7 µg g-1) than the reported working value (125 ± 9 µg g-1, Govindaraju 1995). As the Zr concentrations
measured in the other three geochemical reference materials are, within error, identical to the respective working values, we assume that the Zr concentration in BR used for calibration is correct, and that the diorite DR-N has effectively 142 ± 7 µg g-1
Zr.
Furthermore, ICP-AES analyses of the same BR sample yielded an average Zr concentration of 137 ± 5 µg g-1, which is
identical within error to the value measured by ICP-MS. The measured Cr concentration in UB-N (2516 ± 144 µg g-1) is
higher than the reported working value (2300 ± 100 µg g-1, Govindaraju 1995). We suspect Cr concentration in UB-N to be
more heterogeneous than expected. Indeed, the average Cr concentrations measured in UB-N for 1997 and 1999 were 2450 ± 200 µg g-1 and 2410 ± 100 µg g-1 respectively. The Sn concentration measured in AN-G (0.3 ± 0.1 µg g-1) was much lower
than the reported working value (1.4 ± 0.2 µg g-1, Govindaraju 1995). In fact, in a previous report on AN-G (Govindaraju and
Roelandts 1993), Sn concentrations measured in different laboratories with different techniques varied between 0.26 µg g-1
The lowest Sn concentration reported, which was similar to our value, was also measured by mass spectrometry. As we have never measured heterogeneity in Sn as large as the range of values reported by Govindaraju and Roelandts (1993), we exclude heterogeneity as being a problem with this sample and suggest that the most probable Sn concentration for AN-G is 0.3 ± 0.1 µg g-1.
Finally, the Sr concentrations measured in the granite GH (Table 7) are much more consistent (8.7 ± 0.8 µg g-1) than those
reported by Govindaraju and Roelandts (1988), for which different laboratories reported Sr concentrations varying from 1 to 22 µg g-1 (n = 60).
On-line liquid chromatography
We have developed an automatic on-line, low pressure liquid chromatography sample introduction system on our Sciex Perkin Elmer ELAN 6000 ICP-MS (see Table 1 for instrument parameters), intended mostly for samples having very low Th-U and REE contents. The system was equipped with two electro-valves, a peristaltic pump and a connection to the automatic sampler. The column was filled with the appropriate resin, according to the element(s) to be analysed. In this study, EI CHROM THRU Specresin was used for both REE and Th-U analyses. The “in-house” software controlling the electro
valves and the peristaltic pump allowed up to twelve different operations (washing and conditioning of the column, sample introduction, elution, etc) per sample, with full control of the position of the valves and the speed of pumping. The column was washed between samples with an efficiency of better than 99.5% for all the elements analysed.
Samples were analysed in sequence of increasing concentration. Figure 3 is a schematic drawing of the on-line
chromatography introduction system. A column of 0.7 cm diameter and 4 cm length containing ca. 2 ml of resin was used for REE analyses, whereas a minicolumn 0.2 cm in diameter and 1.5 cm long containing ca. 0.2 ml of resin was used for Th and U analyses. In both cases, 2 ml of sample, acidified with nitric acid to a concentration of 2 mol l-1 HNO3, was introduced
into the column at a flow rate of approximately 1 ml min-1. At this nitric acid concentration, REE, Th and U partition
coefficients are maximum, so that these elements are fixed in the resin, whereas all the other elements of the matrix are eluted. Use of a larger volume of sample (> 3 ml) may result in heavy REE lost during matrix separation. After washing the column with 1.5 ml of clean 2 mol l-1 HNO3, REE or Th and U were eluted into the ICP-MS with an ammonium oxalate solution (2 g
l-1). The transient signal was measured for an equivalent acid volume of ca. 1 ml, resulting in a pre-concentration of about a
factor of two relative to the quantity of sample introduced into the column.
After elution of the elements of interest, about 2 ml of clean 2 mol l-1 HNO3 was flushed into the column, followed by another
2 ml of amonium oxalate solution to elute any REE or Th-U remaining in the resin. The resin was then conditioned with about 1 ml of clean 2 mol l-1 HNO3 before the next sample was introduced into the column. The time of analysis for the
whole procedure varied betw een 10 and 1 5 minutes, depending on the time selected for signal acquisition and for washing. As for the FI-ICP-MS measurements, an external calibration was used with a control on any eventual instrumental drift every two to five samples. Repeated analyses of a standard solution (BR/100) over a period of 1 to 2 hr gave accurate and
reproducible results within 2-5%. The total extraction yield (close to 100%) was also reproducible within 2-5%. For REE analyses, 134Ba and 137Ba were monitored to estimate any BaO interference on 153Eu and 152Sm. When significant, light REE
oxide interferences on heavy REE were corrected. Table 8 reports the limits of determination for Th, U and REEs in rock samples and for REEs in natural water samples.
Rock analysis
For rock samples, the calibration solution for REEs- Th-U was the alkali basalt reference material BR. As these elements are relatively enriched and well known in BR, the BR solution was diluted by a factor of 100 relative to its normal preparation. This dilution resulted in rock equivalent concentrations for BR in the range of those for samples to be analysed.
The accuracy of measurements for very low Th, U and REE contents is not easy to estimate because only proposed values for geological reference materials, when available, are reported in the literature. Results obtained on diluted samples (diorite DR-N), having relatively well constrained working values, suggested a good accuracy. DR-N samples diluted by a factor of 100 relative to the normal dilution yielded Th, U and REE concentrations within the range of the working values (Govindaraju 1994), with a reproducibility better than 5% for LREE and between 1% and 10% for HREE, and better than 7% and 9% for Th and U respectively (Table 9).
Different preparations were analysed for each of the reference materials, DTS-1 (dunite), PCC-1 (peridotite), BIR-1 (oceanic basalt), UB-N (serpentinite), AN-G (anorthosite), but also other samples including CAL-S (Ca carbonate) and L004
(epiphytic lichen), (Table 10). Uranium determinations were repeatable within 10% for rock concentrations of ca. 5 ng g-1
(DTS-1, PCC-1) and within 5% for rock concentrations higher than 10 ng g-1. For all samples analysed, Th determinations
were repeatable within 1.5% to 7% for sample concentrations varying between 8 ng g-1 and 100 ng g-1. The accuracy for Th
and U measurements was good. For example, measured Th and U concentrations for BIR-1 were respectively 31.5 ± 0.6 ng.g
-1 and 10.6 ± 0.5 ng g-1, in good agreement with concentrations reported in the literature (Th ~ 30 ng.g-1 and U ~ 10 ng g-1,
see Jochum et al. 1994 and Xie et al. 1994 for a review). The serpentinite UB-N showed some evidence of significant heterogeneity of its Th content. Whereas four samples yielded Th concentrations of 59.3 ± 1.5 ng g-1, one sample yielded 78
ng g-1. This was also observed using FI-ICPMS, for which one UB-N sample out of ten prepared from ten different sachets
yielded a Th concentration of 90 ng g-1, whereas the other nine averaged at 61.8 ± 4 ng g -1.
Measured REE concentrations in DTS-1 and PCC-1 were tens of ng g-1 for La, Ce and Nd and a few ng g-1 (0.8-10) for the
other REEs. At these levels of concentration, repeatability was found to be within 5 to 15%
RSD. Results obtained for DTS-1 were similar to those reported by Robinson et al. (1999) and Jain et al. (2000). However, PCC-1 yielded REE concentrations much lower than those reported by Jain et al. (2000; see Table 10).
This observation is surprising because both the DTS-1 and PCC-1 samples were prepared together and analysed against the same calibration solution in our laboratory. This would suggests that there is no calibration bias. Furthermore, two different packets of each reference material were analysed (split 29 / position 6 and split 74 / position 7 for PCC-1 and split 42 / position 7 and split 9 / position 11 for DTS-1) and were found to be homogeneous. Because concentrations are different but chondrite-normalized patterns are very similar, we suspect that different test portions of PCC-1 might be heterogeneous for their REE contents.
Water analysis
The analytical procedure for the analysis of waters was as follows. Two ml of filtered (0.45 µm) water sample was acidified to 2 mol l-1 HNO3 and then directly introduced into the column. The variation on acid and extraction blanks for the REEs are
La and Ce respectively and sub-ng l-1 level for the other REEs (Table 8).
A multi-element REE standard solution (500 ng l-1) was used for the calibration of natural water samples.
Calibration and blank solutions were processed through the column in the same way as the samples. Corrections were made for CeO and SmO interference on Gd and for CeO and NdO on Tb.
The river water certified reference material SLRS-4 (NRC-CNRC) was analysed several times for its REE contents. The measured concentrations are hundreds of ng l-1 for La, Ce and Nd and a few to tens of ng l-1 for the other REEs with a
reproducibility of better than 10% for all REEs. Our results on SLRS-4 were in good agreement with those obtained for SLRS-4 in other laboratories (see Yeghicheyan et al. 2001). In order to verify the efficiency of the column in removing all the Ba (BaO causes an interference in measuring masses for Sm and Eu), Ba was added to SLRS-4 to raise its Ba/Eu ratio from 1700 to 28000. The results obtained for the “natural” and the “Ba-spiked” SLRS-4 were identical within errors for Sm and Eu without any BaO corrections in both cases (Sm = 53.5 ± 2.6 ng l-1 and 50 ± 2 ng l-1 for Ba-spiked samples and Eu =
7.30 ± 0.58 ng l-1 and 7.44 ± 0.52 ng l-1 for Ba doped samples). This suggests the efficient removal of Ba from the column.
Conclusions
For the last thirty to forty years, the Spectrochemistry Laboratory of the SARM has developed sample preparation and analytical procedures for the analysis of geological materials, and initiated the preparation and characterisation of many new geochemical reference materials. This report has presented the latest techniques developed and results obtained by FI-MS for trace element concentrations on selected reference materials. Results obtained by AAS and standard additions ICP-MS for Zn, Co and Y in basalt BR are slightly different from the proposed values reported by Govindaraju (1995). Our values for these elements are used for calibration. For the other reference materials studied here (diorite DR-N, serpentinite UB-N, anorthosite AN-G and granite GH), although our data confirm most of the working values reported by Govindaraju (1995), we propose revised values for some elements. However, these new values would need to be validated officially by an inter-laboratory analysis programme in which laboratories contribute results using different analytical techniques.
For samples having very low Th, U and REE contents, the on-line matrix separation technique is effective and rapid (15 minutes for REE and 10 minutes for Th-U analyses) and may be applied to routine analyses of rocks and natural waters.
Acknowledgements
We would like to express our gratitude to Christine Blanchard, Marie-Thérèse Noël and Christiane Raigué, who prepared all the rock samples that were analysed for this study. We also thank the personnel of the Chemistry Laboratory of the SARM, Suzanne Boulmier, Danielle Dole, Jitka Lhomme and Luc Marin for complementary analyses of Cr, Co and Zn, and many other elements for comparison of data.
References
Debrah E. and Alary J.-F. (1999) Improved sample throughput using flow injection rapid microsampling for ICP-MS. Atomic Spectroscopy, 20, 1-5.
14, 55-59.
Govindaraju K. (1994) Compilation of working values and sample description for 383 geostandards. Geostandards Newsletter, 18 (Special Issue), 158pp.
Govindaraju K. (1995) 1995 working values with confidence limits for twenty-six CRPG, ANRT and IWG-GIT geostandards. Geostandards Newsletter, 19 (Special Issue), 32pp.
Govindaraju K. and Mevelle G. (1987) Fully automated dissolution and separation methods for inductively coupled plasma-atomic emission spectrometry rock analysis. Application to the determination of rare earth elements. Journal of Analytical Atomic Spectrometry, 2, 615-621.
Govindaraju K. and Roelandts I. (1988) Compilation r eport (1966-1987) on tr ace elements in five CRPG geochemical reference samples: Basalt BR; Granites, GA and GH; Micas, biotite Mica-Fe and phlogopite Mica-Mg. Geostandards Newsletter, 12, 119-201.
Govindaraju K. and Roelandts I. (1993) Second report (1993) on the first thr ee GIT-IWG rock reference samples: Anorthosite from Greenland, AN-G; Basalte d’Essey-la-Côte, BE-N; Granite de Beauvoir, MA-N. Geostandards Newsletter, 17, 227-294.
Hollenbach M., Grohs J., Mamich S., Kroft M. and Denoyer E.R. (1994) Determination of technicium-99, thorium-230 and uranium-234 in soils by inductively coupled plasma mass spectrometry using flow injection preconcentration. Journal of Analytical Atomic Spectrometry, 9, 927-933.
Jain J.C., Field M.P., Neal C.R., Ely J.C. and Sherrell R.M. (2000) Determination of REE in geological reference materials DTS-1 (dunite) and PCC-1 (peridotite) by ultrasonic and microconcentric desolvating nebulisation ICP-MS. Geostandards Newsletter: The Journal of Geostandards and Geoanalysis, 24, 65-72.
Jochum K., Rehkämper M. and Seufert H.M. (1994) Trace elements analysis of Basalt BIR-1 by ID-SSMS, HPLC and LIMS. Geostandards Newsletter, 18, 43-52.
Robinson P., Townsend A.T., Yu Z. and Muenker C. (1999) Determination of scandium, yttrium and rare earth elements in rocks by high resolution inductively coupled plasma-mass spectrometry. Geostandards Newsletter: The Journal of Geostandards and Geoanalysis, 23, 31-46.
Schuster M. and Schwarzer M. (1998) A new on-line column separation and preconcentration system for the selective determination of trace and ultratrace levels of palladium. Atomic Spectroscopy, 19, 121-128.
Xie Q., Jain J., Sun M., Kerrich R. and Fan J. (1994) ICP-MS analysis of basalt BIR-1 for trace elements. Geostandards Newsletter, 18, 53-63.
Yan-Zhong L. and Ning-Wan Y. (1995) On-line separation and preconcentration FIA-ICP-AES system for simultaneous determination of REEs and yttrium in geological samples. Atomic Spectroscopy, 16, 243-247.
Yebra-Biurrun M.C., Enriquez-Dominguez M.F., Garcia-Garrido A. and Moreno-Cid A. (2000) Trace level determination of lead by flame AAS using on-line separation and preconcentration. Atomic Spectroscopy, 21, 225-228.
Yeghicheyan D., Carignan J., Valladon M., Bouhnik le Coz M., Le Cornec F., Castrec-Rouelle M., Robert M., Aquilina L., Aubry C., Dia A., Deberdt S., Dupré B., Freydier R., Gruau G., Hénin O., de Kersabiec A.-M., Petitjean P. and Serrat E. (2001) A compilation of silicon and thirty one trace elements measured in the natural river water reference material SLRS-4 (NRC-CNRC). Geostandards Newsletter: The Journal of Geostandards and Geoanalysis, 25, 465-474.