HAL Id: hal-00298373
https://hal.archives-ouvertes.fr/hal-00298373
Submitted on 16 May 2006HAL is a multi-disciplinary open access
archive for the deposit and dissemination of sci-entific research documents, whether they are pub-lished or not. The documents may come from teaching and research institutions in France or abroad, or from public or private research centers.
L’archive ouverte pluridisciplinaire HAL, est destinée au dépôt et à la diffusion de documents scientifiques de niveau recherche, publiés ou non, émanant des établissements d’enseignement et de recherche français ou étrangers, des laboratoires publics ou privés.
The assessment of temperature and salinity sampling
strategies in the Mediterranean Sea: idealized and real
cases
F. Raicich
To cite this version:
F. Raicich. The assessment of temperature and salinity sampling strategies in the Mediterranean Sea: idealized and real cases. Ocean Science Discussions, European Geosciences Union, 2006, 3 (3), pp.127-163. �hal-00298373�
OSD
3, 127–163, 2006 TS sampling strategy assessment in the Mediterranean Sea F. Raicich Title Page Abstract Introduction Conclusions References Tables Figures J I J I Back Close Full Screen / EscPrinter-friendly Version Interactive Discussion
EGU
Ocean Sci. Discuss., 3, 127–163, 2006 www.ocean-sci-discuss.net/3/127/2006/ © Author(s) 2006. This work is licensed under a Creative Commons License.
Ocean Science Discussions
Papers published in Ocean Science Discussions are under open-access review for the journal Ocean Science
The assessment of temperature and
salinity sampling strategies in the
Mediterranean Sea: idealized and real
cases
F. Raicich
CNR, Istituto di Scienze Marine, viale Romolo Gessi 2, 34123 Trieste, Italy Received: 20 March 2006 – Accepted: 3 April 2006 – Published: 16 May 2006 Correspondence to: F. Raicich ([email protected])
OSD
3, 127–163, 2006 TS sampling strategy assessment in the Mediterranean Sea F. Raicich Title Page Abstract Introduction Conclusions References Tables Figures J I J I Back Close Full Screen / EscPrinter-friendly Version Interactive Discussion
EGU
Abstract
Temperature and salinity sampling strategies are studied and compared by means of the Observing System Simulation Experiment technique in order to assess their use-fulness for data assimilation in the framework of the Mediterranean Forecasting Sys-tem (MFS). Their impact in a Mediterranean General Circulation Model is quantified
5
in numerical twin experiments via bivariate data assimilation of temperature and salin-ity profiles in summer and winter conditions, using the optimal interpolation algorithm implemented in the System for Ocean Forecasting and Analysis. The data impact is quantified by the error reduction in the assimilation run relative to the free run.
The sampling strategies studied here include various combinations of temperature
10
and salinity profiles collected along Volunteer Observing Ship (VOS) tracks, by Mediter-ranean Multi-sensor Moored Arrays (M3A), a Glider and ARGO floating profilers. Ideal-ized sampling strategies involving VOS data allow to recognize the impact of individual tracks. As a result, the most effective tracks are those crossing regions characterized by high mesoscale variability and the presence of frontal structures between water
15
masses.
Sampling strategies adopted in summer-autumn 2004 and winter 2005 are studied to assess the impact of VOS and ARGO data in real conditions. The combination of all available data allows to achieve up to 30% error reductions. ARGO data produce a small impact when alone, but represent the only continuous coverage of the basin and
20
are useful as a complement to VOS data sets.
Localized data sets, as those obtained by M3As and the Glider seem to have an almost negligible impact in the basin-scale assessment, and are expected to be more effective at regional scale.
OSD
3, 127–163, 2006 TS sampling strategy assessment in the Mediterranean Sea F. Raicich Title Page Abstract Introduction Conclusions References Tables Figures J I J I Back Close Full Screen / EscPrinter-friendly Version Interactive Discussion
EGU
1 Introduction
The Mediterranean Sea is a basin largely dominated by open ocean processes whose influence can be observed also in the coastal and shelf circulation. The large-scale general circulation is composed of intense coastal boundary currents and gyres with large seasonal and interannual variability (Malanotte-Rizzoli et al., 1999; Millot, 1999).
5
The horizontal structure of the circulation is associated to vertical motions connected with the formation of deep and intermediate water masses. The major current struc-tures and the water-mass formation processes are driven by the atmospheric forcing, namely wind stress and heat fluxes.
The overall objective of the Mediterranean Forecasting System (MFS) is to
ex-10
plore, model and quantify the potential predictability of the marine ecosystem vari-ability (Pinardi and Flemming, 1998). This task requires, among other elements, a suitable observational system to monitor the relevant physical and biogeochemical parameters. Different platforms contribute to the collection of temperature and salin-ity along the water column in the MFS. In particular, temperature is measured with
15
eXpendable Bathy-Thermographs (XBTs) deployed along Volunteer Observing Ship (VOS) tracks, following the methodology described by Manzella et al. (2003); temper-ature and salinity profiles are measured by Conductivity-Tempertemper-ature-Depth probes (CTDs) included in Mediterranean Moored Multi-sensor Arrays (M3As) (Nittis et al., 2003, 20061), MedARGO profiling floats (Poulain, 2005) and by an autonomous Glider
20
(http://www.ifm.uni-kiel.de). Such data are subsequently assimilated into a
Mediter-ranean General Circulation Model (GCM) for the purpose of forecasting (Demirov et al., 2003).
The time and space coverage provided by oceanographic data sets is generally lim-ited and the optimization of data sampling, although a desirable task, is in practice
25 1
Nittis, K., Tziavos, C., Bozzano, R., Cardin, V., Thanos, I., Gaˇci´c, M., and Petihakis, G.: The M3A multi-sensor buoy network of the Mediterranean Sea, Ocean Sci. Discuss., submitted, 2006.
OSD
3, 127–163, 2006 TS sampling strategy assessment in the Mediterranean Sea F. Raicich Title Page Abstract Introduction Conclusions References Tables Figures J I J I Back Close Full Screen / EscPrinter-friendly Version Interactive Discussion
EGU
difficult to achieve due to financial and logistic constraints. The objective of the present work is to assess and compare the usefulness of a number of sampling strategies in-volving the collection of temperature and salinity profiles using Observing System Sim-ulation Experiments (OSSE) techniques. The OSSE approach was first adopted by the meteorological community to assess the impact of future (i.e. not yet available from
5
current instruments) observations, in order to improve numerical weather predictions, and to assess the design of observing systems and observing networks (e.g. Arnold and Dey, 1986; Rohaly and Krishnamurti, 1993). Previous oceanographic applications to sampling strategy optimization, or assessment towards optimization, are reported by Kindle (1986), Bennett (1990), Barth and Wunsch (1990), Hernandez et al. (1994) and
10
Hackert et al. (1998). OSSEs were also applied to observing systems in the Mediter-ranean Sea in the framework of the MediterMediter-ranean Forecasting System Pilot Project (MFSPP) (Raicich and Rampazzo, 2003) and in the Baltic Sea and North Sea in the Optimal Design of Observational Networks project (She et al., 2006).
The MFSPP experience was the first one in which OSSEs were applied to the
15
Mediterranean Sea. Raicich and Rampazzo (2003) studied the impact of sets of tem-perature profiles, obtained by XBTs deployed along VOS tracks and during aircraft surveys, into a Mediterranean GCM. The OSSEs made use of univariate assimila-tion of temperature data that allowed the explicit correcassimila-tion of temperature fields only, while the other prognostic variables changed as a consequence of that correction. The
20
present work represents an evolution of the previous approach, consisting in the use of bivariate data assimilation of temperature and salinity profiles, thus enabling the explicit correction of both variables.
In the next section the methods will be outlined and in Sect. 3 the idealized and real sampling strategies studied in this work will be described. In Sects. 4 and 5 the
25
results of the sampling strategy assessment will be summarized and discussed for the idealized and real cases, respectively. In Sect. 6 conclusive remarks will be presented.
OSD
3, 127–163, 2006 TS sampling strategy assessment in the Mediterranean Sea F. Raicich Title Page Abstract Introduction Conclusions References Tables Figures J I J I Back Close Full Screen / EscPrinter-friendly Version Interactive Discussion
EGU
2 Methods
The OSSE technique used here consists of identical twin experiments, in which data extracted from a reference model run is assimilated into another run of the same model with different initial conditions. The convergence of the second run towards the first one is measured to quantify the data assimilation effectiveness in driving the model with
5
“wrong” initial conditions towards the reference. Each twin experiment includes: a) a control run, which represents the “true” ocean and provides the simulated temperature data to be used in the assimilation; b) an assimilation run, with different initial conditions from the control run and including the assimilation of temperature and salinity data extracted from the control run; c) a free run, initialized as the assimilation run but
10
without data assimilation. All runs are driven by the same external forcing.
The convergence of the assimilation run towards the control run is assessed by means of standard deviations of differences between the two runs (Miyakoda et al., 1969). The convergence of the free run towards the control run, assessed in the same way, is used as a reference, since it shows the ability of the model to converge
to-15
wards the control run due to the external forcing. Standard deviations, which involve the anomalies relative to the spatial means, are adopted instead of root-mean-squared differences, computed with the full fields, since they turn to be more sensitive to data assimilation, as discussed in Raicich and Rampazzo (2003). In what follows the stan-dard deviation will be denoted simply as the “error” and the ratio between error in the
20
assimilation run and error in the free run as the “relative error”.
The sampling strategy analysis is performed only for basin-scale regions, therefore standard deviations are computed for the western Mediterranean (Alboran Sea, Alge-rian Current region, Gulf of Lions, Tyrrhenian Sea and northern Sicily Channel) and eastern Mediterranean (southern Sicily Channel, Adriatic Sea, Ionian Sea, Aegean
25
Sea and Levantine Basin). Three layers are taken into account, namely the surface layer (L1), consisting of 10 model levels from 5 to 240 m depth, the intermediate layer (L2), composed of 4 levels from 280 to 400 m and roughly corresponding to the
Levan-OSD
3, 127–163, 2006 TS sampling strategy assessment in the Mediterranean Sea F. Raicich Title Page Abstract Introduction Conclusions References Tables Figures J I J I Back Close Full Screen / EscPrinter-friendly Version Interactive Discussion
EGU
tine Intermediate Water layer (e.g. Malanotte-Rizzoli et al., 1999), and the deep layer (L3), which includes 17 levels from 440 m to the sea bottom.
The Mediterranean GCM used for the simulations is an eddy-resolving version of the Geophysical Fluid Dynamics Laboratory MOM-1 (Pacanowski et al., 1990), with 1/8◦×1/8◦ grid mesh and 31 vertical levels (5, 15, 30, 50, 70, 90, 120, 160, 200, 240,
5
280, 320, 360, 400, 440, 480, 520, 580, 660, 775, 925, 1150, 1450, 1750, 2050, 2350, 2650, 2950, 3250, 3550 and 3850 m). Its implementation includes interactive surface heat flux calculation, surface salinity relaxation and constant vertical diffusion. Further details on the model and its setup can be found in Korres et al. (2000) and Demirov et al. (2003). The model is forced by ECMWF 6-hourly operational analyses of 10-m wind
10
and 2-m air temperature, used also in the surface heat flux calculation. Surface salinity is relaxed to the MED6 climatology (Brasseur et al., 1996; Fichaut et al., 1998).
Data assimilation is performed by means of an optimal interpolation technique based on the scheme by Derber and Rosati (1989) and implemented in the System for Ocean Forecasting and Analysis (SOFA), described by De Mey (1994, 1997) and De Mey and
15
Benkiran (2002). SOFA includes a reduced-order multivariate optimal interpolation scheme, where the order reduction is achieved by projecting the state vector onto vertical EOFs, that represent the eigenvectors of the error covariance matrix for the forecast. The scheme is multivariate in terms of both data input and corrections to the model output.
20
The application of multivariate data assimilation enables to overcome a limitation that affected the sampling strategy assessment performed in the MFSPP (Raicich and Rampazzo, 2003), where only univariate temperature assimilation was available. Fig-ure 1 displays a comparison of winter salinity relative errors for the whole Mediter-ranean Sea obtained in runs with univariate temperature assimilation (UT),
bivari-25
ate temperature assimilation (BT) and bivariate temperature and salinity assimilation (BTS). The data set consists of profiles along all the VOS tracks of the network adopted in the pilot study and assimilation is performed on a weekly basis using only past data (filter mode). Details on this data set can be found in Raicich and Rampazzo (2003).
OSD
3, 127–163, 2006 TS sampling strategy assessment in the Mediterranean Sea F. Raicich Title Page Abstract Introduction Conclusions References Tables Figures J I J I Back Close Full Screen / EscPrinter-friendly Version Interactive Discussion
EGU
In the UT run salinity changes are the result of the model rearrangement induced by temperature correction. In the BT run temperature is still the only observable available for assimilation, but salinity is also assimilated after being estimated by means of the vertical EOFs and, therefore, corrected. Finally, in the BTS run both temperature and salinity are explicitly assimilated and corrected. From Fig. 1 it is evident that BTS
per-5
forms much better than UT and BT (that are similar) in both L1 and L2, with a relative error reduction of about 20%. In L3 (not shown) the relative error reductions for UT and BTS are similar and both less than 10%, while BT does not exhibit any improve-ments over the free run. The latter fact may be due to an inadequate EOF estimate of salinity, which is statistical and may not represent well the water column condition
10
of the specific time when the experiment is performed. The same analysis for temper-ature shows that, although the relative error reductions in the three runs do not differ much from each other, temperature benefits from the explicit assimilation of salinity, particularly in the western basin.
In the present work a model run is based on a sequence of two 7-day assimilation
15
cycles, the first of which involving temperature and salinity (TS cycle) and the sec-ond sea-level anomaly (SLA cycle). In both cycles past and future observations within a 14-day window are included (smoother mode). In the TS cycle the assimilation of temperature and salinity profiles is performed by means of the vertical bivariate EOFs estimated from a 1993–1999 GCM run following the technique outlined by Sparnocchia
20
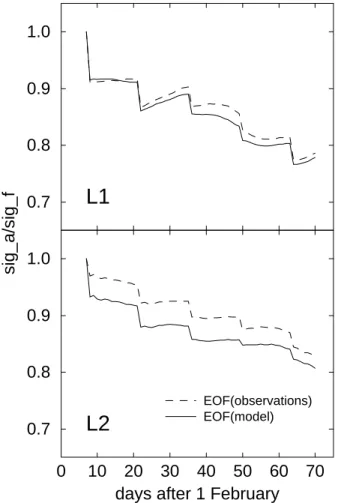
et al. (2003). The first 20 EOFs are used. The choice of using a model run to estimate the EOFs is coherent with the fact that the OSSEs performed here involve GCM data instead of real observations. The better performance of assimilation with EOFs from model is shown in Fig. 2 for winter salinity in the western Mediterranean. This result holds also for temperature in the same region, while in the eastern basin the differences
25
are smaller. SLA assimilation involves trivariate EOFs for the barotropic streamfunc-tion, temperature and salinity. Only one trivariate EOF is used for the whole basin, extending from 120 m depth downward (Demirov et al., 2003) and the assimilation is made only in regions deeper than 1000 m ( ¨Ozs ¨oy et al., 1993).
OSD
3, 127–163, 2006 TS sampling strategy assessment in the Mediterranean Sea F. Raicich Title Page Abstract Introduction Conclusions References Tables Figures J I J I Back Close Full Screen / EscPrinter-friendly Version Interactive Discussion
EGU
Corrections are applied to the model temperature and salinity at the end of each TS cycle. The data error covariance radius is 10−6km and the e-folding time is 10−6days, implying that the data are uncorrelated with each other. The forecast error covariance radius is 45 km and e-folding time is 105 days, which results in giving all the data within the assimilation window essentially the same weight. The assimilation scheme and the
5
parameter values are based on the model setup adopted by Demirov et al. (2003). The SLA data assimilated every other cycle consists of weekly SLA analyses from real observations (LeTraon and Ogor, 1998) and has the purpose of providing the model with an external control. As anticipated in the Introduction, the twin experiments are performed to study the impact of temperature and salinity data, therefore the SLA
10
data are the same in all runs.
OSSEs are made in two seasonal configurations defined as “summer” and “winter”, according to the initial state of the ocean, and each experiment lasts for 70 days, cor-responding to 10 assimilation cycles (5 TS cycles and 5 SLA cycles). The summer OSSEs are initialized on 1 September 1999, and end on 9 November 1999, while the
15
winter OSSEs cover the period 1 February–10 April 2000. Free run and assimilation run are initialized on 1 September 1998 (summer) and 1 February 1999 (winter). All the initialization fields are taken from an interannual simulation with data assimilation forced by ECMWF 6-hourly analyses.
3 Sampling strategies description
20
In this work two types of sampling strategies are studied, namely idealized and real. Idealized sampling strategies are those with a realistic basis but that cannot be adopted because the sampling is either too frequent in time or too dense in space than practi-cally achievable, or because observations are not really performed although potentially feasible. Their study is essentially made for a comparative assessment of different
25
elements of the observing system. Real sampling strategies involve actual data distri-butions and enable the assessment of the whole observing system or parts of it.
OSD
3, 127–163, 2006 TS sampling strategy assessment in the Mediterranean Sea F. Raicich Title Page Abstract Introduction Conclusions References Tables Figures J I J I Back Close Full Screen / EscPrinter-friendly Version Interactive Discussion
EGU
Among the idealized sampling strategies this work examines those involving profiles obtained from the deployment of probes along VOS tracks and from CTD measure-ments at M3A sites. At present only temperature profiles are measured along VOS tracks using XBTs. In order to obtain also salinity, XCTDs (eXpendable CTDs) would be required, but they are not available. In the OSSEs the case of both temperature and
5
salinity profiles from VOS will be studied. In this work the elements of real data distri-butions are the VOS track network design and the time availability of typical M3A data, while the other details described below are idealized, although realistic. The idealized sampling strategies under study are:
1) IdVOS (Idealized VOS): The spatial design is based on the scheme of track
net-10
work adopted in the VOS programme of the Mediterranean ocean Forecasting System Towards Environmental Predictions (MFSTEP) project (Manzella et al., 2003), shown in Fig. 3. The time coverage adopted in the numerical experiments is regular and more frequent than in practice. It is assumed that XCTD probes are released from VOS every 12 nautical miles, the times of deployment being
15
computed on the basis of nominal VOS speeds. For each track the numbers of profiles are: 82 (track 1), 57 (track 2 = 2a + 2b), 41 (track 3), 35 (track 4), 51 (track 5= 5a + 5b), 30 (track 6), 54 (track 7 = 7a + 7b) and 60 (track 8). All tracks are covered once a week except tracks 2a and 7a, only in the odd weeks, and 2b and 7b, only in the even weeks. The maximum depth of the synthetic profiles is
20
775 m (model level 20).
2) IdVOS-n (with n varying from 1 to 8): These sampling strategies are identical to IdVOS except that track n is not included.
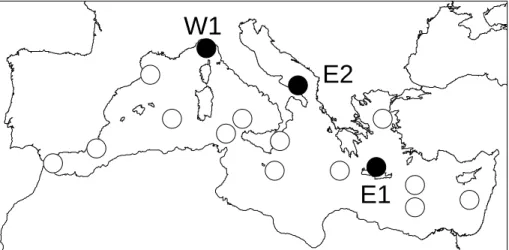
3) IdM3A (Idealized M3A): The simulated M3A network consists of the sites that are active in MFSTEP (W1, E1 and E2) as well as those that might be included as
25
possible future developments of the MFS according to the science plan (Pinardi and Flemming, 1998; Nittis et al., 2003) (Fig. 4). The positions of the 16 M3As are listed in Table 1. The active M3As exhibit different instrumental arrangements
OSD
3, 127–163, 2006 TS sampling strategy assessment in the Mediterranean Sea F. Raicich Title Page Abstract Introduction Conclusions References Tables Figures J I J I Back Close Full Screen / EscPrinter-friendly Version Interactive Discussion
EGU
and temperature and salinity data are measured at different depths. However, for simplicity, the M3As used in this impact study are all assumed to be equal to the array moored in the southern Aegean Sea off Iraklion, on the Northern coast of Crete Island. At this M3A site, temperature and salinity are measured at 1.5, 30, 50, 75, 100, 150, 250, 350 and 500 m depth (Nittis et al., 20061). These
5
depths approximately correspond to the following Mediterranean GCM levels: 5 m (level 1), 30 (3), 50 (4), 70 (5), 100 (6), 160 (8), 240 (10), 360 (13) and 480 m (16). The real M3A acquires data every hour and transmits them every 3 hours. The simulated data are provided every 6 h, namely at 00:00, 06:00, 12:00 and 18:00 UTC.
10
4) IdVOSM3A: The combination of IdVOS and IdM3A.
The real sampling strategies studied in this work are defined on the basis of the obser-vations that have been performed in the Mediterranean Sea in 2004 and 2005, mostly during the MFSTEP Targeted Operational Period. The following real sampling strate-gies are taken into account:
15
1) Vt (real VOS): Temperature profiles obtained from XBTs deployed along MFSTEP VOS tracks and from other ships.
2) ARGO (real ARGO): Temperature and salinity profiles from ARGO floats used in MFSTEP (MedARGO) and other programmes.
3) VtARGO: The merging of Vt and ARGO.
20
4) VtARGOG: The merging of VtARGO and Glider data, only in the East Mediter-ranean.
In the group of real sampling strategies two other cases are considered, in which salin-ity profiles, that are not actually available, are added to the real VOS temperature profiles, thus simulating the deployment of XCTDs:
OSD
3, 127–163, 2006 TS sampling strategy assessment in the Mediterranean Sea F. Raicich Title Page Abstract Introduction Conclusions References Tables Figures J I J I Back Close Full Screen / EscPrinter-friendly Version Interactive Discussion
EGU
5) Vts: Temperature and salinity profiles obtained along MFSTEP VOS tracks and from other ships.
6) VtsARGO: The merging of Vts and ARGO.
Figures 5 and 6 show the VOS and ARGO data positions during the ten weeks of the summer (1 September–9 November 2004) and winter (1 February–10 April 2005)
5
OSSEs, respectively. All the Glider data positions are shown together in Fig. 7. Table 2 summarizes the number of profiles available weekly for each sampling strategy and the Glider. The maximum depth of VOS profiles is 775 m (model level 20), that of ARGO profiles is 660 m (model level 19) and that of Glider profiles is 925 m (model level 21). It should be stressed that, even when the sampling strategies are based on real data
10
distributions, only the data times and positions are taken from the survey schemes, while the temperature profiles for assimilation are always extracted from the control runs, namely for summer-autumn 1999 and winter 2000, at the appropriate times and positions. Summer and winter OSSEs are performed for all the sampling strategies described above.
15
4 Assessment of idealized sampling strategies
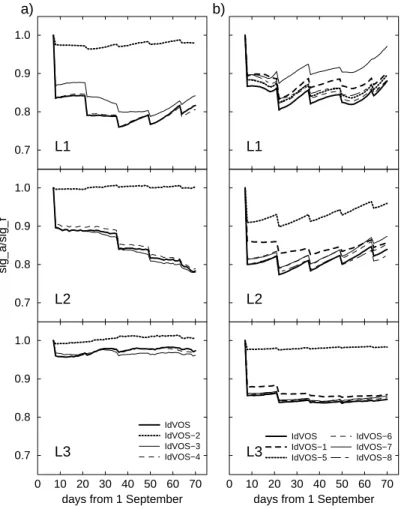
Figures 8–9 display examples of temperature and salinity relative errors, i.e. the ratios between the assimilation run error (“sig a” in the figures) and the free run error (“sig f”), computed on a daily basis for the idealized sampling strategies involving only VOS profiles, that are outlined in Sect. 3. The comparison of sampling strategies IdVOS-n
20
(n= 1,. . . ,8) with the basic strategy IdVOS allows to estimate the amount of relative error reduction lost by removing track n, and, therefore, the relative impact of that track. Note that, for a given Mediterranean subbasin (western or eastern), the comparison involves only the tracks crossing that subbasin, namely tracks 2, 3, 4 for the western Mediterranean and tracks 1, 5, 6, 7, 8 for the eastern Mediterranean. The reason is
OSD
3, 127–163, 2006 TS sampling strategy assessment in the Mediterranean Sea F. Raicich Title Page Abstract Introduction Conclusions References Tables Figures J I J I Back Close Full Screen / EscPrinter-friendly Version Interactive Discussion
EGU
that, within the experiment duration, the impact of each track is negligible in the other subbasin.
In the summer OSSEs in the western basin (Fig. 8a) the relative error reduction achieved in L1 by strategy IdVOS reaches 20%, 10–15% for temperature and up to about 20% for salinity, at the end of the experiment, in L2, and less than 5% in L3,
5
i.e. almost negligible. The curves for strategy IdVOS-2 approach 1 and are clearly distinguishable from the others. This means that track 2 has a strong impact on data assimilation, since its removal leads to almost no improvement over the free run. By contrast, the impact of track 4 is small, as shown by the very small differences between the IdVOS-4 and IdVOS curves. The removal of track 3 produces a little improvement
10
in L2 and L3, more marked for temperature (not shown), probably because the assim-ilation of data along tracks 2b and 3 produces an undesired correction to the model in some areas. This fact can occur since the correction, whose size depends on the difference between assimilation and free runs, is propagated away from the data posi-tions. It may then affect area where the difference between assimilation and free runs
15
is much smaller or even of opposite sign, and, therefore, does not require that correc-tion. This situation may be expected particularly in case of high mesoscale variability. A more adequate choice of the optimal interpolation parameters can probably reduce this problem.
In the eastern Mediterranean (Fig. 8b) the situation is more complex. Strategy IdVOS
20
leads to a maximum error reduction of about 15% for temperature and 10% for salinity in L1, 20% in L2 and about 15% in L3. A remarkable result is represented by the large impact of track 5 (5a+ 5b) in L2 and L3, both for temperature and salinity, with error reduction loss of 10–15% relative to strategy IdVOS. In L1 track 7 (7a + 7b) seems important for temperature only. Despite its length, track 1 has a comparatively small
25
impact.
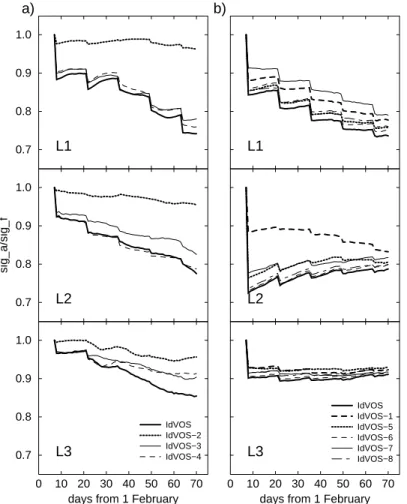
The importance of track 2 in the western Mediterranean is observed also in winter (Fig. 9a). Temperature and salinity relative error reductions achieved by strategy Id-VOS reach 20–30% in L1 and L2 and 10–15% in L3, while with IdId-VOS-2 they drop to
OSD
3, 127–163, 2006 TS sampling strategy assessment in the Mediterranean Sea F. Raicich Title Page Abstract Introduction Conclusions References Tables Figures J I J I Back Close Full Screen / EscPrinter-friendly Version Interactive Discussion
EGU
approximately 5%, except for temperature in L2 with 10% (not shown). In the eastern basin (Fig. 9b) strategy IdVOS leads, at the end of the run, to maximum relative error reductions of about 20% for temperature and 15% for salinity in L1 and L2, and less than 10% in L3. In general, all the sampling strategies exhibit similar impacts, with the only exception found for temperature in L2, where the relative error reduction with
strat-5
egy IdVOS-1 appears to be relatively small during most of the run, however converging towards that of the other strategies. As in summer, the absence of track 7 has a certain effect in L1 for temperature. The impact of track 5 is less marked than in summer, since only salinity exhibits an error reduction loss of about 5% in all layers (not shown).
Although it is reasonable to relate the impact of a track mainly to its length, which
10
determines the area where the model is corrected by data assimilation, tracks crossing regions with complex dynamics produce a stronger impact. The Mediterranean Sea circulation is highly variable both in space and time, due to the presence of gyres, currents and frontal structures that exhibit notable interannual variability (Malanotte-Rizzoli, 1999; Millot, 1999). Figure 10 displays the differences between the initial
con-15
ditions of the assimilation and the control runs for summer salinity at 320 m depth and winter temperature at 70 m. Changes at the mesoscale are generally observed, but also larger scale differences are evident. For instance, in summer at 320 m depth (Fig. 10a) the assimilation run starts with higher salinity than the control in the northern part of the East Mediterranean, while salinity is lower close to the Gibraltar Strait. In
20
winter at 70 m depth (Fig. 10b) at the beginning of the assimilation run temperature is generally lower than in the control in the southern part of the eastern basin, whereas it is higher in the northern and eastern Levantine Basin and part of the West Mediter-ranean. From the numerical experiments it turns out that, in order to better drive the model towards the truth in the assimilation run, the observations performed in areas
25
with high spatial variability can be critical. Relatively large differences between the as-similation and free runs are more likely to occur in areas with high spatial variability, therefore tracks that sample those areas are expected to produce the most effective corrections, since even small differences in the mesoscale structure and fronts
posi-OSD
3, 127–163, 2006 TS sampling strategy assessment in the Mediterranean Sea F. Raicich Title Page Abstract Introduction Conclusions References Tables Figures J I J I Back Close Full Screen / EscPrinter-friendly Version Interactive Discussion
EGU
tions can significantly affect the error. In the VOS track network adopted in this work, track 2 samples the West Mediterranean in the Algerian Basin, characterized by a com-plex meandering current. Track 5 crosses the northwestern Ionian Sea, where in the intermediate and deep layers non-permanent cyclonic structures can be found as well as frontal structures between Adriatic Deep waters and recirculated LIW. Track 7 covers
5
part of the Levantine Basin, characterized by the Rhodes, I ´erapetra and Mersa-Matruh gyres (schemes of the main features of the Mediterranean circulation can be found in Malanotte-Rizzoli, 1999; Millot, 1999).
The addition of M3A temperature and salinity data to VOS profiles (strategy Id-VOSM3A) generally produce a very small, if not negligible, impact in all seasons and
10
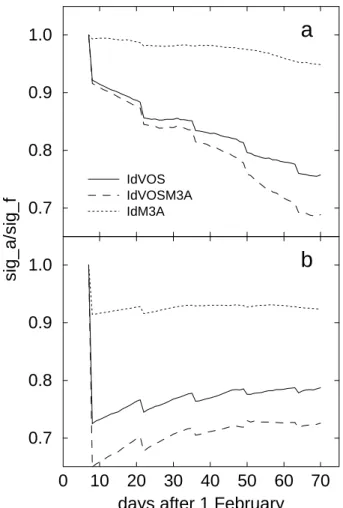
layers. Considering the error reduction achieved by sampling strategy IdVOS as the ref-erence, the improvement with IdVOSM3A is often less than 5% (generally only 2–3%). Figure 11 displays comparisons of relative errors for sampling strategies IdVOSM3A and IdVOS in the cases with the largest impact of the M3A data, namely in winter in the eastern Mediterranean in L2 for temperature (Fig. 11a) and in L1 for salinity
15
(Fig. 11b). The improvement is represented by about 7% error reduction. The results with M3A data only, namely sampling strategy IdM3A, are also shown.
5 Assessment of real sampling strategies
The comparisons of temperature and salinity relative errors using real sampling strate-gies are shown in Figs. 12–13.
20
The sampling strategy VtARGO, corresponding to the real data distributions shown in Figs. 5–6, produces temperature relative error reductions up to 30%. The largest impact of temperature data is found in the surface and intermediate layers. More in details, in summer in the West Mediterranean the temperature relative error reduction is up to 20–25% (Fig. 12a) while in the eastern basin the maximum is about 10%. In
25
winter in L1 it is about 20% in the western basin and 30% in the eastern (Fig. 13a), while in L2 the maximum is about 25% in both subbasins. In L3 relative the error
reduc-OSD
3, 127–163, 2006 TS sampling strategy assessment in the Mediterranean Sea F. Raicich Title Page Abstract Introduction Conclusions References Tables Figures J I J I Back Close Full Screen / EscPrinter-friendly Version Interactive Discussion
EGU
tion is generally around 10% except in the East Mediterranean in summer, where it is almost negligible. Concerning salinity, the relatively small data amount does not allow to reduce the error by more than approximately 10%, as in summer in L1 (Fig. 12b) and in winter in L3, both in the western basin. In most cases the relative error reduction is from negligible to about 5%. Clearly, with strategy VtARGO temperature is corrected
5
more effectively than salinity since the latter is provided by ARGO floats only. The data amount, reported in Table 2, represents a critical factor. The difference is smaller in L3, which is covered by observations only in the upper part (440–775 m).
The addition of salinity data, i.e. the use of sampling strategy VtsARGO, significantly reduces salinity errors (as can be easily expected). The largest improvement is found
10
in the West Mediterranean in summer, where the error reduction reaches 30% in L1, namely 20% further error reduction relative to strategy VtARGO, and 20% in L2, namely 15% additional error reduction (Fig. 12b). More limited improvement, but still relatively large, is found in winter, again in the western basin, where the relative error reduction reaches 10% in L1 and L2. Concerning temperature, a 2–3% relative error
reduc-15
tion decrease relative to strategy VtARGO is found in summer in the western basin (Fig. 12a), while the differences are small in the other cases.
A major result is that the real sampling strategy VtARGO can achieve error reduc-tions that are comparable to those obtained with the idealized strategy IdVOS. This occurs in the western basin both in summer and winter and only in winter in the
east-20
ern basin. Note that in weeks 1–6 the summer data coverage in the East Mediterranean is quite poor (Fig. 5). The comparison is more proper for temperature, while the dis-tributions of salinity data differ significantly between the two sampling strategies. The availability of more salinity profiles is very advantageous to the model performance. In fact, the explicit assimilation of salinity profiles along VOS tracks produces a large
de-25
crease of salinity relative errors, together with a marginal improvement to temperature. The impact of sampling strategy ARGO, consisting of ARGO profiles only, is small in most cases, but, particularly in the deep layer, it is sometimes comparable to that of VOS data. Note, however, that the deep layer is sampled by VOS and ARGO profiles
OSD
3, 127–163, 2006 TS sampling strategy assessment in the Mediterranean Sea F. Raicich Title Page Abstract Introduction Conclusions References Tables Figures J I J I Back Close Full Screen / EscPrinter-friendly Version Interactive Discussion
EGU
only above approximately 700 m depth. Its largest effectiveness is found for tempera-ture, in winter in the eastern basin with about 15% relative error reduction in L1 and 10% in L2 (not shown), and in summer in the western basin in L2 and L3, with about 10% relative error reduction at the end of the run (Fig. 12a). In all other cases the error reduction is almost negligible.
5
Due to the logistic limitations in the VOS network coverage, ARGO profilers turn out to be the only data source which is continuously available, representing a sort of “background” observing system for temperature and salinity. Despite the small impact of the available ARGO data set, it allows a certain improvement of the model perfor-mance and can be regarded as a useful complement to VOS profiles. As an example,
10
Fig. 14 displays spatial distribution of corrections to temperature and salinity made at 5 m depth after day 7, that is the end of the first assimilation cycle, using sampling strategy VtARGO. Since the assimilation is performed in smoother mode, all the data in a 14-day window centred on the end of day 7 are taken into account. Therefore, in Fig. 14 the fields are corrected around the data points shown in panels 1 and 2 of Fig. 5
15
(summer, corresponding to Fig. 14, panels a, c) and Fig. 6 (winter, corresponding to Fig. 14, panels b, d).
Note that relative errors can exhibit increments when corrections are applied, as for summer salinity in the western basin in L2 (Fig. 12b) and winter salinity in the eastern basin in L2 (Fig. 13b). Similar events are also found for summer salinity in the eastern
20
basin in L2, winter salinity in the western basin in L3 and winter temperature in the western basin in L2 and L3 (not shown). The case concerning temperature occurs in week 7 and is related to sampling strategies Vt and Vts, that include only VOS data. The likely reason is the data lack in the West Mediterranean during weeks 7–8, while in weeks 1–6 VOS data are available at least every other assimilation cycle (Fig. 6).
25
The cases concerning salinity are observed below the surface layer in both the eastern and western basins and are related to sampling strategies VtARGO and Vt. Changes in the data amount do not seem to be the main reason (see Figs. 5–6), but note that in the above mentioned sampling strategies most of the profiles (VtARGO) or all of them
OSD
3, 127–163, 2006 TS sampling strategy assessment in the Mediterranean Sea F. Raicich Title Page Abstract Introduction Conclusions References Tables Figures J I J I Back Close Full Screen / EscPrinter-friendly Version Interactive Discussion
EGU
(Vt) do not contain salinity data, which is reconstructed from temperature using the bivariate EOFs. As explained in Sect. 2, the EOFs are the result of a statistical anal-ysis of a 1993–1999 model run and may not represent well enough the experimental conditions of summer-autumn 1999 and winter 2000. As a consequence, the salinity reconstruction may not be adequate.
5
The use of Glider profiles does not represent a significant improvement. Compared to VtARGO, strategy VtARGOG determines an additional relative error reduction which is never greater than 3%, and in winter in L2 and L3 there is even a small relative error reduction loss, i.e. a worse result. Note, however, that Glider data are available only during weeks 5–10 in summer and 1–4 in winter (Table 2).
10
6 Summary and conclusions
OSSEs have been performed to study and compare the usefulness of different temper-ature and salinity sampling strategies which are or may be included in the operational observing system set up in the Mediterranean Sea for forecasting purposes. The sam-pling strategy assessment has been made by means of twin experiments in which the
15
impact of data assimilation into a Mediterranean GCM is quantified as the error reduc-tion achieved in the assimilareduc-tion run relative to the free run.
The impact of temperature and salinity profiles along VOS tracks has been studied in idealized configurations. The importance of each track has been assessed in terms of relative error reduction loss when it is removed from the whole data set. As a result, the
20
largest impact is associated to tracks crossing regions with complex dynamics, namely track 2, that crosses the Algerian Current, and track 5, crossing the northwestern Ionian Sea and the steep escarpment to the East of Sicily. Such regions are characterized by mesoscale variability and frontal structures that exhibit notable interannual variability.
A major result of the real sampling strategy assessment is that the temperature
pro-25
files from VOS and temperature and salinity profiles from ARGO floats, that have been actually obtained in summer autumn 2004 and winter 2005, can produce error
reduc-OSD
3, 127–163, 2006 TS sampling strategy assessment in the Mediterranean Sea F. Raicich Title Page Abstract Introduction Conclusions References Tables Figures J I J I Back Close Full Screen / EscPrinter-friendly Version Interactive Discussion
EGU
tions that are comparable to those obtained with the idealized strategy IdVOS. The direct availability of salinity data along VOS tracks, together with temperature, would greatly improve the model performance, since the salinity reconstructed using EOFs seems in some cases inadequate. The impact of ARGO data is generally small, but sometimes comparable to that of VOS data. The combination of VOS and ARGO
5
seems to be the most useful solution, since the VOS programme, whose flexibility is limited by several practical constraints, can be complemented by the ARGO floats, that, although in a limited number, represent a continuously available data source scattered over a wide area.
Localized data as the M3A profiles, in the idealized sampling strategies, and Glider
10
profiles, in the real case, turn out to be of little usefulness in comparison to data sets that cover wide areas. It should be reminded that the present analysis is performed at large scale, namely for the East and West Mediterranean basins, and the impact of localized data set is certainly much more significant at a regional scale, particularly in the absence of other data sources. Although the idealized M3A network covers the
15
whole Mediterranean, its impact is still almost negligible at a basin scale.
Acknowledgements. The Author would like to thank M. Adani (INGV, Bologna) for providing the
bivariate EOFs and S. Sparnocchia (CNR-ISMAR, Trieste) for fruitful discussion.
The positions and times of real data used in this work are made freely available by the French Coriolis project and the International Argo Project through the Coriolis Data Centre (http://www.
20
coriolis.eu.org).
This work has been partly supported by the “Mediterranean ocean Forecasting System Towards Environmental Prediction” project, EC Contract EVK3-CT2002-00075.
References
Arnold Jr., C. P. and Dey, C. H.: Observing-system simulation experiments: Past, present and
25
OSD
3, 127–163, 2006 TS sampling strategy assessment in the Mediterranean Sea F. Raicich Title Page Abstract Introduction Conclusions References Tables Figures J I J I Back Close Full Screen / EscPrinter-friendly Version Interactive Discussion
EGU
Barth, N. and Wunsch, C.: Oceanographic experiment design by simulated annealing, J. Phys. Oceanogr., 20, 1249–1263, 1990.
Bennett, A. F.: Inverse methods for assessing ship-of-opportunity networks and estimating circulation and winds from tropical expendable bathythermograph data, J. Geophys. Res., 95, 16 111–16 148, 1990.
5
Brasseur, P., Beckers, J. M., Brankart, J. M., and Schoenauen, R.: Seasonal temperature and salinity fields in the Mediterranean Sea: Climatological analyses of an historical data set, Deep-Sea Res., 43, 159–192, 1996.
De Mey, P.: Optimal interpolation in a model of the Azores current in 1986–88, in: Data assim-ilation: Tools for modelling the ocean in a global perspective, NATO/ASI Series, I/19, edited
10
by: Brasseur, P. P. and Nihoul, J. C. J., Springer-Verlag, 253 pp., 1994.
De Mey, P.: Data assimilation at the oceanic mesoscale: A Review, J. Met. Soc. Japan, 75, Special issue on “Data assimilation in meteorology and oceanography: Theory and practice”, 415–427, 1997.
De Mey, P. and Benkiran, M.: A multivariate reduced-order optimal interpolation method and its
15
application to the Mediterranean basin-scale circulation, in: Ocean Forecasting Conceptual Basis and Applications, edited by: Pinardi, N. and Woods, J., Springer-Verlag, 281–306, 2002.
Demirov, E., Pinardi, N., Fratianni, C., Tonani, M., Giacomelli, L., and De Mey, P.: Assimilation scheme of Mediterranean Forecasting System: Operational implementation, Ann. Geophys.,
20
21, 189–204, 2003.
Derber, J. and Rosati, A.: A global oceanic data assimilation scheme, J. Phys. Oceanogr., 19, 1333–1347, 1989.
Fichaut, M., Balopoulos, E., Dooley, H., Garc´ıa-Fernandez, M.-J., Iona, A., Jourdan, D., Baudet, L., and Maillard, C.: A common protocol to assemble a coherent database from
dis-25
tributed heterogeneous data sets: The MEDATLAS database experience, in: Marine science and technology programme: Experiences in project data management, edited by: Bohle-Carbonell, M., European Commission, Luxembourg, 349 pp, 1998.
Hackert, E. C., Miller, R. N., and Busalacchi, A. J.: An optimized design for a moored instrument array in the tropical Atlantic Ocean, J. Geophys. Res., 103, 7491–7509, 1998.
30
Hernandez, F., Le Traon, P.-Y., and Barth, N. H.: Optimizing a drifter cast strategy with a genetic algorithm, J. Atmos. Ocean. Tech., 12, 330–345, 1994.
OSD
3, 127–163, 2006 TS sampling strategy assessment in the Mediterranean Sea F. Raicich Title Page Abstract Introduction Conclusions References Tables Figures J I J I Back Close Full Screen / EscPrinter-friendly Version Interactive Discussion
EGU
and prediction, J. Geophys. Res., 91, 2418–2432, 1986.
Korres, G., Pinardi, N., and Lascaratos, A.: The ocean response to low-frequency interannual atmospheric variability in the Mediterranean Sea. Part I: sensitivity experiments and energy analysis, J. Climate, 13, 705–731, 2000.
LeTraon, P.-Y. and Ogor, F.: ERS-1/2 orbit improvement using Topex/Poseidon: the 2 cm
chal-5
lenge, J. Geophys. Res., 103, 8045–8050, 1998.
Malanotte-Rizzoli, P., Manca, B. B., Ribera d’Alcal `a, M., Theocharis, A., Brenner, S., Budillon, G., and ¨Ozs ¨oy, E.: The Eastern Mediterranean in the 80s and in the 90s: the big transition in the intermediate and deep circulations, Dyn. Atmos. Oceans, 29, 365–395, 1999.
Manzella, G. M. R., Scoccimarro, E., Pinardi, N., and Tonani, M.: Improved near-real time
10
management procedures for the Mediterranean ocean Forecasting System – Voluntary Ob-serving Ship program, Ann. Geophys., 21, 49–62, 2003.
Millot, C.: Circulation in the Western Mediterranean Sea, J. Mar. Syst., 20, 423–442, 1999. Miyakoda, K., Smagorinsky, J., Strickler, R. F., and Hembree, G. D.: Experimental extended
predictions with a nine-level hemispheric model, Mon. Wea. Rev., 97, 1–76, 1969.
15
Nittis, K., Tziavos, C., Thanos, I., Drakopoulos, P., Cardin, V., Gaˇci´c, M., Petihakis, G., and Basana, R.: The Mediterranean Moored Multi-sensor Array (M3A): system development and initial results, Ann. Geophys., 21, 75–87, 2003.
¨
Ozs ¨oy, E., Hecht, A., ¨Unl ¨uata, ¨U., Brenner, S., Sur, S., Bishop, H. I., Latif, M. A., Rosentroub, Z., and O ˘guz, T.: A synthesis of the Levantine Basin circulation and hydrography, 1985–1990,
20
Deep-Sea Res., Part II, 40, 1075–1119, 1993.
Pacanowski, R. C., Dixon, K., and Rosati, A.: The GFDL Modular Ocean Model users guide, version 1.0, Geophysical Fluid Dynamics Laboratory Ocean Tech. Rep. 2, 18 pp., 1990. Pinardi, N. and Flemming, N. C. (Eds.): The Mediterranean Forecasting System Science Plan,
EuroGOOS Publication No. 11, Southampton Oceanographic Centre, Southampton, UK, 52
25
pp., 1998.
Poulain, P.-M.: A profiling float program in the Mediterranean, Argonautics, 6, 2, 2005.
Raicich, F. and Rampazzo, A.: Observing System Simulation Experiments for the assessment of temperature sampling strategies in the Mediterranean Sea, Ann. Geophys., 21, 151–165, 2003.
30
Rohaly, G. D. and Krishnamurti, I. N.: An observing system simulation experiment for the Laser Atmospheric Wind Sounder (LAWS), J. Appl. Meteor., 32, 1453–1471, 1993.
OSD
3, 127–163, 2006 TS sampling strategy assessment in the Mediterranean Sea F. Raicich Title Page Abstract Introduction Conclusions References Tables Figures J I J I Back Close Full Screen / EscPrinter-friendly Version Interactive Discussion
EGU
networks in the Baltic Sea and North Sea, J. Mar. Sys., Special Issue “Marine Environmental Monitoring and Prediction”, in press, 2006.
Sparnocchia, S., Pinardi, N., and Demirov, E.: Multivariate Empirical Orthogonal Function anal-ysis of the upper thermocline structure of the Mediterranean Sea from observations and model simulations, Ann. Geophys., 21, 167–187, 2003.
OSD
3, 127–163, 2006 TS sampling strategy assessment in the Mediterranean Sea F. Raicich Title Page Abstract Introduction Conclusions References Tables Figures J I J I Back Close Full Screen / EscPrinter-friendly Version Interactive Discussion
EGU
Table 1. Positions of the M3As considered in this study.
Western Mediterranean Eastern Mediterranean Array Latitude N Longitude E Array Latitude N Longitude E
W1 43.79 9.16 E1 35.73 24.92 W2 42.00 4.00 E2 41.28 17.66 W3 39.00 6.00 E3 35.50 15.50 W4 36.00 –5.00 E4 35.50 21.50 W5 37.00 –1.00 E5 34.50 28.50 W6 38.00 11.00 E6 33.50 33.50 W7 39.00 12.50 E7 37.50 16.00 E8 39.00 25.50 E9 33.00 28.50
OSD
3, 127–163, 2006 TS sampling strategy assessment in the Mediterranean Sea F. Raicich Title Page Abstract Introduction Conclusions References Tables Figures J I J I Back Close Full Screen / EscPrinter-friendly Version Interactive Discussion
EGU
Table 2. Number of profiles available weekly for each sampling strategy and the Glider in the
western (W) and eastern (E) Mediterranean.
Sampling strategy Basin
Odd weeks Even weeks IdVOS WE 101197 100218 Week of summer 2004 1 2 3 4 5 6 7 8 9 10 Vts WE 170 680 14320 1994 767 3276 133102 4769 1540 302 ARGO WE 89 179 105 99 168 79 148 135 108 177 VtsARGO WE 259 859 15325 10328 1592 3985 141116 5282 16210 1937 Glider E 0 0 0 0 161 343 334 255 198 325 Week of winter 2005 1 2 3 4 5 6 7 8 9 10 Vts WE 273 4466 10 8991 00 1041 1050 1816 110 259 ARGO WE 1215 199 1716 1612 139 1715 2013 1913 1414 1014 VtsARGO WE 1542 5385 1816 105103 139 2756 12513 3729 2514 1039 Glider E 332 377 428 94 0 0 0 0 0 0
OSD
3, 127–163, 2006 TS sampling strategy assessment in the Mediterranean Sea F. Raicich Title Page Abstract Introduction Conclusions References Tables Figures J I J I Back Close Full Screen / EscPrinter-friendly Version Interactive Discussion
EGU
0 10 20 30 40 50 60 70 80 90 days after 1 February
0.7 0.8 0.9 1.0 sig_a/sig_f 0.7 0.8 0.9 1.0 UT BT BTS
L1
L2
Fig. 1. Time series of winter salinity relative errors for the whole Mediterranean Sea with
univariate temperature assimilation (UT), bivariate temperature assimilation (BT) and bivariate temperature and salinity assimilation (BTS).
OSD
3, 127–163, 2006 TS sampling strategy assessment in the Mediterranean Sea F. Raicich Title Page Abstract Introduction Conclusions References Tables Figures J I J I Back Close Full Screen / EscPrinter-friendly Version Interactive Discussion
EGU
0 10 20 30 40 50 60 70 days after 1 February 0.7 0.8 0.9 1.0 sig_a/sig_f EOF(observations) EOF(model) 0.7 0.8 0.9 1.0
L1
L2
Fig. 2. Time series of winter salinity relative errors with bivariate temperature and salinity
OSD
3, 127–163, 2006 TS sampling strategy assessment in the Mediterranean Sea F. Raicich Title Page Abstract Introduction Conclusions References Tables Figures J I J I Back Close Full Screen / EscPrinter-friendly Version Interactive Discussion EGU
2a
2b
3
4
5b
5a
1
7a
7b
6
8
OSD
3, 127–163, 2006 TS sampling strategy assessment in the Mediterranean Sea F. Raicich Title Page Abstract Introduction Conclusions References Tables Figures J I J I Back Close Full Screen / EscPrinter-friendly Version Interactive Discussion EGU
W1
E2
E1
Fig. 4. The M3A network. Black circles represent buoys active in MFSTEP, white circles
OSD
3, 127–163, 2006 TS sampling strategy assessment in the Mediterranean Sea F. Raicich Title Page Abstract Introduction Conclusions References Tables Figures J I J I Back Close Full Screen / EscPrinter-friendly Version Interactive Discussion EGU 1 2 3 4 5 6 7 8 9 10
Fig. 5. Weekly spatial distributions of profiles collected along VOS tracks and from other ships
(black dots) and from ARGO floats (white diamonds) in the Mediterranean Sea from 1 Septem-ber to 9 NovemSeptem-ber 2004. The week numSeptem-ber is shown in the top left corner of each panel.
OSD
3, 127–163, 2006 TS sampling strategy assessment in the Mediterranean Sea F. Raicich Title Page Abstract Introduction Conclusions References Tables Figures J I J I Back Close Full Screen / EscPrinter-friendly Version Interactive Discussion EGU 1 2 3 4 5 6 7 8 9 10
OSD
3, 127–163, 2006 TS sampling strategy assessment in the Mediterranean Sea F. Raicich Title Page Abstract Introduction Conclusions References Tables Figures J I J I Back Close Full Screen / EscPrinter-friendly Version Interactive Discussion EGU
14 15 16 17 18
long E
35
36
37
38
39
lat N
14 15 16 17 18
a
b
Fig. 7. Spatial distributions of Glider profiles in the periods 1 September–9 November 2004 (a)
OSD
3, 127–163, 2006 TS sampling strategy assessment in the Mediterranean Sea F. Raicich Title Page Abstract Introduction Conclusions References Tables Figures J I J I Back Close Full Screen / EscPrinter-friendly Version Interactive Discussion
EGU
0 10 20 30 40 50 60 70 days from 1 September 0.7 0.8 0.9 1.0 IdVOS IdVOS−2 IdVOS−3 IdVOS−4 0.7 0.8 0.9 1.0 sig_a/sig_f 0.7 0.8 0.9 1.0 0 10 20 30 40 50 60 70 days from 1 September
IdVOS−6 IdVOS−7 IdVOS−8 IdVOS IdVOS−1 IdVOS−5 L1 L2 L3 a) L2 L1 b) L3
Fig. 8. Time series of relative errors in the summer OSSEs for idealized samplings of VOS
data: (a) West Mediterranean salinity, (b) East Mediterranean temperature. L1 indicates the
OSD
3, 127–163, 2006 TS sampling strategy assessment in the Mediterranean Sea F. Raicich Title Page Abstract Introduction Conclusions References Tables Figures J I J I Back Close Full Screen / EscPrinter-friendly Version Interactive Discussion
EGU
0 10 20 30 40 50 60 70 days from 1 February 0.7 0.8 0.9 1.0 IdVOS IdVOS−2 IdVOS−3 IdVOS−4 0.7 0.8 0.9 1.0 sig_a/sig_f 0.7 0.8 0.9 1.0 0 10 20 30 40 50 60 70 days from 1 February
IdVOS IdVOS−1 IdVOS−5 IdVOS−6 IdVOS−7 IdVOS−8 L1 L2 L3 L3 L2 L1 a) b)
Fig. 9. Time series of relative errors in the winter OSSEs for idealized samplings of VOS data: (a) West Mediterranean salinity, (b) East Mediterranean temperature. L1 indicates the surface
OSD
3, 127–163, 2006 TS sampling strategy assessment in the Mediterranean Sea F. Raicich Title Page Abstract Introduction Conclusions References Tables Figures J I J I Back Close Full Screen / EscPrinter-friendly Version Interactive Discussion
EGU
Fig. 10. Differences between the initial conditions of the assimilation and the control runs: (a)
OSD
3, 127–163, 2006 TS sampling strategy assessment in the Mediterranean Sea F. Raicich Title Page Abstract Introduction Conclusions References Tables Figures J I J I Back Close Full Screen / EscPrinter-friendly Version Interactive Discussion
EGU
0 10 20 30 40 50 60 70
days after 1 February 0.7 0.8 0.9 1.0 sig_a/sig_f 0.7 0.8 0.9 1.0 IdVOS IdVOSM3A IdM3A
a
b
Fig. 11. Time series of relative errors for the East Mediterranean in the winter OSSEs involving
OSD
3, 127–163, 2006 TS sampling strategy assessment in the Mediterranean Sea F. Raicich Title Page Abstract Introduction Conclusions References Tables Figures J I J I Back Close Full Screen / EscPrinter-friendly Version Interactive Discussion
EGU
0 10 20 30 40 50 60 70 days from 1 September 0.7 0.8 0.9 1.0 VtARGO Vt ARGO VtsARGO Vts 0.7 0.8 0.9 1.0 sig_a/sig_f 0.7 0.8 0.9 1.0 0 10 20 30 40 50 60 70 days from 1 September
VtARGO Vt ARGO VtsARGO Vts L1 L2 L3 a) b) L1 L2 L3
Fig. 12. Time series of temperature (a) and salinity (b) relative errors for the West
Mediter-ranean in the summer OSSEs for real sampling strategies. L1 indicates the surface layer, L2 the intermediate layer and L3 the deep layer.
OSD
3, 127–163, 2006 TS sampling strategy assessment in the Mediterranean Sea F. Raicich Title Page Abstract Introduction Conclusions References Tables Figures J I J I Back Close Full Screen / EscPrinter-friendly Version Interactive Discussion
EGU
0 10 20 30 40 50 60 70 days from 1 February 0.7 0.8 0.9 1.0 VtARGO Vt ARGO VtsARGO Vts 0.7 0.8 0.9 1.0 sig_a/sig_f 0.7 0.8 0.9 1.0 0 10 20 30 40 50 60 70 days from 1 February
VtARGO Vt ARGO VtsARGO Vts L1 L2 L3 L1 L2 L3 a) b)
Fig. 13. Time series of temperature (a) and salinity (b) relative errors for the East
Mediter-ranean in the winter OSSEs for real sampling strategies. L1 indicates the surface layer, L2 the intermediate layer and L3 the deep layer.
OSD
3, 127–163, 2006 TS sampling strategy assessment in the Mediterranean Sea F. Raicich Title Page Abstract Introduction Conclusions References Tables Figures J I J I Back Close Full Screen / EscPrinter-friendly Version Interactive Discussion
EGU
Fig. 14. Maps of corrections at 5 m depth after the first assimilation cycle (day 7) with sampling
strategy VtARGO. Left panels: temperature (6◦C) in summer(a) and winter (b). Right panels: