HAL Id: hal-00296119
https://hal.archives-ouvertes.fr/hal-00296119
Submitted on 23 Jan 2007
HAL is a multi-disciplinary open access
archive for the deposit and dissemination of
sci-entific research documents, whether they are
pub-lished or not. The documents may come from
teaching and research institutions in France or
abroad, or from public or private research centers.
L’archive ouverte pluridisciplinaire HAL, est
destinée au dépôt et à la diffusion de documents
scientifiques de niveau recherche, publiés ou non,
émanant des établissements d’enseignement et de
recherche français ou étrangers, des laboratoires
publics ou privés.
Italy
A. Hamed, J. Joutsensaari, S. Mikkonen, L. Sogacheva, M. Dal Maso, M.
Kulmala, F. Cavalli, S. Fuzzi, M. C. Facchini, S. Decesari, et al.
To cite this version:
A. Hamed, J. Joutsensaari, S. Mikkonen, L. Sogacheva, M. Dal Maso, et al.. Nucleation and growth of
new particles in Po Valley, Italy. Atmospheric Chemistry and Physics, European Geosciences Union,
2007, 7 (2), pp.355-376. �hal-00296119�
www.atmos-chem-phys.net/7/355/2007/ © Author(s) 2007. This work is licensed under a Creative Commons License.
Chemistry
and Physics
Nucleation and growth of new particles in Po Valley, Italy
A. Hamed1, J. Joutsensaari2, S. Mikkonen1, L. Sogacheva3, M. Dal Maso3, M. Kulmala3, F. Cavalli4, S. Fuzzi4, M. C. Facchini4, S. Decesari4, M. Mircea4, K. E. J. Lehtinen5, and A. Laaksonen1,6
1Department of Physics, University of Kuopio, P.O. Box 1627, 70211 Kuopio, Finland
2Department of Environmental Sciences, University of Kuopio, P.O. Box 1627, 70211 Kuopio, Finland
3Division of Atmospheric Sciences, Department of Physical Sciences, P.O. Box 64, 00014,University of Helsinki, Finland 4Inst. di Scienze dell’Atmosfera e del Clima – CNR, Italy Via Gobetti 101, 40 129 Bologna, Italy
5Finnish Meteorological Institute, Kuopio Unit, P.O. Box 1627, 70210 Kuopio, Finland 6Finnish Meteorological Institute, P.O. Box 503, 00101 Helsinki, Finland
Received: 12 July 2006 – Published in Atmos. Chem. Phys. Discuss.: 5 October 2006 Revised: 13 December 2006 – Accepted: 12 January 2007 – Published: 23 January 2007
Abstract. Aerosol number distribution measurements are reported at San Pietro Capofiume (SPC) station (44◦39′N, 11◦37′E) for the time period 2002–2005. The station is lo-cated in Po Valley, the largest industrial, trading and agri-cultural area in Italy with a high population density. New particle formation was studied based on observations of the particle size distribution, meteorological and gas phase pa-rameters. The nucleation events were classified according to the event clarity based on the particle number concentrations, and the particle formation and growth rates. Out of a total of 769 operational days from 2002 to 2005 clear events were de-tected on 36% of the days whilst 33% are clearly non-event days. The event frequency was high during spring and sum-mer months with maximum values in May and July, whereas lower frequency was observed in winter and autumn months. The average particle formation and growth rates were esti-mated as ∼6 cm−3s−1 and ∼7 nm h−1, respectively. Such high growth and formation rates are typical for polluted ar-eas. Temperature, wind speed, solar radiation, SO2 and O3 concentrations were on average higher on nucleation days than on non-event days, whereas relative and absolute hu-midity and NO2concentration were lower; however, seasonal differences were observed. Backtrajectory analysis suggests that during majority of nucleation event days, the air masses originate from northern to eastern directions. We also study previously developed nucleation event correlations with en-vironmental variables and show that they predict Po Valley nucleation events with variable success.
Correspondence to: A. Hamed (Amar.Hamed@uku.fi)
1 Introduction
The formation and growth of atmospheric aerosols has re-cently received increasing attention as a potentially impor-tant source of aerosol particles affecting climate and human health (e.g. Charlson et al., 1987; Donaldson et al., 1998; Penner et al., 2004; Kovats and Haines, 2005; Davidson et al., 2005). The freshly formed aerosols become climatically important only if they are able to grow to sizes of 50 nm and larger. Particles in this size range can act as cloud con-densation nuclei, and therefore they may contribute to the indirect aerosol cooling effect of the climate (e.g. Twomey, 1974; Pirjola et al., 2002; Laaksonen et al., 2005; Kaufman et al., 2006). Furthermore, if the particles grow to sizes above 100 nm, they scatter light very efficiently, and have thereby a direct cooling effect on the climate (Coakley, 2005).
Until recently, particle nucleation was assumed to be lim-ited to clean areas of the atmosphere where it has been observed frequently; for example, nucleation events have been observed in continental locations such as boreal forests (M¨akel¨a et al., 1997; Kulmala et al., 1998, Dal Maso et. al., 2005), the Arctic and Antarctic regions (e.g. Wiedensohler et al., 1996), and remote areas (e.g. Weber et al., 1997), as well as in a coastal background site in west coast of Ireland (O’Dowd et al., 1998; O’Dowd et al., 2002). Particle nu-cleation has been expected to be less favoured in the urban atmosphere than in the rural atmosphere due to a higher densation sink formed by pre-existing particles, causing con-densation of non-volatile species onto existing particles to be more favourable than particle formation by homogeneous nucleation (M¨onkk¨onen et al., 2005). However, a number of recent studies conducted in urban atmospheres show that nu-cleation events occur frequently also in urban and polluted areas.
SPC
Milan Bologna Venice RavennaSPC
Milan Bologna Venice RavennaFig. 1. Map of northern Italy, the long arrow points to the San Pietro Capofiume (SPC) station. Yellow to red colours indicate increasing
population density (white – brown: not populated mountaintops). Short term measurements have been conducted for study-ing nucleation in polluted areas durstudy-ing some campaigns; e.g. in Mexico City (Dunn et al., 2004), in lower Fraser Val-ley (Mozurkewich et al., 2004), in eastern England (Harri-son et al., 2000), in Athens, Greece, Marseille, France and New Delhi, India (Kulmala et al., 2005), in Milan, Italy (Bal-tensperger et al., 2002) and in Atlanta, Georgia (McMurry et al., 2005). These measurements have mainly been short term but also longer data series have been recorded in urban loca-tions, including Atlanta, Georgia for 13 months (Woo et al., 2001), Birmingham, UK for one year (Alam et al., 2003), St. Louis, Missouri for one year (Shi and Qian, 2003), Pitts-burgh, Pennsylvania for about one year (Stanier et al., 2004a, b), Beijing, China for one year (Wu et al., 2007) and Fresno Supersite, Central California, for almost two years (Watson et al., 2006).
Long term data series from rural continental sites include an eight year series from Hyyti¨al¨a, Finland (Dal Maso et al., 2005), a 1.5 year series from Melpitz, Germany (a rather pol-luted area) (Birmili and Wiedensohler, 2000) and 2.5 year se-ries from Hohenpeissenberg, Germany (rural area) (Birmili et al., 2003) and a 1.5 year series from Lombardy region in northern edge of Po Valley, Italy (Rodriguez et al., 2005).
It is evident that nucleation events occur frequently in the atmosphere in both clean and polluted environments. It is not, however, yet possible to predict, a priori, rates at which particles are formed and grow, or even to know with certainty which chemical species are involved (Kulmala et al., 2004). Therefore, nucleation remains an active area of scientific re-search and better understanding of the processes that govern the formation and growth of new particles has certainly be-come important.
Recently, we have analyzed a two-year data set of parti-cle size distribution measurements conducted at San Pietro Capofiume (SPC) station in the Po Valley area, Italy (Laak-sonen et al., 2005) focusing on cloud condensation nuclei (CCN) formation following the events. The results show that the nucleation events occur frequently with rapid growth in SPC suggesting that they can be an important source of CCN even in a polluted environment with strong primary particle emissions. In this paper, we report results for three-year (24 March 2002–23 March 2005) observations of new particle formation at the SPC station. The nucleation events observed at the SPC station are described in more detail. We anal-yse the measured particle size distributions, study the fea-tures of particle formation and growth, and present nucle-ation event statistics. The gas phase concentrnucle-ations and me-teorological conditions associated with nucleation are also discussed. Moreover, the source and transport pathways of the air masses arriving to SPC station during our measur-ing period were also investigated by usmeasur-ing back trajectories analysis. This work was part of QUEST (Quantification of Aerosol Nucleation in the European Boundary Layer) project funded by the European Commission.
2 Site description and instrumentation 2.1 Study area
Particle size distribution measurements in diameter range from 3 to 600 nm were started at the San Pietro Capofi-ume (SPC) measurement station (44◦39′N, 11◦37′E) on 24 March 2002. The station is located about 30 km northeast
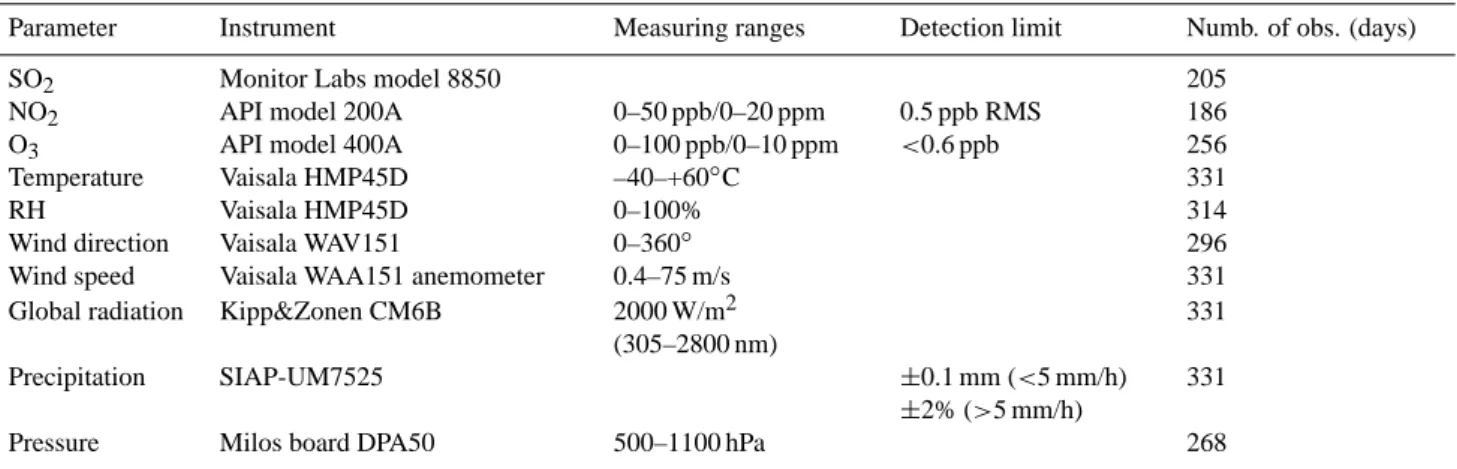
Table 1. Summary of measured gas and meteorological parameters, instruments, measuring ranges and detection limits together with the
number of days of observations.
Parameter Instrument Measuring ranges Detection limit Numb. of obs. (days)
SO2 Monitor Labs model 8850 205
NO2 API model 200A 0–50 ppb/0–20 ppm 0.5 ppb RMS 186
O3 API model 400A 0–100 ppb/0–10 ppm <0.6 ppb 256
Temperature Vaisala HMP45D –40–+60◦C 331
RH Vaisala HMP45D 0–100% 314
Wind direction Vaisala WAV151 0–360◦ 296
Wind speed Vaisala WAA151 anemometer 0.4–75 m/s 331
Global radiation Kipp&Zonen CM6B 2000 W/m2
(305–2800 nm)
331
Precipitation SIAP-UM7525 ±0.1 mm (<5 mm/h)
±2% (>5 mm/h)
331
Pressure Milos board DPA50 500–1100 hPa 268
from the city of Bologna, in the Po Valley, the largest in-dustrial, trading and agricultural area in Italy with a high population density. The station itself is in a sparsely inhab-ited area open to Adriatic Sea to the east side (represented in green colour in the Fig. 1), but enclosed by densely populated areas, on its southern, western and northern sides. There are power plants and industrial areas along the Po River and close to the harbours of Venice and Ravenna. In addi-tion, the northern Adriatic is also rather crowded of ships (Zanini et al., 2005), which can be important sources of SO2. High levels of pollutants are therefore reported for this region (“Provincia Bologna, Pianificazionee gestione della qualita‘ dell’aria nella provincia di Bologna, parte prima: Valutazione della qualita‘ dell’aria, 2003”, available at http: //www.provincia.bologna.it/ambiente/).
2.2 Measurements and the collected data
The particle size distribution measurements were carried out using a twin Differential Mobility Particle Sizer (DMPS) sys-tem: the first DMPS measures particle size distributions be-tween 3–20 nm and the second one bebe-tween 15–600 nm. The first DMPS consists of a 10.9 cm long Hauke-type differen-tial mobility analyzer (DMA, Winklmayr et al., 1991) and an ultrafine condensation particle counter (CPC, TSI model 3025) whereas the second DMPS consists of a 28 cm long Hauke-type DMA and a standard CPC (TSI model 3010). The first DMA is operated with aerosol and sheath flows of 1.5 and 10 l min−1, respectively, and the second one with flows of 1.0 and 6.7 l min−1. In both DMAs, the sheath and excess flows are controlled by a closed-loop flow arrange-ment with a critical orifice and dried with a silica gel dryer. The aerosol sample is taken at about 3 m above the ground and neutralized with a radioactive β-source (Ni-63) before the DMAs. Before 9 October 2002, the sample aerosol was taken without any drying and afterwards it has been dried with a Nafion drier (Permapure, MD-110-48SS). The twin
DMPS system is operated at room temperature (about 25◦C). One measurement cycle lasts for ten minutes. From the mea-sured data, particle size distributions were determined using a Tichonov regularization method with a smoothness con-straint (see Voutilainen et al., 2001). The CPC counting effi-ciency and diffusional particle losses in the tubing were taken into account in the data analysis.
In addition to particle size measurements, several gas and meteorological parameters are being measured at SPC: SO2, NO, NO2, NOx, O3, temperature, relative humidity, wind di-rection, wind speed, global radiation, precipitation, and at-mospheric pressure. Water vapour concentrations were cal-culated from relative humidity and temperature data. We utilized these parameters in our analysis of particle forma-tion and growth processes: Table 1 summarizes measured parameters, instruments, measuring ranges, detection limits together with the number of days of observations for different parameters. Gas and meteorological parameters were typ-ically measured at every hour or they were one-hour aver-ages. Gas and meteorological data was provided by ARPA Servizio Idro Meteo, Italy.
3 Results and discussion
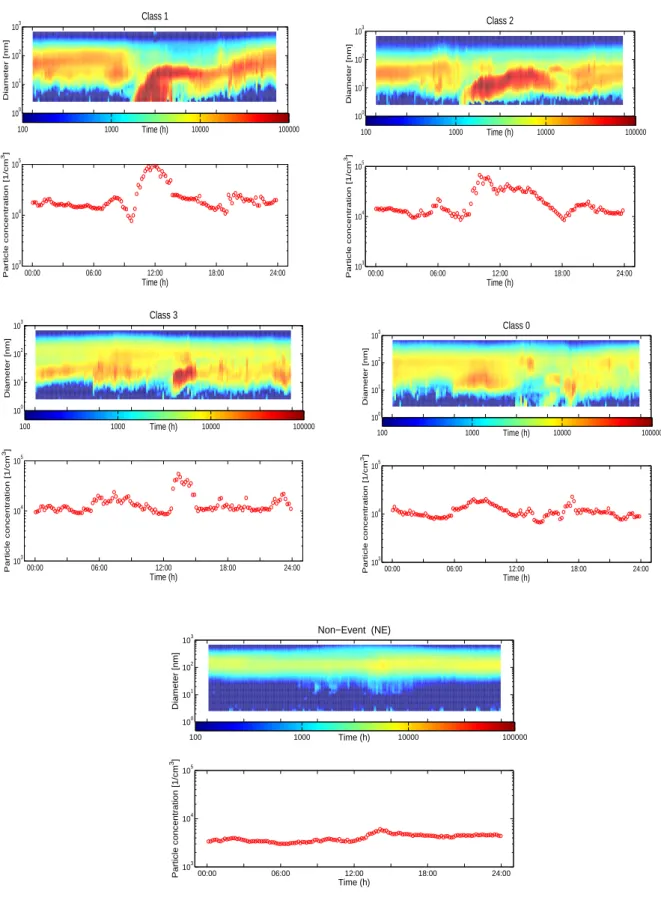
3.1 Classification of the new particle formation events For the data analysis, days are classified in different cate-gories, i.e., event and non-event days. The day is considered a nucleation event day if the formation of new aerosol par-ticles starts in the nucleation mode size range and the mode is observed over a period of several hours showing signs of growth. In practice, a new particle formation event can be seen as an increase of the particle concentrations in the small-est channels of the DMPS system. These newly formed par-ticles then experience subsequent growth that can be seen to occur typically at a rate of few nanometres per hour during
the rest of the day. If the aerosol size distribution for a given day exhibits these signs, the day can be classified as a typical new particle formation day (event day).
After selection of event days, the days are classified ac-cording to the clarity of events. Class 1 events are char-acterized by high amounts of 3–6 nm particles; with only small fluctuations of the size distribution and no or little pre-existing particles in the smallest size classes. Class 1 events show intensive and clear formation of small particles with continuous growth to large particle sizes that lasts from seven to ten hours with an average of about eight hours. Class 2 events show the same behaviour but with less clarity; for ex-ample, with larger fluctuations of the size distribution even though the formation of new particles and their consequent growth to larger particle sizes can be clearly observed. Fur-thermore, the growth lasts on average about five hours, some-what less than for class 1 events. However, in those two nu-cleation event classes, it was easy to follow the trend of the nucleation mode and observed growth; hence, the calcula-tions of formation and growth rates of newly formed particles were determined with a good confidence level.
Class 3 events include cases where there is enough evi-dence of new particle formation but one of the stages was not clearly observed. For example, on some days, the for-mation of new particles and their growth to larger particle sizes may have started for a short time but it was then inter-rupted by change in one or more parameters (e.g. drop in the intensity of solar radiation, rain). In addition, we classified in that category the formation days which were characterized by weak growth and those few cases where the growth of the new mode formation cannot be obviously shown. Classifi-cation of nucleation events is still, however, subjective and sometimes an overlapping within the classes may occur. To minimize the uncertainty of the classification method we re-ferred to class 1 and class 2 events as intensive nucleation events, where all classification stages were clearly fulfilled, whilst class 3 events are referred to as weak events.
As well as event days, also the days with no particle for-mation observed are of interest. Those days are classified as non-event (NE) days, due to the absence of particles in nucle-ation mode size range. However, a large number of days did not fulfill the criteria to be classified either event or NE; these undefined days were classified as class 0. In that class, it was difficult to determine whether a nucleation event has actually taken place or not. The classification method of nucleation events we used here is based on the methods described by M¨akel¨a et al. (2000) and Dal Maso et al. (2005). Figure 2 gives examples of new particle formation and their classifi-cations. In the resulting analysis and due to the subjectiv-ity of the event classifications, as we described above, clear nucleation events and non-events were only taken into con-sideration. That also gives a good opportunity to investigate the reasons leading to nucleation events when compared with non-events days.
3.2 Nucleation events
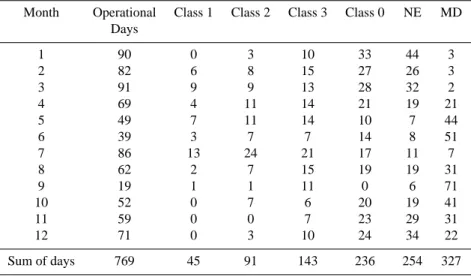
We have analyzed 3 years of data obtained until 23 March 2005. During this period, the DMPS instrument was opera-tional on 769 days. This amounts to about 70% of all days during the 3 years of measurements, and during the rest of the days the data is either completely missing or of bad qual-ity. From those operational days, the data includes 279 nu-cleation event days (meaning that about 36% of the data are event days) and 254 non-event days (33% of the data), while 31% are such that an event may or may not have taken place. Table 2 summarizes the number of nucleation event days (class 1, 2 and 3 events), class 0, Non-Event days (NE) and Missing Data (MD) throughout the 3 years measurements at the SPC station.
We can see from the table that the DMPS instrument mal-functioned during some months, especially during autumn months. Thus, September months are left out of nucleation event frequency analysis since there are only a few data points for these months throughout the whole period (19 out of 90 days ∼21%). For the other autumn months, October and November, the ratios were about 56% and 66% respec-tively and thus we retain them in our present analysis.
Figure 3 illustrates the monthly frequency of nucleation events in different classes. The maximum event frequency occurs during May–July, being over 60% of all days for May and July and over 40% for June. A large number of inten-sive nucleation events (classes 1 and 2) can be noticed dur-ing those months (about 30% of all days). Durdur-ing late winter and spring (February–April), the frequency of event days is quite high at about 35 % of all days whereas it is clearly lower during autumn (October–November). The minimum of the event frequency occurs in December–January but even then it is about 15%, i.e., on average there is more than one event per week. Furthermore, no class 1 events have been ob-served during October–January. In general, the results show that nucleation events take place throughout the whole year and the overall frequency of nucleation event days (classes 1–3) is about 36% of all days. The highest frequencies for nucleation events were observed from late spring to summer, i.e. from April to August. In contrast, the monthly distribu-tion of non-event days exhibits inverse behaviour compared to nucleation event days, with maximum during winter and autumn and minimum during summer months.
A high seasonal event frequency in spring has been ob-served in different environmental locations as well; e.g. in rural central Europe, Hohenpeissenberg station, in south Ger-many (Birmili et al., 2003); at a clean area, Boreal forest site, Hyyti¨al¨a, in southern Finland (Dal Maso et al., 2005); in ur-ban areas, (Stanier et al., 2004a, b; Watson et al., 2006); in a rural polluted area, Melpitz, in east Germany (Birmili and Wiedensohler, 2000); and in a highly polluted area, Beijing, China (Wu et al., 2007).
In contrast to other sites, the winter event frequency was somewhat higher at SPC, close to 20%. Only at the
Hohen-00:00 06:00 12:00 18:00 24:00 103 104 105 Particle concentration [1/cm 3] Time (h) 00:00 06:00 12:00 18:00 24:00 100 101 102 103 Diameter [nm] Time (h) Class 1 100 1000 10000 100000 00:00 06:00 12:00 18:00 24:00 103 104 105 Particle concentration [1/cm 3] Time (h) 00:00 06:00 12:00 18:00 24:00 100 101 102 103 Diameter [nm] Time (h) Class 2 100 1000 10000 100000 00:00 06:00 12:00 18:00 24:00 103 104 105 Particle concentration [1/cm 3] Time (h) 00:00 06:00 12:00 18:00 24:00 100 101 102 103 Diameter [nm] Class 3 Time (h) 100 1000 10000 100000 00:00 06:00 12:00 18:00 24:00 103 104 105 Particle concentration [1/cm 3] Time (h) 00:00 06:00 12:00 18:00 24:00 100 101 102 103 Diameter [nm] Time (h) Class 0 100 1000 10000 100000 00:00 06:00 12:00 18:00 24:00 103 104 105 Particle concentration [1/cm 3] Time (h) 00:00 06:00 12:00 18:00 24:00 100 101 102 103 Diameter [nm] Time (h) Non−Event (NE) 100 1000 10000 100000
Table 2. Numbers of nucleation events days (Class 1, 2 and 3 events), class 0, Non-Event days (NE), and Missing Data (MD) throughout the
3 years of measurements for San Pietro Capofiume station. (Operational Days=DMPS instrument was operational). Note that the September month is not statistically reliable.
Month Operational Class 1 Class 2 Class 3 Class 0 NE MD
Days 1 90 0 3 10 33 44 3 2 82 6 8 15 27 26 3 3 91 9 9 13 28 32 2 4 69 4 11 14 21 19 21 5 49 7 11 14 10 7 44 6 39 3 7 7 14 8 51 7 86 13 24 21 17 11 7 8 62 2 7 15 19 19 31 9 19 1 1 11 0 6 71 10 52 0 7 6 20 19 41 11 59 0 0 7 23 29 31 12 71 0 3 10 24 34 22 Sum of days 769 45 91 143 236 254 327
*
Fig. 3. Monthly frequency of nucleation events at the (SPC) station.
∗Note that the September nucleation data is statistically poor (see Table 2).
peisenberg station (Birmili et al., 2003) a comparable winter event frequency (about 25%) has been observed. However, at Hohenpeissenberg, a summer minimum was observed in the event frequency (around 0.075 events per day), and there were no intensive nucleation events at all during summer which is very different to the SPC observations (see Fig. 3). Particularly, for urban area, St. Louis, Shi and Qian (2003) observed a minimum frequency around 5% during midwin-ter and the highest values of above 30% were during April and July, similar to the SPC station. On the other hand, Ro-driguez et al. (2005) observed a maximum number of event days during autumn months at the Ispra station, which is
lo-cated at a rural area in Lombardy region northern Italy. This is in contrast to the SPC station, where the event frequency was somewhat lower during autumn months. The seasonal trend of nucleation events in the northern edge of Po Valley thus seems to be different compared to the eastern part of Po Valley. The difference between SPC and Ispra is not very surprising; even if they are both rural sites in the Po Valley, similar climatology of the aerosol and trace gases can not be expected since Ispra is very close to the big Milan conur-bation, so that the breeze between the very populated and polluted plains and the Alps (Dosio et al., 2002) controls the concentrations of trace gases and aerosol and henceforth ef-fects the event frequency distribution. Such mountain breeze circulation does not affect the SPC site, which is therefore characterised by a different aerosol climatology with respect to Ispra. In general, nucleation can occur in very diverse locations, and the above differences in monthly frequency statistics of nucleation events hint that different processes are controlling the particle formation events at different environ-ments.
3.3 Total particle number concentrations (Ntot)
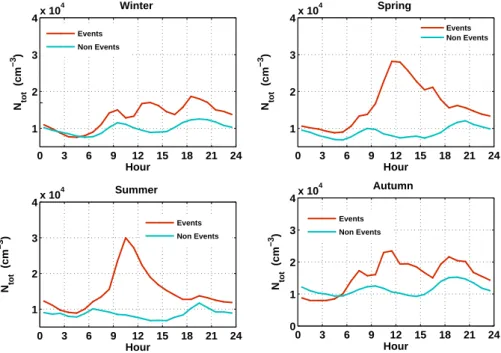
Nucleation events observed at SPC station ranged from weak events, where the total particle number concentrations (Ntot) varied between 1.5×10³ (minimum value at start of events) and 7×10⁴particles cm−3(maximum peak concen-tration during events) to intense nucleation events where the Ntotvariation was from 1.8×10³to 2.8×10⁵particles cm−3. During non-event days, the observed maximum value of Ntot was about 4×10⁴particles cm−3with a mean value of 9×10³particles cm−3. The average total particle concen-tration from all days of the study (769 days) was about
0 3 6 9 12 15 18 21 24 1 2 3 4x 10 4 Hour Ntot (cm −3 ) Winter 0 3 6 9 12 15 18 21 24 1 2 3 4x 10 4 Hour N tot (cm −3 ) Spring 0 3 6 9 12 15 18 21 24 1 2 3 4x 10 4 Hour N tot (cm −3 ) Summer 0 3 6 9 12 15 18 21 24 0 1 2 3 4x 10 4 Hour Ntot (cm −3 ) Autumn Events Non Events Events Non Events Events Non Events Events Non Events
Fig. 4. Hourly means of total particle concentration Ntot(cm−3)during events and on non-event days for different season over the whole period.
1.2×104cm−3, which is a value more typical for urban rather than rural environments. Hourly averages of the total par-ticle concentrations in different seasons for events and for non-events have distinguishable differences (see Fig. 4). As expected, Ntot is significantly higher for event days espe-cially for frequent event months, spring and summer, where the maximum values have been observed around noon to be ∼2.7×104cm−3 and ∼3×104cm−3 respectively. For winter and autumn seasons, the maximum values of Ntot during event days are slightly lower, ∼1.8×104cm−3 and
∼2.4×104cm−3, respectively. In contrast, during non-event days, Ntotwas between (0.7–1.5) ×104cm−3throughout the different seasons. Clear increases in the total particle con-centrations were observed during morning and evening rush hour. Those rush hour peaks can be also found around 9 and 19 o’clock for winter, spring and autumn seasons for non-events. During spring and summer season, the rush hour peaks cannot be clearly observed on event days due to in-tensive new particle formation.
During nucleation events, the number concentration of ul-trafine particles (3–50 nm) increases so that it always exceeds 8×10³particles cm−3around the event start time. Moreover, it takes at minimum three hours before the particle concentra-tion again decreases below this level, irrespective of season.
In Pittsburgh, the average number concentration for N(3−500) was about 2.2×104cm−3 (Stanier et al., 2004b), which was higher than the observed values in SPC while in the Melpitz station in Germany, concentrations of particles with diameters between 3–11 nm have been observed to ex-ceed 104cm−3 for over four hours and more during
nucle-ation events (Birmili and Wiedensohler, 2000). This is quite similar to SPC station. At the Ispra station in the northern edge of the Po Valley Italy, the mean value of N5−800 nm during the formation days was about ∼1×104cm−3ranging from 2×103cm−3to 2×104cm−3(Rodriguez et al., 2005). The values observed at Ispra station were slightly lower than the values observed at SPC station. The mean values of about 8.7×102cm−3and 7×102cm−3have been observed at two clean locations in northern Finland (Komppula et al., 2003; Lihavainen et al., 2003). However, the same seasonal varia-tion, with higher particle concentrations for spring and sum-mer and lower concentrations for autumn and winter have also been observed at Pallas, in north Finland (Lihavainen et al., 2003).
3.4 Nucleation event characterization
The aim of this section is to study the features associated with nucleation events such as the start and cut-off (end time) of the particle bursts above the detection limit of 3 nm, and the nucleation event duration. Furthermore, the growth rate and formation rates, together with condensation sink are also described.
3.4.1 Events start and end times
Nucleation event start and end times as well as the duration of the event are among important characteristics. However, to define starting and ending times of the nucleation events is sometimes difficult because of the fluctuation in the smallest size classes due to measurement uncertainties. Only particles
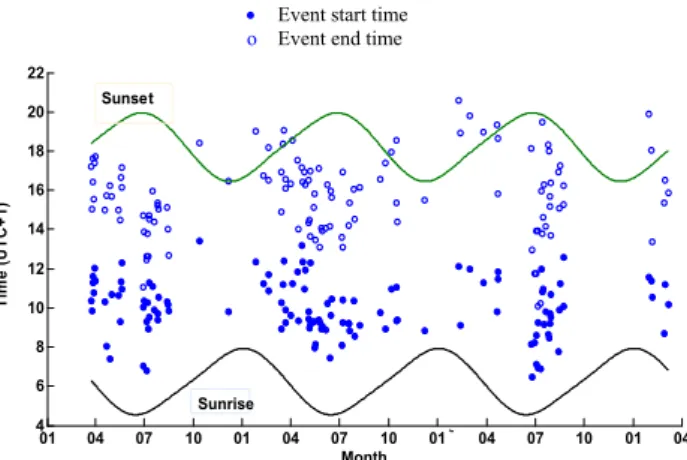
• Event start time o Event end time
01 04 07 10 01 04 07 10 01 04 07 10 01 04 4 6 8 10 12 14 16 18 20 22 Month T im e ( U T C + 1 ) Sunset Sunrise
Fig. 5. Start and end times for nucleation events together with the
sunrise and sunset curves.
larger than about 3 nm in diameter, that is the minimum de-tectable size for current aerosol instruments, can be observed (Kulmala et al., 2004). Newly formed particles (about 1 nm in diameter) need time to grow to 3 nm size and this time varies under different atmospheric situations. However, be-cause the exact growth time is not known, the observed start and the cut-off of the particle formation will be used as nu-cleation start and nunu-cleation end throughout this paper. In practice, we used a MATLAB program to determine visually the start and end times. The duration of particle formation was estimated as the time difference between the start and the end times. Figure 5 shows the obtained nucleation start and end times for all events from 2002 to 2005 together with the sunrise and sunset curves. All times are local winter times (UTC +1).
Nucleation typically starts after sunrise near midday. That feature seems common with other locations where nucle-ation has been observed (e.g. Woo et al., 2001; Birmili and Wiednsohler, 2000; Birmili et al., 2003; Boy et al., 2003; Alam et al., 2003; Mozurkewich et al., 2004; Kulmala et al., 2004). The time difference between sunrise and nucleation event start is shorter in summer compared to other seasons; however, somewhat surprisingly the duration of the new par-ticle formation was the shortest during summer as well (see Table 3). That could be due to the high afternoon tempera-tures in SPC during the summer as there might be an upper temperature limit above which nucleation is inhibited. 3.4.2 Particle formation rate and growth rate (FR and GR) Some features associated with the nucleation events were es-timated from the measured particle size distributions, such as the particle formation rate, FR (particles cm−3s−1)and particle growth rate, GR (nm h−1). For coastal nucleation events, for example, the estimations were based on short timescale variation of ultrafine particle formation, where the estimated FR was in order 103–104cm−3s−1(O’Dowd et al.,
1999). Weber et al. (1999) estimated FR by comparing data from various sites. Those estimates were based on change of the particle concentrations over the nucleation event dura-tion. In this work, we have estimated the formation rate at 3 nm from the increase of 3–20 nm particle number concen-tration between the event start time and the time when the particle concentration exhibits a maximum during the event. Weber et al. (1997) estimated the growth rate of nucleation mode from the spatial evolution of the measured particle size distribution in clean air at a continental site. They estimated the GR of nucleation mode particles from the time taken be-tween the increase in gas phase sulphuric acid concentration and the increase in 3 nm particle concentrations. The ob-served growth rates of 1–2 nm h−1 were approximately ten times faster than those calculated assuming condensational growth caused by sulphuric acid and water. In our calcu-lations, since sulphuric acid concentrations were not mea-sured, we were not able to use Weber’s method to calculate GR. Instead, we determined the growth rates visually from the DMPS data plots. The minimum growth time we used for estimation of the GR was three hours, and if the growth lasted for long enough, the GR was estimated from a period of about eight hours. Figure 6 gives an example of a typ-ical nucleation event day (class 1), where the fitted growth rate and estimated formation rate, together with start and end time of the event is shown.
In order to check the reliability of our methods, we used the procedure described by Dal Maso et al. (2005) to cal-culate the formation and growth rates for clear nucleation events for one complete year. The estimated values for GR and FR using both methods are very similar. Therefore, we did not repeat the GR and FR analysis for the remaining two years but kept to the results obtained with the method pre-sented above.
Monthly means for formation and growth rates for the three-year period of nucleation events at the SPC station are given in Table 4. Based on our calculations, the estimated mean value for FR was about 5.9 cm−3s−1. This value is comparable to typical values observed in urban areas. Over-all, the FR values varied between 0.24 and 36.89 cm−3s−1. During winter and autumn, the FR values were slightly lower than the mean value. That is in contrast to spring and summer, where the mean values were over the aver-age value in May-July with a maximum value observed in May (36.89 cm−3s−1). In general, the trend of the formation rate in different seasons was almost the same as the nucle-ation event frequency trend (see Table 4). The total num-ber concentration of new particles produced during the parti-cle formation events, on average, was 2.9×104cm−3with a maximum value of 1.33×105cm−3and a minimum value of 2.8×103cm−3.
The mean growth rate of the nucleation mode particles was ∼6.82 nm h−1. It is known that low growth rates are a clear feature for clean areas (Birmili et al., 2000; Weber et al., 1997; Dal Maso, et al., 2005); whilst high values
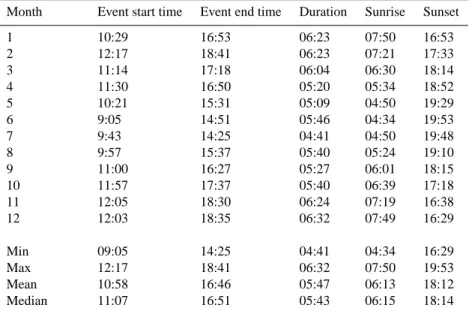
Table 3. Monthly means of event start time, event end times, event duration, Sunrise and Sunset for nucleation events from (2002–2005)
together with the Minimum (Min), Maximum (Max), Mean and Median for the whole study period. Note that the September month is not statistically reliable.
Month Event start time Event end time Duration Sunrise Sunset
1 10:29 16:53 06:23 07:50 16:53 2 12:17 18:41 06:23 07:21 17:33 3 11:14 17:18 06:04 06:30 18:14 4 11:30 16:50 05:20 05:34 18:52 5 10:21 15:31 05:09 04:50 19:29 6 9:05 14:51 05:46 04:34 19:53 7 9:43 14:25 04:41 04:50 19:48 8 9:57 15:37 05:40 05:24 19:10 9 11:00 16:27 05:27 06:01 18:15 10 11:57 17:37 05:40 06:39 17:18 11 12:05 18:30 06:24 07:19 16:38 12 12:03 18:35 06:32 07:49 16:29 Min 09:05 14:25 04:41 04:34 16:29 Max 12:17 18:41 06:32 07:50 19:53 Mean 10:58 16:46 05:47 06:13 18:12 Median 11:07 16:51 05:43 06:15 18:14 00:00 06:00 12:00 18:00 24:00 100 101 102 103 Time (h) D P (nm) 0 2 4 6 8 10 12x 10 4 Time (h) N tot (cm −3 )
Fig. 6. Typical nucleation day (class 1 event on 25 March 2002). The thin blue and green vertical lines show the start and end of the particle
bursts above the detection limit of 3 nm. The thin white line is the fitted curve for the growth of the nucleation mode. On this day, the estimated formation rate (FR) was 12.9 cm−3s−1and growth rate (GR) was 8.8 nm h−1. The lower plot shows total particle concentration (Ntot)for the same day.
have been reported for more polluted areas (e.g. Kulmala et al., 2005; Birmili and Wiedensohler, 2000; Verheggen and Mozurkewich, 2002; Birmili et al., 2003). The high value of the growth rate in SPC station might possibly be due to the large degree of pollution. Since the evolution of the nu-cleation mode size distribution results from competition be-tween growth and scavenging onto background aerosols, fast growth is needed for particle formation; otherwise, nucleated
particles would be scavenged before growing into measur-able size range above 3 nm.
The estimated GR values were relatively high throughout the whole period, with the maximum GR observed in May (22.9 nm h−1)and minimum in February (2.9 nm h−1). Dur-ing winter and autumn, the monthly mean GR values were lower than the total mean value (2002–2005) whilst during spring and summer they were higher than the total mean
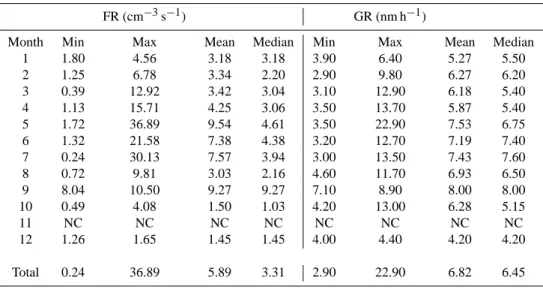
Table 4. Monthly Minimum (Min), Maximum (Max), Means and Median of formation rate FR (cm−3s−1)and growth rate GR (nm h−1) calculated for nucleation events from (2002–2005). (NC means no intensive nucleation events have been observed in that month.)
FR (cm−3s−1) GR (nm h−1)
Month Min Max Mean Median Min Max Mean Median
1 1.80 4.56 3.18 3.18 3.90 6.40 5.27 5.50 2 1.25 6.78 3.34 2.20 2.90 9.80 6.27 6.20 3 0.39 12.92 3.42 3.04 3.10 12.90 6.18 5.40 4 1.13 15.71 4.25 3.06 3.50 13.70 5.87 5.40 5 1.72 36.89 9.54 4.61 3.50 22.90 7.53 6.75 6 1.32 21.58 7.38 4.38 3.20 12.70 7.19 7.40 7 0.24 30.13 7.57 3.94 3.00 13.50 7.43 7.60 8 0.72 9.81 3.03 2.16 4.60 11.70 6.93 6.50 9 8.04 10.50 9.27 9.27 7.10 8.90 8.00 8.00 10 0.49 4.08 1.50 1.03 4.20 13.00 6.28 5.15 11 NC NC NC NC NC NC NC NC 12 1.26 1.65 1.45 1.45 4.00 4.40 4.20 4.20 Total 0.24 36.89 5.89 3.31 2.90 22.90 6.82 6.45
value (see Table 4). The identification of the condensing species behind the large observed growth remains uncertain. Weber et al. (1997) concluded that while nucleation might depend upon sulphuric acid and water, particle growth rates required another, probably organic component.
3.4.3 Condensation Sink (CS)
The aerosol condensation sink (CS) determines how rapidly molecules will condense onto pre-existing aerosols and de-pends strongly on the size distribution (Kulmala et al., 2005). To quantify condensation processes during new particle for-mation, we calculated the condensation sink by using the method described by Pirjola et al. (1998) and Kulmala et al. (2001). In practice, the vapour was assumed to have very low vapour pressure at the surface of the particle, and molec-ular properties were assumed similar to those of sulphuric acid.
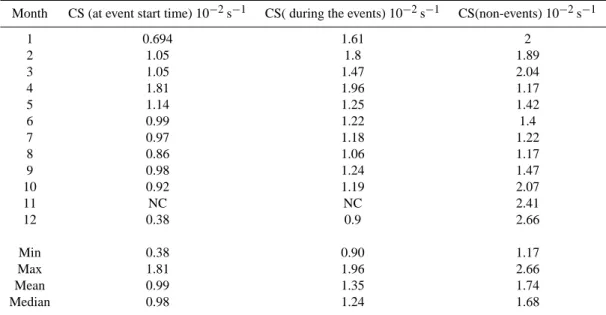
According to our calculations (Table 5), the condensation sink values are lower on event days than on non-event days. Low condensation sink values have been found favor to nu-cleation also in Hyyti¨al¨a, Finland (Kulmala et al., 2005).
Significant differences were observed between the CS val-ues at event start time and during the events especially for winter months where the values of CS during the events were often more than two times the values at event start. In the months of frequent events, those differences were much smaller. The lowest CS values at the event start time oc-cur in December and January, which can be explained by the fact that the main feature of the SPC fall-winter weather is the occurrence of persistent fogs and low-level stratus clouds under high-pressure conditions. They are dissipated by the passage of fronts (usually occluded fronts with pressure
min-imum in the Ligurian sea) bringing precipitation, especially in fall, or by strong dry easterlies (“bora” winds) which bring little precipitation (usually snow on the Apennines). In both cases, a partial replacement of the air masses takes place in the lower troposphere and dry air from the free troposphere can be advected to the lower levels. Due to horizontal and vertical mixing, the PM concentration decreases markedly at the ground, and so does the condensation sink. This provides an explanation why the fall-winter nucleation events in clear sky days are associated with dry air intrusions (i.e., are not only characterised by low relative humidity but also by low specific humidity). This will be explained below in more de-tail.
During intensive nucleation events that occur frequently in the summer and spring months, the CS values tend to be slightly higher than during winter and autumn events. How-ever, no significant differences in CS values at event start and during the event were observed during summer and spring months (see Table 5).
3.5 Discussion of different parameters
The aim of this section is to investigate the trend and cor-relations between different parameters (meteorological and gas phase concentrations) and new particle formation. Fur-thermore, comparisons between intensive event days (class 1 and class 2) and non-event days for different seasons of the year are presented. Particularly, we are interested in finding out what are favourable conditions for the new particle for-mation events.
Table 5. Monthly variations of condensation sink CS (s−1)at event start time, during the event and for non-events together with the Minimum (Min), Maximum (Max), Mean and Median for the whole study period. (NC means no intensive nucleation events have been observed in that month.)
Month CS (at event start time) 10−2s−1 CS( during the events) 10−2s−1 CS(non-events) 10−2s−1
1 0.694 1.61 2 2 1.05 1.8 1.89 3 1.05 1.47 2.04 4 1.81 1.96 1.17 5 1.14 1.25 1.42 6 0.99 1.22 1.4 7 0.97 1.18 1.22 8 0.86 1.06 1.17 9 0.98 1.24 1.47 10 0.92 1.19 2.07 11 NC NC 2.41 12 0.38 0.9 2.66 Min 0.38 0.90 1.17 Max 1.81 1.96 2.66 Mean 0.99 1.35 1.74 Median 0.98 1.24 1.68
3.5.1 Effect of meteorological parameters on new particle formation
To study the relationship between nucleation events and numerous meteorological parameters, we have analysed a three-year set of meteorological data for the SPC station. The meteorological parameters considered here are shown in Ta-ble 1.
The hourly mean temperature (Fig. 7a) was higher on event days than on non-event days, except for the summer months. The daily variation between nighttime minimum and daytime maximum temperature is larger on event days during all seasons. During winter, spring and autumn sea-sons, the noontime event temperature is higher than non-event temperature, which reflects the fact that nucleation oc-curs mostly during clear sky conditions. Somewhat surpris-ingly, the noontime event and non-event temperatures are similar in the summer; however, the nighttime event temper-atures are lower than non-event day tempertemper-atures. The ob-served diurnal temperature behaviour is quite different from clean areas, as observed at different locations in Finland (Boy and Kulmala, 2002; Komppula et al., 2003; Vehkam¨aki et al., 2004), where it was found that the average temperatures for event days were colder than for non-events days. Contrarily, higher temperatures have been associated with the nucleation events in east and south Germany (Birmili and Wiednsohler, 2000; Birmili et al., 2003), and in Atlanta (Woo et al., 2001). At the moment, we have no explanation for the apparent op-posite effect of temperature on nucleation in different envi-ronments.
The relative humidity was lower, on average, on event days than on non-event days. For winter, spring and autumn sea-sons remarkable differences between event days and non-event days was observed, but again the smallest difference was observed during summer (Fig. 7b). Low relative humid-ity, frequently down to 50% (towards the middle of the day), was observed during nucleation events for all seasons. Sim-ilar behaviour was observed in north Italy (Rodriguez et al., 2005), in the polluted continental boundary layer (Birmili and Wiednsohler, 2000), in rural area (Birmili et al., 2003) and also in clean areas, for example in different stations in Finland, Hyyti¨al¨a station (Boy and Kulmala, 2002), Pallas station, in sub arctic area in northern Finland (Komppula et al., 2003) and in V¨arri¨o in Finnish Lapland (Vehkam¨aki et al., 2004). This is a strong indication that the particle for-mation is negatively correlated with relative humidity. This could be explained by the fact that relative humidity is higher on cloudy days with less solar radiation to produce OH rad-icals and further condensable vapours and/or that the high humidity causes the pre-existing aerosols and thereby the CS to grow so that more surface area is available for vapour con-densation.
Water vapour concentrations (Fig. 7c) were lower during event days than in NE days, which shows that water vapour concentration was anti-correlated with particle formation, as has also been observed in Hyyti¨al¨a (Boy and Kulmala, 2002) and in V¨arri¨o (Vehkam¨aki et al, 2004). Bonn and Moortgat (2002) have suggested that water vapour inhibits ozonolysis reactions producing condensable organic species involved in nucleation events.
(a) 0 3 6 9 12 15 18 21 24 −2 0 2 4 6 8 Hour T(°C) Winter 0 3 6 9 12 15 18 21 24 5 10 15 20 Hour T(°C) Spring 0 3 6 9 12 15 18 21 24 5 15 25 Hour T(°C) Summer 0 3 6 9 12 15 18 21 24 5 10 15 20 Hour T(°C) Autumn Events Non Events Events Non Events Events Non Events Events Non Events (b) 0 3 6 9 12 15 18 21 24 40 60 80 100 Hour RH% Winter 0 3 6 9 12 15 18 21 24 40 60 80 100 Hour RH% Spring 0 3 6 9 12 15 18 21 24 40 60 80 100 Hour RH% Summer 0 3 6 9 12 15 18 21 24 40 60 80 100 Hour RH% Autumn Events Non Events Events Non Events Events Non Events Events Non Events
Fig. 7. Hourly means of (a) temperature T (◦C), (b) Relative Humidity RH (%), (c) Water vapour concentration (Molecules m−3)and (d) Global radiation (W m−2)on event and on non-event days for different seasons.
Global solar radiation (Fig. 7d) was on average higher on event days than on non-event days. This suggests that nearly all nucleation events occur on sunny cloudless days. As ex-pected, the maximum solar radiation at noon was higher on event days than on NE days in winter, spring and autumn seasons, with clear difference approximately of 50%, while slightly smaller difference has been observed during summer months. Finding higher solar radiation during event days than non-event days has been the main feature found in all long term nucleation studies, from clean areas in Finland (Boy and Kulmala, 2002; Komppula et al., 2003; M¨akel¨a et al., 1997; Kulmala et al., 1998; Vehkam¨aki et al., 2004; V¨akev¨a et al., 2000) to industrial agriculture regions in Ger-many (Birmili and Wiednsohler, 2000; Birmili et al., 2003), Birmingham, UK (Alam et al., 2003), Pittsburgh, Pennsyl-vania (Stanier et al., 2004), urban Atlanta (Woo et al., 2001) and rural environment in north Italy (Rodriguez et al., 2005). This clearly shows that photochemistry most probably due to formation of the hydroxyl radical (Harrison et al., 2000)
produces the nucleating and/or condensing species involved in new particle formation.
Atmospheric pressure values are on average higher on event days. This is no surprise as low pressure systems are often associated with precipitation, which prevents particle nucleation.
Precipitation, as expected, was found to be higher during non-event days than during event days: the value was on av-erage about 0.05 mm during event days and twice as high, about 0.1 mm, for non-event days. This clearly supports the notion of clear sky conditions and the important role of solar radiation in particle formation processes.
Wind speed (Fig. 8) was, on average, higher on event days than on non-event days. In winter and autumn, the observed average midday wind speed values (5 m s−1and 4 m s−1, re-spectively) were clearly higher than the total mean value (∼2.3 m s−1), and there is a remarkable difference between event days and non-event days. On the other hand, during spring and summer, the average midday wind speed values
(c) 0 3 6 9 12 15 18 21 24 1 1.2 1.4 1.6 1.8 2x 10 23 Hour
Water Vapor Concentration
(Molcecules/m 3) Winter 0 3 6 9 12 15 18 21 24 2.4 2.6 2.8 3 3.2x 10 23 Hour
Water Vapor Concentratio
n (Molcecules/m 3) Spring 0 3 6 9 12 15 18 21 24 4 4.5 5 5.5 6x 10 23 Hour
Water Vapor Concentration
(Molcecules/m 3) Summer 0 3 6 9 12 15 18 21 24 2 2.5 3 3.5x 10 23 Hour
Water Vapor Concentration
(Molcecules/m 3) Autumn Events Non Events Events Non Events Events Non Events Events Non Events (d) 0 3 6 9 12 15 18 21 24 0 500 1000 Hour Global Radiation (W/m 2) Winter 0 3 6 9 12 15 18 21 24 0 500 1000 Hour Global Radiation (W/m 2) Spring 0 3 6 9 12 15 18 21 24 0 500 1000 Hour Global Radiation (W/m 2) Summer 0 3 6 9 12 15 18 21 24 0 500 1000 Hour Global Radiation (W/m 2 ) Autumn Events Non Events Events Non Events Events Non Events Events Non Events Fig. 7. Continued.
were about the same as the total mean value and got higher around 18:00 to reach value of 3 m s−1. In addition, the event and non-event day wind speeds show very little difference in spring and summer. The correlation between event frequency and wintertime high wind speeds can be explained by the fact that strong winds promote mixing and breaking of the stable stratification which is responsible for large CS values in the cold season. Higher event day wind speeds were observed also at Ispra station, north Italy, where nucleation events have been associated with North-F¨ohn meteorology when relative warm and dry down slope wind from the Alps flows over the area (Rodriguez et al., 2005). In contrast, for different mea-surements stations in Finland, wind speed showed no differ-ence between event and non-event days (Komppula et al., 2003; Lihavainen et al., 2003; Boy and Kulmala, 2002).
Figure 9 illustrates the local wind direction distribution for event and non-event days in different seasons. A clear differ-ence can be observed in wind direction between event and non-event days. During event days, the wind was mainly from eastern direction (from southeast to northeast, passing
by east and north directions) while west to northwest direc-tions were more frequent on non-event days. This may have to do with the fact that the lower values of CS are associated with the east to northeastern directions (Fig. 10). Typically, the aerosol concentrations in the Po Valley exhibit a gradient of decreasing concentrations from the Milan. Apparently, as it can be seen from the map shown in Fig. 1, the network of big and small cities in the valley (in bright red in the map) can be considered hot spots for the NO2concentrations. Longer living species, such as aerosol, have apparently a more ho-mogeneous horizontal distribution, but with a gradient of de-creasing concentrations from the Milan area towards the sea (Chu et al., 2003). In Emilia Romagna, the region of Bologna and SPC, extending between the boundary with Lombardy (50 km south east to Milan) and the Adriatic Sea, the aver-age PM10concentrations are higher in the mainland than in the coastal zone (see Fig. 11). This gradient is more pro-nounced when the wind is from the east (generally because of a pressure minimum in the mid- southern Adriatic, or in the Ionian Sea). Conversely, when the wind is from the
west-0 3 6 9 12 15 18 21 24 0 1 2 3 4 5 Hour Wind Speed (m/s) Winter 0 3 6 9 12 15 18 21 24 0 1 2 3 Hour Wind Speed (m/s) Spring 0 3 6 9 12 15 18 21 24 0 1 2 3 4 Hour Wind Speed (m/s) Summer 0 3 6 9 12 15 18 21 24 0 1 2 3 4 Hour Wind Speed (m/s) Autumn Events Non Events Events Non Events Events Non Events Events Non Events
Fig. 8. Hourly averages of wind speed (m s−1)over all seasons on event and on non-event days for the whole period.
ern sector (e.g., under anti-cyclonic conditions), the pollu-tion haze occupies the entire valley and is exported offshore over the Adriatic Sea (Petritoli et al., 2004). This supports our hypothesis that the difference in event frequency between western and eastern air masses is at least partially due to the different CS concentrations associated with the different air masses.
To investigate the source and transport pathways of the air masses arriving to SPC station during our measuring period we analyzed back trajectories from clear event and non-event days. The analysis was done by using HYSPLIT 4 (Hybrid Single-Particle Lagrangian Integrated Trajectory) model de-veloped by NOAA Air Resource Laboratory (ARL) (Draxler and Hess, 1998). Back trajectories arriving at 10:00 with 100 m arrival height were calculated one day backward in time. Figure 12 shows the position of the air parcel at 24 h back in time for event and non-event days respectively. The air masses associated with nucleation events arrive mostly from the north to east directions, while the distribution of the non-event day air mass directions is more even. Notably, the southern direction is associated with a fair amount of non-events, but very few events.
3.5.2 Effect of gas concentrations on new particle forma-tion
Hourly averages of O3and SO2concentrations (Fig. 13) were observed to be higher on event days than on non-event days while concentrations of NO2 were clearly observed to be lower on event days than on NE days. Significant differences
between event days and non-event days were observed dur-ing winter and autumn seasons for both O3and NO2 concen-trations while only slight differences in SO2concentrations were noted during those seasons. In contrast, for summer and spring seasons, SO2 concentrations show clear differences between event days and NE days whilst for O3concentration no clear differences were observed.
These observations suggest that ozone could be a limiting factor for nucleation event occurrence in winter and autumn when its concentrations are in general lower than in spring and summer. Ozone is responsible for the formation of con-densable species directly through reactions with VOCs, and indirectly by forming other oxidants (OH) upon photolysis. Although condensable organics might not be involved in the actual nucleation, they may be important in speeding up the growth of newly formed molecular clusters so that the clus-ters survive to detectable sizes before being scavenged by coagulation with larger particles.
With SO2, the indication from Fig. 13 is that when its over-all average midday concentration is below about 4 µg m−3 (i.e. spring and summer), it becomes a limiting factor for event occurrence. The natural interpretation is that SO2is needed for production of sulphuric acid, which participates in the nucleation and growth of stable nm-sized clusters.
The concentration of NO2was lower for event days than for non-event days for all seasons. However, during summer, NO2 concentrations were usually high before the event and depleted during the event. Nevertheless, during the events the NO2concentration was observed to be lower than on the same time on non-event days but the difference was small
Winter 0% 10% 20% 30% 40% N NE E SE S SW W NW Event Non Event Spring 0% 10% 20% 30% 40% N NE E SE S SW W NW Event Non Event Summer 0% 10% 20% 30% 40% N NE E SE S SW W NW Event Non Event Autumn 0% 10% 20% 30% 40% N NE E SE S SW W NW Event Non Event
Fig. 9. Local wind direction pattern distributed seasonally for nucleation event days and non-event days over the whole period.
Winter 0 0.01 0.02 0.03 N NE E SE S SW W NW Events Non Events Spring 0 0.01 0.02 0.03 N NE E SE S SW W NW Events Non Events Summer 0 0.01 0.02 0.03 N NE E SE S SW W NW Events Non Events Autumn 0 0.01 0.02 0.03 N NE E SE S SW W NW Events Non Events
Fig. 10. Wind directional pattern of condensation sink CS (s−1)on event days and on non-event days for different seasons over the whole period.
0 50 100 150 200 250 300 <=50 50-100 >100 PM(µg/m3) PM fr e q u e n c y
Fig. 11. The frequency distribution of PM10 concentrations (µg m−3) at the stations belonging to the regional network of Emilia Romagna. The concentration values are grouped into three ranges
(≤50, 50–100, and >100 µg m−3). The vertical axis shows the
number of observations during three years of measurements. The distribution is shown for the stations in the western part of the re-gion (i.e., towards Milan) (in gray), for those in the middle/eastern part, where Bologna and SPC are located (in white), and for the stations along the Adriatic coast (in black). Data source: Quaderno
Tecnico ARPA-SMRn◦10/2002.
in comparison with the other seasons. Apparently, the cor-relation of nucleation events with ozone during winter and fall can be linked with the big difference in the solar radi-ation between cloudy/foggy conditions and clear-sky condi-tions during the cold season (see Fig. 7d) The same differ-ence is probably responsible for the low NO2concentrations found on nucleation days in winter, spring and autumn as the increase in solar radiation promotes the decay of NO2 concentration via reaction with OH. This is supported by the fact that on (clear-sky) nucleation days, the NO2 concentra-tion exhibits a pronounced minimum after noon. In autumn, when non-events days are characterised by very low solar ra-diation (probably due to fogs), the concentrations of NO2are very high and do not show any minima in daytime, while they show the typical pattern for urban stations, i.e., two weak maxima at rush hours. For these reasons, the apparent nega-tive effect of NO2on nucleation can be partly explained by the anticorrelation between the concentration of NO2and so-lar radiation.
Considering the origin of the SO2, its average diurnal be-haviour is very interesting. Since the oxidation of SO2 by OH is very slow compared to NO2, we do not expect the same dependence with solar radiation. Indeed, during winter and fall, when nucleation and non-nucleation days differ a lot with respect of the cloud cover, we do not find significant dif-ferences in the SO2concentrations. In addition, there are no daytime minima in the SO2concentrations. On the contrary, the concentrations double during the day with respect to the night, on average. This suggests that at least a half of the SO2does not come from long-range transport, and originates in an area of ca. 70–100 km of radius around SPC (assuming a wind speed of 2–3 m s−1). Possible sources of SO2in the eastern Po Valley are ceramic industries, and, most likely,
Fig. 12. The distribution of air mass locations at 10:00 a.m. the
previous day prior to arrival to SPC 24 h later. Events are indicated with red colour and non-events with green. The back trajectory altitude at SPC is 100 m.
power plants. Figure 14 shows the districts (“province”) lo-cated northern to the Apennines chain, having an annual SO2 emission higher than 10 000 Mg y−1 (the Bologna district, where SPC is located, has got an emission of 1500 Mg y−1). All but one of the biggest SO2emitters are in the eastern Po Valley. The biggest of all (with more than 90 000 Mg y−1) is the Rovigo district, which is only 50 km North East from SPC. This is due to the power plant of Porto Tolle located there. The SO2 plumes from the power plants, as well as those from the Mantua district, have been shown to spread over the Po Valley during recent aircraft experiments (Wang et al., 2006). During the hot season, turbulent diffusion can ensure high SO2levels in a vast area outside the plumes. The emission inventory reported in Fig. 14 regards only national terrestrial sources, and does not account for other potential sources, e.g., maritime traffic in the Adriatic Sea, and trans-port from central and east European countries, which are, ac-cording to EMEP emission inventories, large SO2emitters. Overall, emissions from power plants and ships and trans-port from central and eastern Europe are responsible for high SO2burdens in the air masses reaching SPC from east. This in turn, together with the lower average CS concentrations, characterises such air masses as the most favourable for event occurrence.
3.6 Correlation of nucleation events with environmental variables
As current nucleation theories are rather unreliable, it would be useful to find reliable correlations with environmental variables that could be used in predicting whether a nucle-ation event occurs on a given day. Such correlnucle-ations have been presented in several recent papers (Boy and Kulmala, 2002; Stanier et al., 2004a; Hyv¨onen et al., 2005). Many recent studies of particle formation at different atmospheric environments have pinpointed solar radiation as the main key variable behind nucleation events while other factors, such as lower temperature, lower relative humidity, and lower con-densation sink have also been shown to favour the occurrence
0 3 6 9 12 15 18 21 24 0 20 40 60 80 Winter O3 (µg/m 3) Hour 0 3 6 9 12 15 18 21 24 0 20 40 60 80 100 Spring O3 (µg/m 3) Hour 0 3 6 9 12 15 18 21 24 0 40 80 120 Summer O3 (µg/m 3) Hour 0 3 6 9 12 15 18 21 24 0 20 40 60 80 Autumn O3 (µg/m 3) Hour Events Non Events Events Non Events Events Non Events Events Non Events 0 3 6 9 12 15 18 21 24 0.5 1 1.5 2 2.5 3 3.5 4 4.5 5 Winter SO 2 (µg/m 3) Hour 0 3 6 9 12 15 18 21 24 0.5 1 1.5 2 2.5 3 3.5 4 4.5 Spring SO 2 (µg/m 3) Hour 0 3 6 9 12 15 18 21 24 1 2 3 Summer SO 2 (µg/m 3) Hour 0 3 6 9 12 15 18 21 24 0.5 1 1.5 2 2.5 3 3.5 4 4.5 5 Autumn SO 2 (µg/m 3) Hour Events Non Events Events Non Events Events Non Events Events Non Events 0 0.51 0 3 6 9 12 15 18 21 24 10 20 30 40 50 Winter NO 2 (µg/m 3) Hour 0 3 6 9 12 15 18 21 24 10 15 20 25 30 35 40 Spring NO 2 (µg/m 3) Hour 0 3 6 9 12 15 18 21 24 5 10 15 20 25 30 Summer NO 2 (µg/m 3) Hour 0 3 6 9 12 15 18 21 24 0 10 20 30 40 50 Autumn NO 2 (µg/m 3) Hour Events Non Events Events Non Events Events Non Events Events Non Events
1000 SO 2 emissions 5000 2500 Apennine 1200600
Fig. 14. Annual emissions of SO2in northern Italy. The red circles are positioned on districts having an annual emission higher than 10 000 Mg (the area of the circles is proportional to the SO2 emis-sion) (data for 2000; source: APAT (Italian Agency for environment protection and technical services)) (+ refers to SPC station).
of new particle formation. However not all studies of new particle formation agree on the necessity of all these factors. Here, we consider three different parametrizations applied to SPC. The needed parameters are calculated from the event start until the event end times for event days. For non-event days, we considered only time range from (08:00–16:00) as this is the time of day when nucleation is expected to occur.
Boy and Kulmala (2002) proposed that solar radiation, temperature, and water vapour concentrations could be com-bined to a “nucleation parameter” which can be used to pre-dict new particle formation events. As shown in Fig. 15a, their nucleation parameter is not a very good predictor of SPC nucleation events (if this was the case, event days should exhibit consistently higher nucleation parameter values than NE days). The main reason for this seems to be the ef-fect of temperature; as discussed above, SPC event days are on average associated with higher temperatures than non-event days, which is opposite to the behaviour observed at Hyyti¨al¨a. Note, however, that we used global radiation in-stead of UV (which was not available for our calculation).
Hyv¨onen et al. (2005) showed that a yet simpler set of parameters could be used to predict the Hyyti¨al¨a new par-ticle formation days. i.e. relative humidity and condensation sink. Figure 15b shows that Hyv¨onen et al. (2005) method does not separate SPC nucleation events and non- events days quite as well as it does for Hyyti¨al¨a. Specifically, our studies (Mikkonen et al., 2006) indicate that criterion of Hyv¨onen et al. (2005) predicts SPC nucleation event days rather well, but it also predicts a high number of false events (i.e. predicts a non-event day to be an event day).
Both these studies of Boy and Kulmala (2002) and Hyv¨onen et al. (2005), considered nucleation events at rather clean conditions, very different from those at the highly pol-luted Po Valley area. At SPC, it is expected that a success-ful method of correlating the nucleation events with
envi-ronmental variables should include, beside the condensation sink, some other pollutant concentrations.
Studies in Pittsburgh, Pennsylvania suggest that favourable conditions for nucleation can be described using a product of UV radiation and sulphuric dioxide (its increase indicates increase of sulphuric acid concentration), and the condensation sink (Stanier et al., 2004a). Figure 15c shows that the Stanier et al. (2004a) parameters work as well as for the Pittsburgh data as most nucleation event days lie to the right of the diagonal line drawn in Fig. 15c (note, however, that we use global radiation rather than UV). Although the criterion of Stanier et al. (2004a) indicates that low enough CS value is needed together with high enough sulphuric acid production, in agreement with our findings presented above, it does not separate event and NE days. This is a further indication that other factors, such as produc-tion of condensable organics capable of speeding up particle growth, are needed to produce a successful parameterization of the occurrence probability of SPC nucleation events.
4 Conclusions
During three years of continuous measurements from 24 March 2002–23 March 2005, clear particle formation events have been identified at the San Pietro Capofiume (SPC) sta-tion. We found that 36% of the days were event days whilst 33% were clearly non-event days. In contrast to most of the other reported sites, the event frequency was somewhat higher, close to 20% in winter at the SPC station. The event frequency was higher during spring and summer months with maximum values in May and July while the minimum was in winter and autumn months. Such high seasonal event fre-quency in spring has been observed quite often in clean and polluted areas as well. However, the high event frequency in summer contrasts with the observations performed in other European rural sites (Birmili et al., 2003), which shows a pronounced minimum in the summer (0.075 events per day at Hohenpeissenberg). Most notably, the seasonal pattern of the event frequency observed at SPC is completely opposite to that found at Ispra, in a rural area at the northern edge of the Po Valley, where a maximum frequency of event days has been observed during autumn months (Rodriguez et al., 2005). The difference in monthly event frequency suggests that different processes are controlling the particle formation events in different sectors of the Po Valley itself. The mean values of the growth and formation rates of the nucleation mode particles were 6.8 nm h−1 and 5.9 cm−3s−1, respec-tively. The formation rate and growth rate values are rather high because of high pre-existing particle concentrations at polluted conditions, thus high growth rates are needed for the nucleated particles to grow to the measurable range. Oth-erwise, they would be scavenged before reaching the 3 nm detection limit. The effects of meteorological parameters and gas phase concentrations on new particle formation were
(a) 2002 2003 2004 2005 10−26 10−25 10−24 10−23 10−22 Years (2002−2005) Nucleation Parameter Non Events Events (b) 10 −3 10−2 10−1 20 30 40 50 60 70 80 90 100 CS RH % Non Events Events (c) 100 101 102 103 104 105 10−3 10−2 10−1
Solar radiation *SO2
CS
Non Events Events
Fig. 15. Nucleation event day predictions by using (a) Boy and Kulmala (2002), (b) Hyv¨onen et al. (2005) and (c) Stanier et al. (2004)
methods applied to SPC station.
studied. Temperature, wind speed, solar radiation, O3 and SO2concentrations were all on average higher during events than non-event days while relative humidity, water vapour concentrations, precipitation and NO2 concentrations were found higher during non-event days than event days. Local
wind direction distribution shows that easterly winds were connected with events while westerly winds were connected to non-event days. This is in agreement with the back trajec-tory analysis, showing that eastern air masses are frequently associated with new particle formation events at SPC. Such