HAL Id: hal-00302800
https://hal.archives-ouvertes.fr/hal-00302800
Submitted on 23 May 2007HAL is a multi-disciplinary open access
archive for the deposit and dissemination of sci-entific research documents, whether they are pub-lished or not. The documents may come from teaching and research institutions in France or abroad, or from public or private research centers.
L’archive ouverte pluridisciplinaire HAL, est destinée au dépôt et à la diffusion de documents scientifiques de niveau recherche, publiés ou non, émanant des établissements d’enseignement et de recherche français ou étrangers, des laboratoires publics ou privés.
SAGE II measurements of stratospheric aerosol
properties at non-volcanic levels
Larry W. Thomason, S. P. Burton, B.-P. Luo, T. Peter
To cite this version:
Larry W. Thomason, S. P. Burton, B.-P. Luo, T. Peter. SAGE II measurements of stratospheric aerosol properties at non-volcanic levels. Atmospheric Chemistry and Physics Discussions, European Geosciences Union, 2007, 7 (3), pp.6959-6997. �hal-00302800�
ACPD
7, 6959–6997, 2007 SAGE II measurements of stratospheric aerosol properties L. W. Thomason et al. Title Page Abstract Introduction Conclusions References Tables Figures ◭ ◮ ◭ ◮ Back CloseFull Screen / Esc
Printer-friendly Version Interactive Discussion
Atmos. Chem. Phys. Discuss., 7, 6959–6997, 2007 www.atmos-chem-phys-discuss.net/7/6959/2007/ © Author(s) 2007. This work is licensed
under a Creative Commons License.
Atmospheric Chemistry and Physics Discussions
SAGE II measurements of stratospheric
aerosol properties at non-volcanic levels
L. W. Thomason1, S. P. Burton2, B.-P. Luo3, and T. Peter31
NASA Langley Research Center, Hampton, VA, USA
2
Science Systems and Applications, Inc., Hampton, VA, USA
3
Institute for Atmospheric and Climate Science, ETH Zurich, Zurich, Switzerland
Received: 22 February 2007 – Accepted: 2 May 2007 – Published: 23 May 2007 Correspondence to: L. W. Thomason (l.w.thomason@larc.nasa.gov)
ACPD
7, 6959–6997, 2007 SAGE II measurements of stratospheric aerosol properties L. W. Thomason et al. Title Page Abstract Introduction Conclusions References Tables Figures ◭ ◮ ◭ ◮ Back CloseFull Screen / Esc
Printer-friendly Version Interactive Discussion Abstract
Since 2000, stratospheric aerosol levels have been relatively stable and at the low-est levels observed in the historical record. Given the challenges of making satellite measurements of aerosol properties at these levels, we have performed a study of the sensitivity of the product to the major components of the processing algorithm used in 5
the production of SAGE II aerosol extinction measurements and the retrieval process that produces the operational surface area density (SAD) product. We find that the aerosol extinction measurements, particularly at 1020 nm, remain robust and reliable at the observed aerosol levels. On the other hand, background periods, the SAD oper-ational product has an uncertainty of at least a factor of 2 due to the lack of sensitivity 10
to particles with radii less than 100 nm.
1 Introduction
SAGE II (Stratospheric Aerosol and Gas Experiment II) operated in low Earth orbit be-tween October 1984 and August 2005 producing globally distributed profiles of ozone, NO2, water vapor, and aerosol extinction at four wavelengths from the middle
tropo-15
sphere though the stratosphere. It is the third in a series of four solar occultation instruments whose records begin in 1978 and end in March 2006. During this time the variability of aerosol in the stratosphere is dominated by a series of large volcanic per-turbations and followed by multi-year recoveries. The most significant of these erup-tions are the 1991 Pinatubo and the 1982 El Chich ´on eruperup-tions, which continued to 20
have observable effects into the SAGE II observational period. The Pinatubo eruption was the most stratospherically significant volcanic event of the past 30 years and was responsible for significant radiative and chemical effects in the atmosphere (e.g. Mc-Cormick et al., 1995). The SAGE II data also records perturbations associated with a number of smaller volcanic events including the eruptions of Nevado del Ruiz and Nya-25
muragira (1985/1986), Kelut (1990), Cerro Hudson (1991), and Ruang and Reventador 6960
ACPD
7, 6959–6997, 2007 SAGE II measurements of stratospheric aerosol properties L. W. Thomason et al. Title Page Abstract Introduction Conclusions References Tables Figures ◭ ◮ ◭ ◮ Back CloseFull Screen / Esc
Printer-friendly Version Interactive Discussion
(2002). For most of the SAGE II record, the stratosphere can be considered to be in recovery from volcanic perturbations.
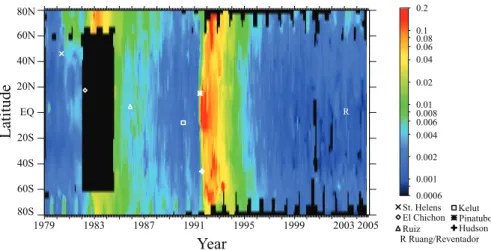
The 1979–2004 multi-instrument 1000-nm stratospheric optical depth is shown in Fig. 1. The stratospheric column optical depth was well in excess of 0.1 following the eruption of Pinatubo. However, in recent years, the lack of stratospherically significant 5
volcanic activity has led to the lowest optical depth values in the 28-year record with minimum values near 0.001 or a factor of more than 100 smaller than the maximum. At some altitudes, changes in the measured aerosol extinction have varied by a factor in excess of 1000. Immediately following Pinatubo, the part of the aerosol extinction profiles accessible to SAGE II occultation often terminated well above the tropopause. 10
Therefore, the optical depths between the eruption and mid 1993 are computed by extrapolating the profiles from the bottom of the profile down to the tropopause using lidar data as described in the SPARC Assessment of Stratospheric Aerosol Proper-ties (Thomason and Peter, 2006). The premature termination of profiles is commonly referred to as the “saturation” effect that represents the upper bounds of the SAGE 15
II dynamic range and occurs when the line of sight optical depth observed by the in-strument (through the limb of the Earth’s atmosphere) exceeds measurable bounds (a value of about 7). Saturation, due to Pinatubo effects, occurs from shortly after the eruption through mid-1993. It additionally occurs throughout the SAGE II record due to the presence of clouds, though mostly in the troposphere. In fact, clouds in the 20
troposphere are the most common mechanism for defining the lower altitude extent of extinction profiles.
Since 2000, aerosol extinction has been characterized by relatively steady levels throughout the stratosphere and may represent a volcanically unperturbed strato-sphere. Except for a minor perturbation by the eruptions of Ruang and Reventador in 25
late 2002, this is the only period of steady aerosol levels in the satellite measurement era dating back to the late 1970s. This extended period represents an opportunity to observe the optical manifestations of the processes that control stratospheric aerosol under volcanically quiescent conditions including possible human-derived effects. For
ACPD
7, 6959–6997, 2007 SAGE II measurements of stratospheric aerosol properties L. W. Thomason et al. Title Page Abstract Introduction Conclusions References Tables Figures ◭ ◮ ◭ ◮ Back CloseFull Screen / Esc
Printer-friendly Version Interactive Discussion
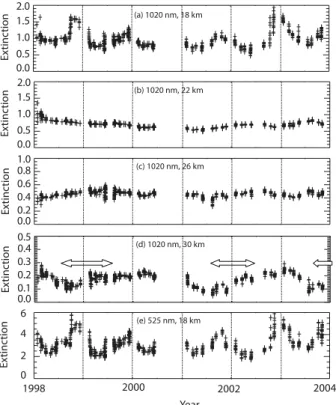
this period, Fig. 2 shows the aerosol extinction in the tropics at altitudes between 18 and 30 km. The SAGE II extinction record shows a significant annual cycle at 18 km. Its source is not obvious as the data have been cleared of clouds (Kent et al., 1996; Thomason and Peter 2006). Less than 20% of the observed cycle may be due to the annual temperature and water vapor cycle leading to a cycle in the water uptake of the 5
H2SO4-H2O aerosol and hence its size, but more than 80% must be related to different
amounts of H2SO4 entering the stratosphere. There is also a significant aerosol
vari-ability that appears to have a period similar to the Quasi-Biennial Oscillation (QBO) at 30 km, while there is virtually no evidence for these cycles at 22 or 26 km.
With aerosol at such low levels, as a corollary to the saturation problem, it is sensible 10
to ascertain the degree to which SAGE II extinction measurements remain dependable at the reported levels and, by extension, determine whether measurement features like the tropical annual aerosol extinction cycle are robust features of aerosol morphology. Several factors may influence the robustness of the measurements at low levels. These include measurement noise, dark current subtraction, altitude registration, cloud clear-15
ance, and correction for the effects of molecular scattering and absorption by ozone and nitrogen dioxide. Herein, we discuss the sensitivity of the product to the major components of the processing algorithm used in the production of SAGE II aerosol ex-tinction measurements. In addition to exex-tinction, SAGE II provides an estimate of the aerosol surface area density (SAD) as an operational product (Thomason et al., 1997). 20
Since visible and near-infrared wavelength aerosol extinction is insensitive to particles with radii smaller than 100 nm, the robustness of SAD estimates based on these mea-surements is questionable. Therefore, we have also included a study of the limitations of SAD estimates based on SAGE II aerosol extinction measurements.
ACPD
7, 6959–6997, 2007 SAGE II measurements of stratospheric aerosol properties L. W. Thomason et al. Title Page Abstract Introduction Conclusions References Tables Figures ◭ ◮ ◭ ◮ Back CloseFull Screen / Esc
Printer-friendly Version Interactive Discussion 2 SAGE II Aerosol extinction measurement sensitivity study
2.1 An overview of the retrieval process
SAGE II is a solar occultation instrument. It records the attenuation of sunlight by the Earth’s atmosphere at seven wavelengths between 386 nm and 1020 nm during each sunrise and sunset encountered by the spacecraft. As the sun rises or sets, the in-5
strument scans across the face of the sun, thereby obtaining multiple measurements of total slant path transmittance for a given ray tangent altitude. Since measurements are also made for ray paths outside the atmosphere, this technique is self-calibrating. The tangent altitude of each ray path is calculated from spacecraft and sun ephemeris data, taking into account the shape of the Earth and atmospheric refraction. The total 10
slant path optical depth data are corrected for molecular scattering using meteorologi-cal data from the National Centers for Environmental Prediction (NCEP) supplemented with climatological data at higher altitudes. Then the information for the seven SAGE II channels is separated into slant path optical depth contributions for ozone, nitrogen dioxide and water vapor plus aerosol in four channels (centered at 1020 nm, 525 nm, 15
452 nm and 386 nm) using a least squares technique in which aerosol effects at 448, 600, and 945 nm are estimated using a physically-based interpolation from the other channels. Finally, the slant path profiles undergo vertical inversion to produce vertical profiles of aerosol extinction in four channels, ozone and NO2 number density, and
H2O mixing ratio (e.g. Chu et al., 1989). For the sensitivity study, we will show results
20
based on occultations that occurred between 10◦
N and 30◦
N during the extended low aerosol loading period. This latitude band was chosen because column aerosol load-ing is relatively low in this region (see Fig. 1) and therefore it is potentially the most difficult region in which to make aerosol measurements; however, the following results are generally applicable to all latitudes.
25
ACPD
7, 6959–6997, 2007 SAGE II measurements of stratospheric aerosol properties L. W. Thomason et al. Title Page Abstract Introduction Conclusions References Tables Figures ◭ ◮ ◭ ◮ Back CloseFull Screen / Esc
Printer-friendly Version Interactive Discussion
2.2 Sensitivity study
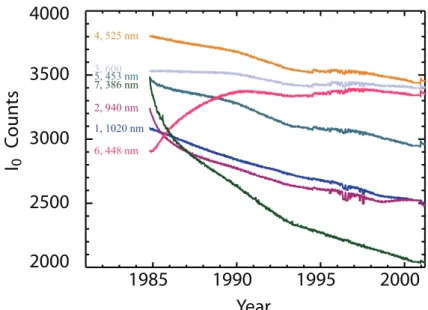
The raw measurement obtained by the instrument is solar power as an integer number of counts from 3 or 4 (off-sun) to a few thousand, depending on the channel. The val-ues measured through the Earth’s limb are normalized by the exoatmospheric counts to generate transmittance measurements. The peak exoatmospheric count levels have 5
generally decreased slowly over the lifetime of the instrument. Figure 3 shows the peak exoatmospheric count levels for the center of the Sun for the seven spectral channels from 1984 to 2005. Since the electronic noise level for the instrument is very low (less than one count), the signal-to-noise ratio for this data is very high. However, as the instrument scans from edge to edge across the face of the sun, the number of 10
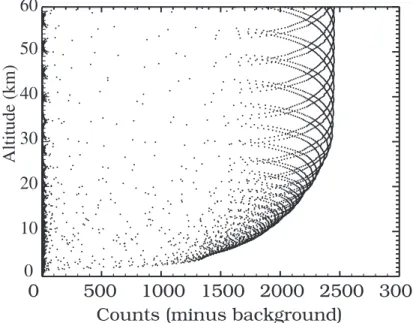
counts decreases toward zero, so only data from the center 90% of the Sun is used to compute transmission. Count levels also decrease as the path through the atmo-sphere approaches the Earth’s surface. Figure 4 shows the raw counts measured in the 1020 nm channel as a function of altitude for a single event in December 2003 and demonstrates that the bulk of the on-sun measurements in the stratosphere and well 15
into the troposphere have count levels of 1500 or higher. Therefore, the transmittance accuracy is on the order of 0.1%.
The transmittance signal in each channel is attributable to multiple sources: aerosol and molecular scattering and absorption by ozone, NO2, and water vapor. Specifically, the aerosol extinction signal in the 1020 nm channel must be separated from the signal 20
due to molecular scattering plus a small contribution from ozone absorption. Figure 5 shows the fraction of the signal in the 1020 nm channel due to aerosol. This fraction varies from about 40% to 60% below 30 km showing that at these altitudes 1020-nm ex-tinction is not sensitive to the removal of interfering species. Above 30 km, the aerosol fraction decreases rapidly and the importance of the molecular correction increases 25
rapidly.
Other parameters besides the sensitivity to aerosol could potentially handicap the aerosol measurements, including a number of possible sources of bias hinted at in the
ACPD
7, 6959–6997, 2007 SAGE II measurements of stratospheric aerosol properties L. W. Thomason et al. Title Page Abstract Introduction Conclusions References Tables Figures ◭ ◮ ◭ ◮ Back CloseFull Screen / Esc
Printer-friendly Version Interactive Discussion
description of the retrieval above. The aim of the sensitivity study is to examine the effect on 1020 nm and 525-nm aerosol extinction data of various sources of systematic error, including the dark (off-sun) measurement, the altitude registration, the meteoro-logical input data, and the gas cross-sections. In the following discussion, we demon-strate that the 1020-nm aerosol extinction is not sensitive to any of these sources while 5
the 525-nm aerosol extinction is sensitive only to the ozone cross-section. 2.2.1 Dark count subtraction
The dark count value is measured by pointing the instrument away from the sun. It represents the instrument’s “zero” level. In processing, this value is subtracted from the raw solar power measurements before the calibration by the exoatmospheric scans. 10
The dark count values for all seven channels are all between 3 and 4 counts, or about one or two one-thousandths of the maximum intensity measured. Over the lifetime of the instrument, dark count values have been stable for each measurement channel. Ironically, the generally desirable characteristics of very small measurement noise and a high stability of the dark count level conspire to make precise measurements of dark 15
counts difficult. Our confidence is about one half count and therefore is a large fraction of the overall dark count value.
In practice, dark count subtraction will have its greatest impact when the channels are near saturation and the measured total count level is close to the dark count value. In the stratosphere, this only occurs immediately after the Pinatubo eruption in 1991. 20
In stratospheric background periods it occurs only in the presence of clouds for the 1020-nm channel and for clouds or in clear skies at and below about 6 km for the 525-nm channel. In order to determine the sensitivity of the aerosol measurements to the uncertainty in the dark count subtraction, we performed two experiments in which the magnitude of the dark count subtraction was changed by one count, first in the 1020 nm 25
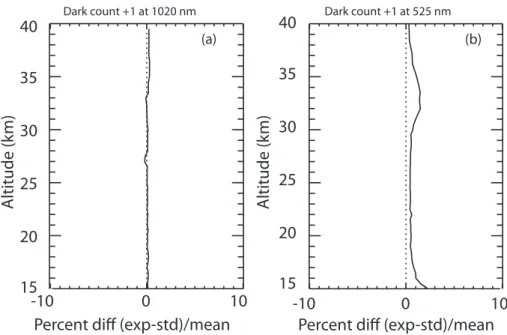
channel and then in the 525 nm channel. Figure 6 shows the results of these experi-ments on the ratio of detected aerosol extinction (525 nm/1020 nm). The events were 25 subtropical events from December 2003. They were reprocessed with a change in
ACPD
7, 6959–6997, 2007 SAGE II measurements of stratospheric aerosol properties L. W. Thomason et al. Title Page Abstract Introduction Conclusions References Tables Figures ◭ ◮ ◭ ◮ Back CloseFull Screen / Esc
Printer-friendly Version Interactive Discussion
the dark count subtraction of one count. The resulting systematic change when the assumed background is changed in the 1020-nm channel is a fraction of a percent. The effect of adjusting the 525-nm background is slightly larger, but is still less than a percent below 30 km, except in the vicinity of 15 km where it is about 2% in the 525-nm extinction (visible here as a similar change in the ratio, since the change in 1020-nm 5
extinction is near zero). As expected, we find that background stratospheric aerosol measurements are not greatly influenced by the dark count subtraction.
2.2.2 Altitude registration sensitivity
The determination of the ray tangent altitude is another potential source of systematic error. In a similar experiment to that described above, the altitude registrations were 10
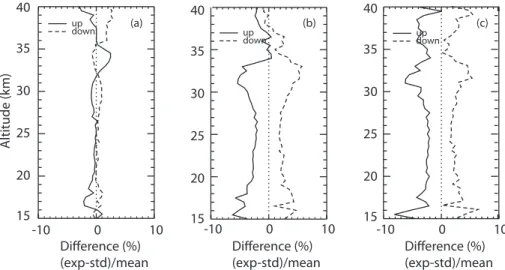
artificially shifted upward and downward by 100 m. This shift is comparable to the altitude registration uncertainty derived from ozone intercomparisons (e.g. Wang et al., 2002). The shift was experimentally applied to all profiles in the 10◦–30◦N latitude band in October 2001 through September 2002. The result, shown in Fig. 7 shows that the effect on 1020 nm aerosol extinction is less than 3% throughout the stratosphere. 15
The effect of an upward (downward) shift on the 525-nm aerosol measurement is to decrease (increase) the inferred extinction by about 2–5% almost everywhere in the stratosphere, with the peak shift near 31–33 km. Even at the peak value, where the difference is 6% in the measured 525-nm aerosol extinction and in the 525 to 1020-nm extinction ratio, the systematic error resulting from this experiment is quite small. 20
2.2.3 Temperature profile sensitivity
In our third experiment, we examine the effect on the SAGE II aerosol extinction mea-surements of an artificially induced systematic bias in the NCEP temperature profiles at the 100-mb level. Randel et al. (2000) has reported that the NCEP tropopause temperature is too warm by approximately 3–5 K. The possibility of a systematic error 25
or a spurious trend in the temperature data is of particular concern to SAGE II mea-6966
ACPD
7, 6959–6997, 2007 SAGE II measurements of stratospheric aerosol properties L. W. Thomason et al. Title Page Abstract Introduction Conclusions References Tables Figures ◭ ◮ ◭ ◮ Back CloseFull Screen / Esc
Printer-friendly Version Interactive Discussion
surements since such an error can produce a bias or an artificial trend in the aerosol measurements. Accordingly, we have experimentally adjusted the temperature profiles that are input to the SAGE II retrieval for the same 10◦
–30◦
N latitude band in October 2001 through September 2002.
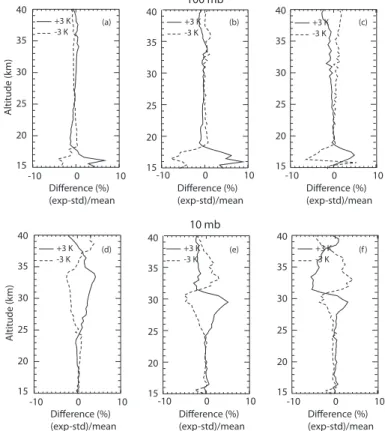
First, the temperature at the 100 hPa level was increased by 3 K. The result is an 5
increase of 9% in a narrow region near 16 km and a decrease of generally less than 1% in the 525-nm channel in the stratosphere (Fig. 8, top middle). In the 1020-nm channel, the narrow peak is somewhat smaller, while stratospheric values again change by 1% or less (Fig. 8, top left). Conversely, decreasing the temperature results in equivalent changes opposite in sign to those described above (Fig. 8, top left, middle, and right). 10
The temperature uncertainty at a higher altitude may be more relevant to strato-spheric aerosol measurements. Therefore, in a separate experiment, we have tested the response of the aerosol measurements to an increase or decrease of 3 K in the 10 hPa level (about 31 km). The bottom panels of Fig. 8 demonstrates the response of the aerosol extinction measurements to this perturbation. Increasing the temperature 15
produces an increase in the measured 1020-nm aerosol extinction between 25 and 38 km, with a peak effect of about 4% near 34 km. The effect on the 525-nm measure-ment is increasing between about 25 and 31 km, with a peak of about 5% at 29.5 km, and a constant decrease of about 2% above 31 km. In summary, a 1% error in abso-lute temperature translates into an error of up to 4% in the 525 and 1020 nm extinction 20
coefficients and similarly in their ratio. 2.2.4 Sensitivity to mirror correction
In an additional experiment, we assess the effect of an imposed bias in the mirror correction. The mirror correction is a small adjustment, nearly linear with altitude that is made to correct for variation in the mirror reflectivity as a function of the mirror angle. 25
The correction is small throughout the depth of the atmosphere and never exceeds 1% with an estimated relative uncertainty of 0.4%. For testing, we made the mirror correction one sigma (0.4%) larger than the operational values. The effect on the
ACPD
7, 6959–6997, 2007 SAGE II measurements of stratospheric aerosol properties L. W. Thomason et al. Title Page Abstract Introduction Conclusions References Tables Figures ◭ ◮ ◭ ◮ Back CloseFull Screen / Esc
Printer-friendly Version Interactive Discussion
525-nm and 1020-nm aerosol extinction profiles is negligible throughout the 15–35 km region, with a maximum effect of only 1.8% near 38 km in the 1020-nm channel and less than 1% at 34 km in the 525-nm channel. These effects are very small and only occur at the high altitude extreme of the aerosol profiles where measurement uncertainty is already close to 100%.
5
2.2.5 Sensitivity to aerosol model
The SAGE II species retrieval includes an aerosol model which is used to calculate the aerosol extinction in the 600-nm channel where it is an interfering species in the ozone retrieval. The calculation estimates the aerosol slant path optical depth as a linear combination of the aerosol optical depth in the 1020-nm and 525-nm channels. The 10
model, similar to that described by Chu et al. (1989), uses a set of linear coefficients to relate extinction at 525 and 1020-nm extinction to that at 600 nm based upon a family of log-normal aerosol size distributions that are representative of stratospheric aerosol. The model produces 600-nm aerosol extinction estimates with an estimated accuracy of ∼1%. For the sensitivity study, we perturbed the 600-nm aerosol by changing the 15
coefficients multiplying the other two channels, both separately and together, by one percent. Since the retrieval is a simultaneous retrieval of the gaseous species and aerosol in all channels, there is potential crosstalk between the retrieval of ozone and aerosol extinction, particularly for the shorter wavelength aerosol channels, through the aerosol model. However, we find that these perturbations have a negligible effect 20
on the 1020-nm and 525-nm aerosol extinction. The effect on the 1020-nm aerosol extinction was effectively zero (less than 0.01%) in all three tests; the maximum effect on the 525-nm aerosol extinction was less than four tenths of a percent (this occurred when both coefficients were simultaneously biased away from their standard values in the same direction).
25
ACPD
7, 6959–6997, 2007 SAGE II measurements of stratospheric aerosol properties L. W. Thomason et al. Title Page Abstract Introduction Conclusions References Tables Figures ◭ ◮ ◭ ◮ Back CloseFull Screen / Esc
Printer-friendly Version Interactive Discussion
2.2.6 Ozone cross-section sensitivity
The final component of the sensitivity study is an assessment of the effect of a system-atic error in the ozone cross-section. SAGE II version 6.2 uses the ozone cross sec-tions of Anderson and Mauersberger (1992) and Anderson et al. (1990, 1991, 1993a, b) and the temperature dependence measured by Burkholder and Talukdar (1994), as 5
compiled by Shettle and Anderson (1994). These sources report uncertainties of 1–2% and temperature dependence, at stratospheric temperatures, of less than 1% near the peak of the Chappuis band and of about 5% near 525 nm. Ozone absorption cross-sections for each channel are required for the retrieval of individual species. These are derived by combining the above cross sections with the SAGE II instrument’s filter 10
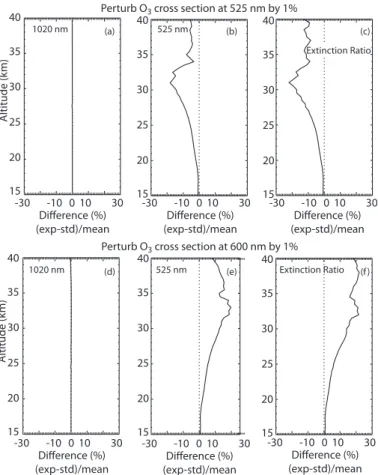
response function. Since the 525-nm channel is within the Chappuis band, the cross section at that channel is a potential source of systematic error in the aerosol mea-surements. On the other hand, the ozone cross section at 1020 nm is very small and unlikely to play a role in the aerosol extinction coefficient measurement quality. The test consists of a perturbation of 1% in the ozone cross section for that the 525-nm chan-15
nel. As expected, Fig. 9 shows that there is almost no effect on the 1020 nm aerosol extinction, but a significant effect on 525 nm aerosol extinction that increases with al-titude reaching 18% at 31 km. A related experiment was also performed in which the cross section for the primary ozone channel (at 600 nm) was also changed by 1%. The effect on the 525-nm aerosol extinction measurement is in the opposite sense than the 20
previous experiment but with a similar altitude dependence. The peak change is about 20% near 33 km. The effect on the 1020 nm aerosol extinction measurement is again nearly zero.
As a result, we find that a systematic bias in the ozone cross section (either in an absolute sense or in its temperature dependence) could potentially produce artificial 25
seasonal cycles or other effects in the inferred aerosol extinction coefficient variability but only at the short wavelength channels like 525 nm. The 1020-nm channel is essen-tially independent of ozone cross section errors and therefore, annual cycles in aerosol
ACPD
7, 6959–6997, 2007 SAGE II measurements of stratospheric aerosol properties L. W. Thomason et al. Title Page Abstract Introduction Conclusions References Tables Figures ◭ ◮ ◭ ◮ Back CloseFull Screen / Esc
Printer-friendly Version Interactive Discussion
that appear in both the short wavelength channels and the 1020-nm are likely to reflect real changes in the aerosol morphology rather than a residual ozone signature. This includes the annual cycles (shown Fig. 2) in the tropical lower stratosphere (amplitude ∼20%) and the annual cycle near 30 km where the amplitude is near 50%. It also im-plies that the real uncertainty in the 525-nm ozone cross section must be significantly 5
less than 1%.
2.3 Summary of aerosol extinction coefficient sensitivity study
We find that during the low stratospheric aerosol levels found beginning in 2000 and continuing through the end of its mission in 2005 SAGE II aerosol extinction coefficient profiles remained robust and reliable. While the relative uncertainties associated with 10
measurement noise were larger than during higher aerosol loading periods, the poten-tial for significant measurement bias remained low. For these conditions, at 1020 nm, the maximum bias is less than 5% from the tropopause to 30 km and is dominated by the potential for bias in the a priori temperature profile data used in the data pro-cessing. At 525 nm, the potential for bias is less than 10% through most of the lower 15
stratosphere and approaches 20% at 30 km. At this wavelength, the bias potential is dominated by uncertainty in the temperature profile data and in the ozone cross sec-tion.
3 Surface area density estimation sensitivity
3.1 A model for determining the limiting bounds on SAD 20
The operational SAGE II data processing includes estimated surface area density (SAD) beginning with the release of Version 6.2. The method follows that described by Thomason et al. (1997) except the coefficients used in the operational retrieval are weighted by measurement uncertainty thereby moving the SAD derivation dependence
ACPD
7, 6959–6997, 2007 SAGE II measurements of stratospheric aerosol properties L. W. Thomason et al. Title Page Abstract Introduction Conclusions References Tables Figures ◭ ◮ ◭ ◮ Back CloseFull Screen / Esc
Printer-friendly Version Interactive Discussion
toward the 525 and 1020-nm channels rather than the short wavelength channels that are generally less reliable. Operationally, this approach was simplified to this expres-sion SAD=k1020 1854.97+90.137r+66.97r2 1.−0.1745 r+0.00858r2 ! (1)
where r is the 525 to 1020-nm aerosol extinction ratio, and k1020is the 1020-nm aerosol
5
extinction coefficient in units of km−1
and the equation yields surface area density in units of µm2cm−3
. This technique was shown to produce values comparable with those produced by in situ instruments such as the University of Wyoming Optical Particle Counter (OPC) during the post-Pinatubo period (e.g. Thomason et al., 1997) but more recent work shows that it tends to underestimate OPC-derived SAD during low aerosol 10
loading periods such as the current period (e.g. Thomason and Peter, 2006). It is not surprising that SAD calculations based on visible wavelength extinction measurements are less robust during low aerosol periods since the inferred aerosol properties like SAD become increasingly dependent on particles smaller than 100 nm which are rather poor scatterers and thus have only a small impact on measured extinction values. 15
Figure 10a shows the aerosol extinction kernels for the four SAGE II measurement wavelengths (386, 452, 525, and 1020 nm) assuming spherical particles composed of a mixture of sulfuric acid and water. Generally, aerosol extinction coefficient and particle size are positively correlated; that is, as aerosol extinction coefficient increases the mean particle size also increases. Thus, for low aerosol loading it is possible that 20
a significant fraction of SAD lies at particle sizes to which visible wavelength aerosol extinction is almost totally insensitive and, as a result, the calculation of SAD is prone to substantial uncertainties. The retrieval of SAD for low aerosol loading is not necessarily biased to low values but rather it is highly dependent on how the retrieval process fills the small end of the particle size distribution and thus can be biased either high or low. 25
This will be demonstrated later in this section. Many techniques have been applied to this calculation for SAGE II data, each of which filled this “blind spot” in a somewhat
ACPD
7, 6959–6997, 2007 SAGE II measurements of stratospheric aerosol properties L. W. Thomason et al. Title Page Abstract Introduction Conclusions References Tables Figures ◭ ◮ ◭ ◮ Back CloseFull Screen / Esc
Printer-friendly Version Interactive Discussion
different manner (Wang et al., 1989; Thomason et al., 1997; Steele et al, 1997; Yue et al., 1999; Bingen et al., 2004). The operational SAD retrieval puts relatively little material at radii smaller than 50 nm and thus is likely to produce SAD values that are biased low to some degree (Thomason et al., 1997).
SAD is an important parameter in stratospheric chemistry as well as for light scatter-5
ing and absorption, and hence for stratospheric heating and consequently dynamics. The background aerosol levels currently observed establish a baseline for SAD effects. As a result, it is important to establish the level of reliability for SAGE II SAD estimates for use in chemical and radiative modeling. This is particularly important since SAGE II provides a unique global view of the aerosol burden from 1984 into 2005 spanning 10
the entire Pinatubo period. The only other comparable data set is that provided by the Halogen Occultation Experiment (HALOE) which is also a space-based solar oc-cultation experiment that operates in the infrared. HALOE produces SAD estimates that are in fact smaller than those estimated from SAGE II during background periods (Hervig et al., 1998, 2002). To quantify the range of possible solutions for SAD during 15
background periods, we will in the following develop simple models that allow us to put bounds on the maximum and minimum values for SAD that are consistent with the measured aerosol extinction and its wavelength dependence. These models provide rigorous limits on the SAD calculation but are not meant to produce a new SAD retrieval algorithm.
20
4 Method 1
For the first approach, the minimum SAD value consistent with observed aerosol ex-tinction is a straightforward calculation. It is based on the observation from Fig. 11a that the Mie scattering efficiency monotonically increases for particle sizes between 0 and ∼0.5 µm. As a result, on a per particle basis, the largest particles produce the 25
most extinction at the cost of the smallest SAD. Thus the minimum possible SAD oc-curs for a monodispersed aerosol at the radius that preserves the observed extinction
ACPD
7, 6959–6997, 2007 SAGE II measurements of stratospheric aerosol properties L. W. Thomason et al. Title Page Abstract Introduction Conclusions References Tables Figures ◭ ◮ ◭ ◮ Back CloseFull Screen / Esc
Printer-friendly Version Interactive Discussion
wavelength dependence modified by measurement uncertainty. For this model, aerosol extinction is given by
k(λ) − ε(λ) = NminQ(rminλ)πrmin2 , (2)
where k and ε are the aerosol extinction coefficient and its associated uncertainty at wavelength λ, Nmin and rmin are the number density and radius of the monodispersed 5
aerosol, and Q(r,λ) is the Mie extinction efficiency seen in Fig. 10a. Figure 10b shows the 525 to 1020-nm extinction ratio to particle radius relationship for this model. This relationship is robust for particle sizes from 0 to 0.5 µm but becomes multi-valued at larger radii where the extinction ratio approaches 1. As a result, this method becomes ill-behaved for high aerosol loading periods (e.g. post-Pinatubo) and other situations 10
where the measured extinction ratio is small. The minimum SAD, SADmin, is com-puted by using the 525 to 1020-nm extinction ratio, (k(525 nm)-ε(525 nm))/k(1020 nm), to infer rmin then Nmin is computed using Eq. (2) above. Finally, SADmin is given by
4πNminr 2 min.
From a mathematical perspective, the maximum possible SAD that can be produced 15
from SAGE II measurements is unbounded. Since particles smaller than 0.1 µm are poor scatterers, it is possible to produce virtually unlimitedly large values of SAD by adding to the aerosol distribution derived for the minimum SAD (preserving the mea-sured extinction coefficients) a second monodispersed mode at a very small radius (≪0.1 µm). For instance, using enough 10 nm particles to perturb the 525-nm aerosol 20
extinction by the measurement uncertainty (∼10%) produces SAD values in excess of 104µm2cm−3 at the cost of a particle density on the order of 107cm3 for conditions where the operational method produces values on the order of 1 µm2cm−3
. Clearly, number densities of this order are physically unrealistic but this illustrates the scope of the mathematical freedom afforded in SAD calculations by visible near infrared wave-25
length extinction measurements.
An alternative approach to estimating a maximum value of SAD is based on the observation from in situ measurements that aerosol number density tends to be around
ACPD
7, 6959–6997, 2007 SAGE II measurements of stratospheric aerosol properties L. W. Thomason et al. Title Page Abstract Introduction Conclusions References Tables Figures ◭ ◮ ◭ ◮ Back CloseFull Screen / Esc
Printer-friendly Version Interactive Discussion
10 cm−3
independent of the details of the size distribution (Deshler et al., 2003). The physical reason for this is coagulation, which takes typically one year to reduce 10 cm−3
to half of this value, whereas it takes approximately one month to halve 100 cm−3
and 3 days to halve 1000 cm−3
. In light of this, we compute a second monodispersed mode that brings the total number density to a fixed value, Ntotal=20 cm
−3
, at a radius 5
that perturbs the shortest aerosol extinction wavelength used in the calculation by the measurement uncertainty ε(λ). In this case, SADmax(the Method 1max) is given by
SADmax=SAD ′
min+4(Ntotal−Nmin)πrmax2 (3)
where rmaxis the radius that is the solution to
ε(λmin)=Q(rmax, λmin)πrmax2 (Ntotal−N ′
min) (4)
10
where ε is the uncertainty in the short wavelength aerosol extinction coefficient at wave-length λmin. In this case, we use a minimum SAD, SAD
′
min, computed using k(λ) instead
of k(λ)–ε(λ) (with parameters N′
min and r ′
min) in Eqs. (3) and (4) since the resulting
SADmax is slightly larger than using the values associated with Eq. (2). This method produces a positive though generally smaller perturbation to the 1020-nm aerosol ex-15
tinction relative to the perturbation at the shorter wavelength. This is appropriate for SAGE II data since the uncertainties at the short wavelength channels are much larger than those at 1020 nm and are highly correlated between channels. Unlike the mini-mum bound, this value is empirical and is not strictly a maximini-mum bound to SAD and dependent on the a priori choice of Ntotalthough this can be perfectly justified physically.
20
5 Method 2
We have defined a more generalized form of the two monodispersed mode model which leaves the errors uncorrelated (Method 2) but leaves the total particle number,
Ntotal, fixed at 20 cm−3
. Since SAGE II aerosol errors tend to be highly correlated, this is a less realistic model than Method 1 but, as will be demonstrated below, it yields a 25
ACPD
7, 6959–6997, 2007 SAGE II measurements of stratospheric aerosol properties L. W. Thomason et al. Title Page Abstract Introduction Conclusions References Tables Figures ◭ ◮ ◭ ◮ Back CloseFull Screen / Esc
Printer-friendly Version Interactive Discussion
much larger range in SAD than does Method 1. For Method 2, we compute a dense set of multi-wavelength aerosol extinction coefficient spectra that fills the bounds of three free parameters: N2 the particle number density in the large mode which lies between
0 and 20 cm−3
, rl the mode radius of the large mode which lies between 0.01 and 0.5 µm, and rs the radius of the small mode which lies between 0.01 and 0.5 µm (and 5
in practice smaller than rl). The maximum and minimum values for SAD occur where the computed extinction coefficients lay within the uncertainty bounds of the extinction coefficient measurements at two or more wavelengths (SADmin 2 and SADmax 2). We
use a look up table with more than 107 elements to determine a solution. While this approach is laborious, it avoids the numerical instability endemic to the direct retrieval 10
process which is exacerbated by the fine structure in the extinction kernels and the use of monodispersed size distributions. The minimum and maximum SAD values that both Method 1 and Method 2 yield are intended to be extreme and the real distribution of particle sizes is likely to be spread across a broad range of particle sizes that yield SAD values well within the bounds derived here.
15
5.1 Examples of SAD bound calculations
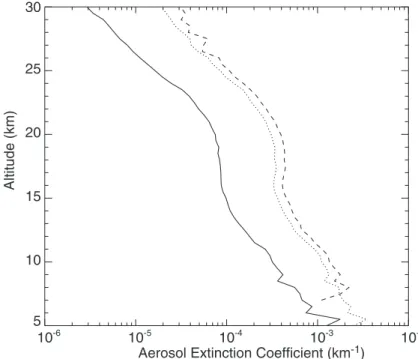
Figure 11 shows the mean SAGE II aerosol extinction coefficient profiles for Northern midlatitudes in April 2001. This period occurs well within the current non-volcanic pe-riod and the profiles are typical of the pepe-riod between 2000 and the end of the SAGE II measurements in August 2005. Figure 12 shows a comparison of SADminand SADmax
20
values for Method 1 for the same period along with the operational SAD profile. In this case, we show results for Ntotalequal to 20 cm−3
and using both the extinction at 452 and 525 nm as the short wavelength aerosol channel. As Fig. 12 shows, we find that the SAD bounds are not strongly influenced by the choice of the 452 or 525 nm channels and we will limit further discussion to the use of the 525-nm channel. We find 25
that for these parameters the difference between the minimum and maximum values of SAD increases from about a factor of 2 at 10 km to about a factor of 4 at 25 km and
ACPD
7, 6959–6997, 2007 SAGE II measurements of stratospheric aerosol properties L. W. Thomason et al. Title Page Abstract Introduction Conclusions References Tables Figures ◭ ◮ ◭ ◮ Back CloseFull Screen / Esc
Printer-friendly Version Interactive Discussion
roughly follows the increase in the 525 to 1020-nm extinction coefficient ratio (decreas-ing mean particle size). The operational model tends to lie within these bounds where it runs from a little less than SADmax at 10 km to a little greater than SADmin at 25 km.
In the main aerosol region below 25 km, the operational value lies around 30% of the way from SADmin to SADmaxand thus follows the general expectation that it would tend 5
to produce surface area density values that are on the low end of the range of possible values.
Figure 13 shows the minimum and maximum SAD values for the 2 and 3-channel results from Method 2 compared to the operational results and results from Method 1. The 2 and 3-channel methods (using 525 and 1020 nm and 452, 525, and 1020 nm 10
channels respectively) yield very similar results so we will restrict further discussion to the three channel method. Here, we find that the range in SAD is much larger than found for Method 1 and runs from a factor of 6 near 10 km to a factor of ∼15 at 25 km. The larger domain is an outcome of the solutions Method 2 preferentially produces for the minimum and maximum SADs. For the minimum solution the solution uniformly 15
occurs for the shallowest allowed slope in the extinction coefficient wavelength depen-dence (the largest allowed negative departures at the short wavelengths and largest allowed positive departures at 1020 nm) whereas the maximum SAD solution invari-ably occurs for the steepest allowed solution (the largest allowed positive departures at the short wavelengths and largest allowed negative departures at 1020 nm). This 20
result is not surprising since the steeper slope implies smaller particles which require greater surface area to produce an equivalent extinction as larger particles. The effect of the slope change is extremely non-linear (as implied by Eq. 1) and overwhelms any change in SAD implied by the relatively minor changes in the absolute magnitude of the extinction coefficients.
25
Figure 14 shows the derived free parameters (rmin, rmax, r′
min, Nmin, and N ′ min) for
these solutions. We find that rmin for the minimum and maximum SADs for Method 1
are essentially the same and the small particle size for the maximum SAD lies between 30 and 50 nm for most of the stratosphere. The large mode, rlmax, for the maximum
ACPD
7, 6959–6997, 2007 SAGE II measurements of stratospheric aerosol properties L. W. Thomason et al. Title Page Abstract Introduction Conclusions References Tables Figures ◭ ◮ ◭ ◮ Back CloseFull Screen / Esc
Printer-friendly Version Interactive Discussion
SAD in Method 2 is close to rmin from Method 1 particularly above 15 km. On the other hand the small mode particle radius, rsmax, is larger than rmaxfrom Method 1 and varies
from 60 to 100 nm in the stratosphere. For the minimum SAD for Method 2, rsmaxdoes
not contribute significantly to the total surface area density but uniformly selects the smallest allowed particle size. As a result, the Method 2 approach effectively selects a 5
single mode solution for minimum SAD and follows the argument made for the defini-tion of the Method 1 minimum SAD. For both methods, the number density of the large mode for both the minimum and maximum SAD is less than 1 cm−3 above 10 km and generally decreases with altitude. This result is consistent with past efforts to fit SAGE II extinctions with a priori size distribution models like the log-normal. In these efforts, 10
the size distributions were commonly very narrow and the derived number densities were often much smaller than ∼10 cm−3
measured by in situ instruments (e.g. Wang et al., 1989).
Obviously, the dependence of the maximum SAD model on a priori parameters plays a role in understanding the upper limit of SAD that can be computed from SAGE II ex-15
tinction coefficient measurements. For instance, doubling Ntotalto 40 cm −3
yields a 15 to 40% increase in both SADmaxand SADmin for Method 1 depending on altitude. The dependence is not linear since the increase in number density is in part compensated for by a reduction in the inferred particle size for the small mode aerosol. We find that including a third monodispersed mode never yields a significant third mode for either 20
the minimum or maximum SAD. These results make us confident that two monodis-persed modes are yielding the extreme results that we are seeking.
As an extension to this study, we have examined the impact of additional measure-ments on the range of surface area density possible from SAGE II measuremeasure-ments. In particular, we consider including a channel from the infrared where sulfate aerosol 25
strongly absorbs. In the infrared, provided that the refractive index of the aerosol is well known, the aerosol extinction coefficient is roughly proportional to aerosol volume den-sity for a broad range of aerosol sizes and as a result, insensitive to aerosol size. We have examined this effect using the SAGE II operational estimate of aerosol volume
ACPD
7, 6959–6997, 2007 SAGE II measurements of stratospheric aerosol properties L. W. Thomason et al. Title Page Abstract Introduction Conclusions References Tables Figures ◭ ◮ ◭ ◮ Back CloseFull Screen / Esc
Printer-friendly Version Interactive Discussion
with an uncertainty of 15% as a stand-in for an infrared measurement for use along with the 3 visible channel version of Method 2. Clearly, the SAD values determined from this experiment cannot be taken at face value. Nonetheless, as shown in Fig. 15, the range of SAD is reduced to a factor between 1.5 and 2 throughout the profile. From the values for rlmax and rlmin shown in Fig. 16, it is clear that the added information 5
strongly limits the size of the large particle mode and they are very similar from 12 to 25 km. The addition of the volume estimate also has a significant impact on the SADmincalculation and the small mode is now a significant element in the surface area calculation. While this experiment should be interpreted cautiously, it is not difficult to conclude that a mix of visible and infrared aerosol measurements would be a much 10
stronger measurement ensemble than either visible or infrared measurements alone.
6 Summary of aerosol surface area density study
The SAD inferred from SAGE II visible and near-infrared aerosol extinction coefficient measurements is mathematically unbound; however, modest physically-based restric-tions to the underlying particle number density reduces the range of SAD values for 15
background periods to a factor of 2 to 15 depending on altitude and assumptions re-garding the nature of the measurement uncertainty. It is important to remember that this range is the outcome of several unrealistic assumptions about the nature of the aerosol and the SAGE II measurements. However, this study helps to put a broad bracket around the range of SAD values that can be produced from SAGE II extinction 20
coefficient measurements. Method 1 is the most realistic in its treatment of the SAGE II measurements and measurement errors (forcing errors between channels to be cor-related) whereas Method 2 allows them to be completely uncorrelated. As a result, we believe that the maximum range of reasonable SAD values around the current opera-tional values is on the order of a factor of 2 for non-volcanic conditions. This factor is 25
comparable to or greater than the differences found between the operational SAGE II SAD and SAD measurements made by in situ measurements such as the University
ACPD
7, 6959–6997, 2007 SAGE II measurements of stratospheric aerosol properties L. W. Thomason et al. Title Page Abstract Introduction Conclusions References Tables Figures ◭ ◮ ◭ ◮ Back CloseFull Screen / Esc
Printer-friendly Version Interactive Discussion
of Wyoming Optical Particle Counter (e.g. Thomason and Peter 2006; Hervig et al., 2002). The SAD model described above may not provide reasonable limits in regions of the stratosphere where strong particle nucleation occurs such as the lower tropical stratosphere (Brock et al., 1995) or the polar winter middle stratosphere (Deshler et al., 2003) since number densities may be considerably larger than those considered here 5
though the SAGE II-measured extinctions remain valid. Also, it should also be noted that the relative difference between SADmin and SADmaxbecomes as small as 20% for
higher aerosol loading.
Acknowledgements. We are grateful for the support by SPARC/WCRP and for many helpful
discussions with the Lead Authors of SPARC’s Assessment of Stratospheric Aerosol Properties
10
(ASAP).
References
Anderson, S. M. and Mauersberger, K.: Laser measurements of ozone absorption cross sec-tions in the Chappuis band, Geophys. Res. Lett., 19, 933–936, 1992.
Anderson, S. M., Morton, J., and Mauersberger, K.: Near-infrared absorption spectra of 16O3
15
and 18O3: Adiabatic energy of the 1A2 state, J. Chem. Phys., 93, 3826–3832, 1990. Anderson, S. M., Maeder, J., and Mauersberger, K.: Effect of isotopic substitution on the visible
absorption spectrum of ozone, J. Chem. Phys., 94, 6351–6357, 1991.
Anderson, S. M., Hupalo, P., and Mauersberger, K.: Rotational structure in the near-infrared absorption spectrum of ozone, J. Chem. Phys., 99, 737–739, 1993a.
20
Anderson, S. M., Hupalo, P., and Mauersberger, K.: Ozone absorption cross section measure-ments in the Wulf bands, Geophys. Res. Lett., 20, 1579–1582, 1993b.
Bingen, C., Fussen, D., and Vanhellemont, F.: A global climatology of stratospheric aerosol size distribution parameters derived from SAGE II data over the period 1984–2000, 2. Reference data, J. Geophys. Res., 109, D06202, doi:10.1029/2003JD003511, 2004b.
25
Brock, C. A., Hamill, P., Wilson, J. C., Jonsson, H. H., and Chan, K. R.: Particle formation in the upper tropical troposphere: A source of nuclei for the stratospheric aerosol, Science, 270, 1650–1653, 1995.
ACPD
7, 6959–6997, 2007 SAGE II measurements of stratospheric aerosol properties L. W. Thomason et al. Title Page Abstract Introduction Conclusions References Tables Figures ◭ ◮ ◭ ◮ Back CloseFull Screen / Esc
Printer-friendly Version Interactive Discussion
Burkholder, J. B. and Talukdar, R. K.: Temperature dependence of the ozone absorption spec-trum over the wavelength range 410 to 760 nm, Geophys. Res. Lett., 21, 581–584, 1994. Deshler, T., Hervig, M. E., Hofmann, D. J., Rosen, J. M., and Liley, J. B.: Thirty years of in
situ stratospheric aerosol size distribution measurements from Laramie, Wyoming (41◦
N) using balloon-borne instruments, J. Geophys. Res., 108, 4167, doi:10.1029/2002JD002514,
5
2003.
Hervig, M. E. and Deshler, T.: Evaluation of aerosol measurements from SAGE II, HALOE, and balloonborne optical particle counters, J. Geophys. Res., 107(D3), 4031, doi:10.1029/2001JD000703, 2002.
Hervig, M. E. and Deshler, T.: Evaluation of aerosol measurements from SAGE
10
II, HALOE, and balloonborne optical particle counters, J. Geophys. Res., 107(D3), doi:10.1029/2001JD000703, 4031–4042, 2002.
Hofmann, D. J. and Rosen, J. M.: Antarctic observations of stratospheric aerosol and high altitude condensation nuclei following the El Chichon eruption, Geophys. Res. Lett., 12, 13– 16, 1985.
15
McCormick, M. P., Thomason, L. W., and Trepte, C. R.: Atmospheric effects of the Mount Pinatubo eruption, Nature, 373, 399–404, 1995.
Pitts, M. C. and Thomason, L. W.: The impact of the eruptions of Mount Pinatubo and Cerro Hudson on Antarctic aerosol levels during the 1991 austral spring, Geophys. Res. Lett., 20, 2451–2454, 1993.
20
Randel, W. J., Wu, F., and Gaffen, D.: Interannual variability of the tropical tropopause derived from radiosonde data and NCEP reanalyses, J. Geophys. Res., 105, 15 509–15 523, 2000. Russell, P. B., Livingston, J. M., Pueschel, R. F., Hughes, J. J., Pollack, J. B., Brooks, S. L.,
Hamill, P., Thomason, L. W., Stowe, L. L., Deshler, T., Dutton, E. G., and Berstrom, R. W.: Global to microscale evolution of the Pinatubo volcanic aerosol, derived from diverse
25
measurements and analyses, J. Geophys. Res., 101, 18 745–18 764, 1996.
Shettle, E. P. and Anderson, S. M.: New Visible and Near IR Ozone Cross Sections for MOD-TRAN, presented at the 17th Annual Review Conference on Atmospheric Transmission Mod-els, Phillips Laboratory, Bedford, MA, 7–8 June 1994.
Steele, H. M. and Hamill, P.: Effects of temperature and humidity on the growth and optical
30
properties of sulfuric acid-water droplets in the stratosphere, J. Aerosol Sci., 12, 517–528, 1981.
Steele, H. M. and Turco, R. P.: Retrieval of aerosol size distributions from satellite extinction
ACPD
7, 6959–6997, 2007 SAGE II measurements of stratospheric aerosol properties L. W. Thomason et al. Title Page Abstract Introduction Conclusions References Tables Figures ◭ ◮ ◭ ◮ Back CloseFull Screen / Esc
Printer-friendly Version Interactive Discussion
spectra using constrained linear inversion, J. Geophys. Res., 102, 16 737–16 747, 1997. Thomason, L. W., Kent, G. S., Trepte, C. R., and Poole, L. R.: A comparison of the stratospheric
aerosol background periods of 1979 and 1989–1991, J. Geophys. Res., 102, 3611–3616, 1997a.
Thomason, L. W., Poole, L. R., and Deshler, T. R.: A global climatology of stratospheric aerosol
5
surface area density as deduced from SAGE II: 1984–1994, J. Geophys. Res., 102, 8967– 8976, 1997b.
Thomason, L. W. and Peter, T. (Eds.): Assessment of Stratospheric Aerosol Properties (ASAP), SPARC Report No. 4, WCRP-124, WMO/TD-No. 1295,http://www.atmosp.physics.
ca/SPARC/, February 2006.
10
Trepte, C. R., Thomason, L. W., and Kent, G. S.: Banded structures in stratospheric aerosol distributions, Geophys. Res. Lett., 22, 2397–2400, 1994.
Wang, P. H., McCormick, M. P., McMaster, L. R., Chu, W. P., Swissler, T. J., Osborn, M. T., Russell, P. B., Oberbeck, V. R., Livingston, J., Rosen, J. M. , Hofmann, D. J., Grams, G. W., Fuller, W. H., and Yue, G. K.: SAGE II aerosol data validation based on retrieved aerosol
15
model size distribution from SAGE II aerosol measurements, J. Geophys. Res., 94, 8381– 8393, 1989.
Wang H. J., Cunnold, D. M., Thomason, L. W., Zawodny, J. M., and Bodeker, G. E.: As-sessment of SAGE version 6.1 ozone data quality, J. Geophys. Res., 107(D22), 4691, doi:10.1029/2002JD002418, 2002.
20
Yue, G. K.: A new approach to retrieval of aerosol size distributions and integral properties from SAGE II aerosol extinction spectra, J. Geophys. Res., 104, 27 491–27 506, 1999.
ACPD
7, 6959–6997, 2007 SAGE II measurements of stratospheric aerosol properties L. W. Thomason et al. Title Page Abstract Introduction Conclusions References Tables Figures ◭ ◮ ◭ ◮ Back CloseFull Screen / Esc
Printer-friendly Version Interactive Discussion 1979 1983 1987 1991 1995 1999 2003 2005 80S 60S 40S 20S EQ 20N 40N 60N 80N St. Helens El Chichon Ruiz Kelut Pinatubo Hudson 0.2 0.1 0.01 0.001 0.0006 Year 0.002 0.004 0.006 0.02 0.04 0.06 0.008 0.08 R Ruang/Reventador R
Fig. 1. The 1020-nm stratospheric optical depth from SAM II, SAGE, SAGE II and SAGE III
for the period from January 1979 through the end of 2004. Between the June 1991 Pinatubo eruption and mid 1993, aerosol extinction coefficient profiles are supplemented by lidar data following the method described in Thomason and Peter (2006).
ACPD
7, 6959–6997, 2007 SAGE II measurements of stratospheric aerosol properties L. W. Thomason et al. Title Page Abstract Introduction Conclusions References Tables Figures ◭ ◮ ◭ ◮ Back CloseFull Screen / Esc
Printer-friendly Version Interactive Discussion 0.0 0.5 1.0 1.5 2.0 0.0 0.5 1.0 1.5 2.0 Ex tinc tion 0.0 0.2 0.4 0.6 0.8 1.0 0.0 0.1 0.2 0.3 0.4 0.5 0 2 4 6 Ex tinc tion Ex tinc tion Ex tinc tion Ex tinc tion (a) 1020 nm, 18 km (b) 1020 nm, 22 km (c) 1020 nm, 26 km (d) 1020 nm, 30 km (e) 525 nm, 18 km 1998 2000 2002 2004 Year
Fig. 2. SAGE II stratospheric 1020-nm aerosol extinction coefficient (in units of km−1) for alti-tudes of 18 (a), 22 (b), 26 (c) and 30 km (d) between 10◦
N and 10◦
S for the years 1998 through 2003. In addition, 525-nm aerosol extinction variability is shown in frame (e). The effects of the eruptions of Ruang and Reventador in late 2002 can be seen at 18 km. Dashed vertical lines show 1 January of each year. Horizontal block arrows in (d) show easterly QBO as given by zonal winds at 50 hPa over Singapore.
ACPD
7, 6959–6997, 2007 SAGE II measurements of stratospheric aerosol properties L. W. Thomason et al. Title Page Abstract Introduction Conclusions References Tables Figures ◭ ◮ ◭ ◮ Back CloseFull Screen / Esc
Printer-friendly Version Interactive Discussion
1985
1990
1995
2000
Year
2000
2500
3000
3500
4000
I
0C
ounts
1, 1020 nm 2, 940 nm 3, 600 4, 525 nm 5, 453 nm 6, 448 nm 7, 386 nmFig. 3. SAGE II exoatmospheric counts for channels 1 through 7 through the lifetime of the
instrument. The channels have central wavelengths of 1020, 940, 600, 525, 453, 448, and 386 nm, respectively. The lines are labeled with channel number followed by central wave-length.
ACPD
7, 6959–6997, 2007 SAGE II measurements of stratospheric aerosol properties L. W. Thomason et al. Title Page Abstract Introduction Conclusions References Tables Figures ◭ ◮ ◭ ◮ Back CloseFull Screen / Esc
Printer-friendly Version Interactive Discussion
0 500 1000 1500 2000 2500 3000
Counts (minus background) 0 10 20 30 40 50 60 Altitude (km)
Fig. 4. Instrument counts, minus background, for the center 90% of the sun, as a function of
altitude, for an event which occurred on December 19, 2003 at 21.1◦
N, 142.0◦
E.
ACPD
7, 6959–6997, 2007 SAGE II measurements of stratospheric aerosol properties L. W. Thomason et al. Title Page Abstract Introduction Conclusions References Tables Figures ◭ ◮ ◭ ◮ Back CloseFull Screen / Esc
Printer-friendly Version Interactive Discussion Average of 2003, latitude 20 +- 10
0.0
0.2
0.4
0.6
0.8
1.0
Aerosol Fraction of 1020-nm LOS Optical Depth
15
20
25
30
35
40
Altitude (km)
Fig. 5. Fraction of the measured slant path optical depth in the 1020-nm channel that is
at-tributed to aerosol. All events between 10◦
N and 30◦
N in 2003 are included in the average shown here. Under the conditions of interest the H2SO4-H2O aerosol is expected to fully evap-orate at temperatures above ∼238 K, corresponding to altitudes between 35 km and 40 km.
ACPD
7, 6959–6997, 2007 SAGE II measurements of stratospheric aerosol properties L. W. Thomason et al. Title Page Abstract Introduction Conclusions References Tables Figures ◭ ◮ ◭ ◮ Back CloseFull Screen / Esc
Printer-friendly Version Interactive Discussion Dark count +1 at 525 nm
-10 0 10
Percent diff (exp-std)/mean 15 20 25 30 35 40 Altitude (k m) Dark count +1 at 1020 nm -10 0 10
Percent diff (exp-std)/mean 15 20 25 30 35 40 Altitude (k m) (a) (b)
Fig. 6. Effect on the ratio of 525 nm to 1020 nm aerosol extinction of increasing the number of
counts subtracted from the signal to correct for dark current. The plot shows the percent differ-ence of the means of multiple processed events, with the sense (exp-std)/mean×100% where exp and std refer to the perturbed subtraction and the assumed-correct subtraction, respec-tively, and the mean is (std+exp)/2. The occultation events included are those between 10◦
N and 30◦
N latitude in the year from October 2001 to September 2002. Panel (a): experimental perturbation applied to the 1020 nm channel. Panel (b): the same for the 525 nm channel.
ACPD
7, 6959–6997, 2007 SAGE II measurements of stratospheric aerosol properties L. W. Thomason et al. Title Page Abstract Introduction Conclusions References Tables Figures ◭ ◮ ◭ ◮ Back CloseFull Screen / Esc
Printer-friendly Version Interactive Discussion 15 20 25 30 35 40 Altitude (k m) -10 0 10 Diference (%) (exp-std)/mean -10 0 10 Diference (%) (exp-std)/mean -10 0 10 Diference (%) (exp-std)/mean 15 20 25 30 35 40 15 20 25 30 35 40 up down up down up down (a) (b) (c)
Fig. 7. Effect of a shift in the altitude registration upward (solid lines) or downward (dashed):
difference in percent between shifted and unshifted aerosol extinctions are shown in percent for 1020-nm aerosol extinction (a), 525-nm aerosol extinction (b) and the ratio of 525-nm/1020-nm extinction (c). The sense of the percent difference is (experimental-standard)/mean where ex-perimental is the mean of all the perturbed measurements, standard is the mean of unperturbed measurements and mean is (experimental+standard)/2. The occultation events included are those between 10◦
N and 30◦
N for the year from October 2001 to September 2002 removing measurements that appear to have been contaminated by clouds.
ACPD
7, 6959–6997, 2007 SAGE II measurements of stratospheric aerosol properties L. W. Thomason et al. Title Page Abstract Introduction Conclusions References Tables Figures ◭ ◮ ◭ ◮ Back CloseFull Screen / Esc
Printer-friendly Version Interactive Discussion 15 20 25 30 35 40 Altitude (k m) -10 0 10 Diference (%) (exp-std)/mean -10 0 10 Diference (%) (exp-std)/mean -10 0 10 Diference (%) (exp-std)/mean 15 20 25 30 35 40 15 20 25 30 35 40 15 20 25 30 35 40 Altitude (k m) -10 0 10 Diference (%) (exp-std)/mean -10 0 10 Diference (%) (exp-std)/mean -10 0 10 Diference (%) (exp-std)/mean 15 20 25 30 35 40 15 20 25 30 35 40 +3 K -3 K +3 K -3 K +3 K -3 K +3 K -3 K +3 K -3 K +3 K -3 K 100 mb 10 mb (a) (b) (c) (d) (e) (f )
Fig. 8. Panels (a), (b), and (c) show the result of perturbing the input temperature value at
100 mb by 3 K (solid lines) and –3 K (dashed). Percent differences for the 1020-nm extinction (a), 525-nm extinction (b) and 525-nm/1020-nm ratio (c) are (experimental - standard)/mean with the meanings as in Fig. 6. Same suite of measurements and cloud clearing is also the same as in Fig. 6. Panels (d), (e), and (f): same at the 10 mb level.
ACPD
7, 6959–6997, 2007 SAGE II measurements of stratospheric aerosol properties L. W. Thomason et al. Title Page Abstract Introduction Conclusions References Tables Figures ◭ ◮ ◭ ◮ Back CloseFull Screen / Esc
Printer-friendly Version Interactive Discussion Perturb O3 cross section at 525 nm by 1%
-30 -10 0 10 30 15 20 25 30 35 40 Altitude (k m) -30 -10 0 10 30 Difference (%) (exp-std)/mean Difference (%) (exp-std)/mean -30 -10 0 10 30 Difference (%) (exp-std)/mean 1020 nm 525 nm Extinction Ratio 15 20 25 30 35 40 15 20 25 30 35 40 -30 -10 0 10 30 Difference (%) (exp-std)/mean -30 -10 0 10 30 Difference (%) (exp-std)/mean -30 -10 0 10 30 Difference (%) (exp-std)/mean 15 20 25 30 35 40 Altitude (k m) 15 20 25 30 35 40 15 20 25 30 35 40 Perturb O3 cross section at 600 nm by 1%
Extinction Ratio 525 nm
1020 nm
(a) (b) (c)
(d) (e) (f )
Fig. 9. This figure shows the effect of perturbing the ozone cross section at 525 nm (panels a, b, and c) and separately at 600 nm (panels d, e, and f) by 1%. The effects on the 1020-nm
aerosol extinction measurement (a and d), 525-nm aerosol extinction measurement (b and e) and the ratio (c and f) are shown. Details of the experiments are otherwise the same as Figs. 6, 7, 8, and 9. Note the range of the abscissa has been increased on these plots compared to previous figures.
ACPD
7, 6959–6997, 2007 SAGE II measurements of stratospheric aerosol properties L. W. Thomason et al. Title Page Abstract Introduction Conclusions References Tables Figures ◭ ◮ ◭ ◮ Back CloseFull Screen / Esc
Printer-friendly Version Interactive Discussion 0.01 0.10 1.00 10.00 Radius (μ m) 0 1 2 3 4 5 1 2 3 4 5 6 Extinction Ratio 0.0 0.2 0.4 0.6 0.8 1.0 Radius ( μ m) (a) (b) 3λ Q( λ, r)/4 r
Fig. 10. (a) Extinction kernels for SAGE II aerosol extinction channels at 385 (left-most), 452,
525, and 1020 nm (right-most) for spherical water/sulfuric acid drops at stratospheric tempera-tures. (b) Particle radius as a function of the 525-nm channel to the 1020-nm extinction kernel ratio (or extinction coefficient ratio for a monodispersed aerosol).
ACPD
7, 6959–6997, 2007 SAGE II measurements of stratospheric aerosol properties L. W. Thomason et al. Title Page Abstract Introduction Conclusions References Tables Figures ◭ ◮ ◭ ◮ Back CloseFull Screen / Esc
Printer-friendly Version Interactive Discussion
EGU
10-6 10-5 10-4 10-3 10-2
Aerosol Extinction Coefficient (km-1)
5 10 15 20 25 30 Altitude (km)
Fig. 11. Mean Northern midlatitude SAGE II aerosol extinction coefficient profiles for April 2001
for 1020 (solid), 525 (dotted), and 452 nm (dashed).
ACPD
7, 6959–6997, 2007 SAGE II measurements of stratospheric aerosol properties L. W. Thomason et al. Title Page Abstract Introduction Conclusions References Tables Figures ◭ ◮ ◭ ◮ Back CloseFull Screen / Esc
Printer-friendly Version Interactive Discussion
EGU
0.1 1.0 10.0
Surface Area Density 5 10 15 20 25 30 Altitude (km)
Fig. 12. This figure shows a comparison of the operational SAGE II SAD (black) and the SAD
computed using Method 1 and 525-nm (red) and 452-nm (green) as the low wavelength aerosol extinction coefficient channel.
ACPD
7, 6959–6997, 2007 SAGE II measurements of stratospheric aerosol properties L. W. Thomason et al. Title Page Abstract Introduction Conclusions References Tables Figures ◭ ◮ ◭ ◮ Back CloseFull Screen / Esc
Printer-friendly Version Interactive Discussion
EGU
0.1 1.0 10.0
Surface Area Density 5 10 15 20 25 30 Altitude (km)
Fig. 13. This figure shows the comparison of operational SAGE II SAD (black) with the Method 1 minimum and maximum SAD using 525-nm aerosol extinction coefficient (red) and the minimum and maximum Method 2 SAD using 2 channels at 525 and 1020 nm channels (blue) and 3 channels at 452, 525, and 1020 nm (gold).
ACPD
7, 6959–6997, 2007 SAGE II measurements of stratospheric aerosol properties L. W. Thomason et al. Title Page Abstract Introduction Conclusions References Tables Figures ◭ ◮ ◭ ◮ Back CloseFull Screen / Esc
Printer-friendly Version Interactive Discussion EGU 0.0 0.1 0.2 0.3 0.4 0.5 Radius (microns) 5 10 15 20 25 30 Altitude (km) 0.0 0.5 1.0 1.5 2.0 2.5
Large Mode Number Density (cm-3) 5 10 15 20 25 30 Altitude (km) (a) (b) rlmax rsmax rlmin rsmin rmax r'min rmin N'min Nmin N2
Fig. 14. This figure shows the profiles of the Method 1 dependent parameters rmin, rmax, and
r′
min(on frame a) and Nmin and N ′
min(b) in red. In addition, it shows Method 2 free parameters
rlmax, rlmin, rsmax, and rsmin(a) and N2for the maximum SAD (solid) and for the minimum SAD (dashed) in gold.
ACPD
7, 6959–6997, 2007 SAGE II measurements of stratospheric aerosol properties L. W. Thomason et al. Title Page Abstract Introduction Conclusions References Tables Figures ◭ ◮ ◭ ◮ Back CloseFull Screen / Esc
Printer-friendly Version Interactive Discussion
EGU
0.1 1.0 10.0
Surface Area Density 5 10 15 20 25 30 Altitude (km)
Fig. 15. This figure shows the comparison of operational SAGE II SAD (black) with the Method 1 SAD using 525-nm aerosol extinction coefficient (red) and the Method 2 SAD us-ing the 525 and 1020 nm channels (gold) and the Method 2 SAD computed usus-ing the channels at 525 and 1020 nm plus a pseudo-infrared channel (grey).