HAL Id: hal-00317044
https://hal.archives-ouvertes.fr/hal-00317044
Submitted on 1 Jan 2003
HAL is a multi-disciplinary open access
archive for the deposit and dissemination of
sci-entific research documents, whether they are
pub-lished or not. The documents may come from
teaching and research institutions in France or
abroad, or from public or private research centers.
L’archive ouverte pluridisciplinaire HAL, est
destinée au dépôt et à la diffusion de documents
scientifiques de niveau recherche, publiés ou non,
émanant des établissements d’enseignement et de
recherche français ou étrangers, des laboratoires
publics ou privés.
The dependence of cusp ion signatures on the
reconnection rate
S. K. Morley, M. Lockwood
To cite this version:
S. K. Morley, M. Lockwood. The dependence of cusp ion signatures on the reconnection rate. Annales
Geophysicae, European Geosciences Union, 2003, 21 (4), pp.947-953. �hal-00317044�
Annales
Geophysicae
The dependence of cusp ion signatures on the reconnection rate
S. K. Morley1and M. Lockwood1, 2
1Department of Physics and Astronomy, University of Southampton, UK
2Rutherford Appleton Laboratory, Chilton, Oxfordshire, UK
Received: 17 December 2001 – Revised: 30 August 2002 – Accepted: 18 September 2002
Abstract. The interpretation of structure in cusp ion
disper-sions is important for helping to understand the temporal and spatial structure of magnetopause reconnection. “Stepped” and “sawtooth” signatures have been shown to be caused by temporal variations in the reconnection rate under the same physical conditions for different satellite trajectories. The present paper shows that even for a single satellite path, a change in the amplitude of any reconnection pulses can alter the observed signature and even turn sawtooth into stepped forms and vice versa. On 20 August 1998, the Defense Me-teorological Satellite Program (DMSP) craft F-14 crossed the cusp just to the south of Longyearbyen, returning on the following orbit. The two passes by the DMSP F-14 satel-lites have very similar trajectories and the open-closed field line boundary (OCB) crossings, as estimated from the SSJ/4 precipitating particle data and Polar UVI images, imply a similarly-shaped polar cap, yet the cusp ion dispersion sig-natures differ substantially. The cusp crossing at 08:54 UT displays a stepped ion dispersion previously considered to be typical of a meridional pass, whereas the crossing at 10:38 UT is a sawtooth form ion dispersion, previously con-sidered typical of a satellite travelling longitudinally with re-spect to the OCB. It is shown that this change in dispersed ion signature is likely to be due to a change in the amplitude of the pulses in the reconnection rate, causing the stepped signa-ture. Modelling of the low-energy ion cutoff under different conditions has reproduced the forms of signature observed.
Key words. Ionosphere (particle precipitation)
Magneto-spheric physics (energetic particles, precipitating, magneto-pause, cusp and boundary layers)
1 Introduction
The origin of cusp ion dispersion signatures has been dealt with for observing satellites over a range of altitudes. In this
Correspondence to: S. Morley (skm@phys.soton.ac.uk)
paper we shall be concentrating on low-altitude satellite ob-servations.
1.1 Cusp ion dispersion signatures
During sub-solar reconnection under southward IMF
(Bz < 0), newly-opened field lines allow particles from
the magnetosheath to precipitate through the magnetospheric cusps into the ionosphere. The velocity dispersion as the par-ticles travel along field-lines from the point of particle in-jection means that the more energetic particles of any one species will reach the ionosphere before the less energetic particles. The lowest energy ions measured at any point are, therefore, from the point of reconnection of that field line. This means that the low-energy ion cutoff is directly related to the time elapsed since reconnection. On the boundaries be-tween regions of newly-opened flux, a discontinuity will be observed if the reconnection is pulsed. The form that the cusp ion dispersion will take in low-altitude satellite observations has been modelled by Lockwood and Davis (1996), showing that near-normal (meridional) and near-tangential (longitu-dinal) satellite crossings of the OCB give rise to markedly different signatures. As the OCB is usually roughly L-shell aligned these near-normal and near-tangential crossings are meridional and longitudinal in nature. Under pulsed recon-nection conditions, the model predicts that a meridional pass will measure a stepped ion signature, as reported by Newell and Meng (1991) and by Lockwood et al. (1993), whereas a longitudinal crossing will measure a sawtooth ion signature, as reported by Pinnock et al. (1995).
1.2 Boundary definitions
A common point of contention in current literature is the identification of the open-closed field line boundary (OCB). Here we define the polar cap as comprising of open field-lines connected to the IMF, hence bounded by the OCB, but there are difficulties in locating the OCB using different types of data. For this reason there are many “working definitions” of the polar cap boundary, including the auroral oval
bound-948 S. Morley and M. Lockwood: The dependence of cusp ion signatures on reconnection rate aries. Even here there is ambiguity as optical observations
will give different boundaries, dependent on wavelength and intensity threshold, when compared with particle precipita-tion. There have been a number of studies linking the pole-ward auroral emission (PAE) boundary with the polar cap boundary (Elphinstone et al., 1990; Brittnacher et al., 1999) and while there are still many questions regarding the valid-ity of this technique, the correlation between DMSP and UVI poleward auroral oval boundaries is generally good (Ger-many et al., 1997; Kauristie et al., 1999; Baker et al., 2000). On the dayside, separations between the OCB and the PAE tend to be small.
Sotirelis et al. (1998) have attempted to determine the shape of the OCB from just DMSP precipitating particle data, but had difficulties because the OCB shape is variable on much shorter temporal and spatial scales than the sepa-ration of the DMSP satellite passes in time and space, par-ticularly under substorm conditions. Importantly, the low-latitude boundary layer was taken as being inconsequential to their results, because it was assumed that it was of small and constant latitudinal extent – especially near magnetic noon. The responses of the convection reversal boundary (CRB) and the pattern of convection, in general, to IMF conditions have also been well studied (Cowley and Lockwood, 1992; Lester et al., 1995; McCrea et al., 2000). However, identifica-tion of the OCB from the CRB is difficult due to the variable offsets due to viscous-like momentum transfer to closed field lines and spatial gradients in ionospheric conductivities.
2 Data sets
2.1 DMSP SSJ/4 spectrograms
The Defense Meteorological Satellite Program (DMSP) op-erates several satellites, each equipped with identical low-and high-energy SSJ/4 precipitating particle detectors. These instruments measure electron and ion flux in logarithmically spaced energy bins from 30 eV to 1 keV and 1 keV to 30 keV – the redundancy at 1 keV is used for cross-calibration of the low- and high-energy detectors. The satellites have a polar, sun-synchronous orbit at a height of ∼840 km with an orbital period of ∼102 min.
The DMSP electron precipitation could be used to define the dayside OCB as the poleward edge of the full magne-tosheath population. This assumes that magnetospheric elec-trons flow sufficiently rapidly across the magnetopause along newly-opened field lines into the magnetosheath, such that the offset caused by field line convection in the electrons’ time-of-flight can be neglected. At almost the same loca-tion, the satellite should observe the equatorward edge of magnetosheath-like electrons that have flowed into the mag-netosphere along the newly-opened field lines. Sometimes these signatures overlap, which may indicate an unknown mechanism is injecting sheath electrons onto closed LLBL field lines – placing the OCB at the poleward edge of the magnetospheric electrons. Alternatively, the magnetospheric
−10 −5 0 5 10 IMF B x [nT]
ACE Solar Wind Parameters, 20 August 1998
−10 −5 0 5 10 IMF B y [nT] −10 −5 0 5 10 IMF B z [nT] 0 10 20 30 Density [cc − 1] 5 6 7 8 9 10 11 320 340 360 Velocity [km s − 1]
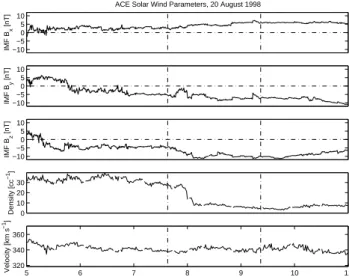
Fig. 1. IMF Bx (top panel), By (middle panel) and Bz (bottom
panel) data taken by the MAG instrument on board ACE for 20 August 1998. The vertical marks at 07:38 and 09:22 UT correspond to the lagged times of the DMSP cusp crossings at 08:54 UT and 10:38 UT, respectively.
electrons may have been prevented from escaping along open field-lines by a magnetic bottle or a potential drop or may have gradient-B and/or curl-B drifted from closed to open field lines – in which case the OCB is at the equatorward edge of the sheath electrons and the LLBL is open (Lock-wood, 1997). In addition, a lack of substorm activity over the previous hours may have caused the energetic magneto-spheric electron fluxes to have fallen to values below the in-strument one-count level on some L-shells. Thus, their pole-ward edge is not always a reliable indicator of the OCB and is not used here. The satellite positions have been transformed to MLat/MLT coordinates using the Tsyganenko T89 mag-netic field model with a standard reference height of 840 km. Ion precipitation signatures have been shown to depend on the angle at which the satellite traverses the OCB (Lockwood and Davis, 1996), but we show that these signatures also de-pend on the convection velocity and reconnection rate.
This paper examines an event with the observed charac-teristic of a stepped ion dispersion followed by a sawtooth ion dispersion, and shows how these dispersions can be in-terpreted in terms of pulsed reconnection. The 20 August 1998 event was observed during consecutive cusp crossings by the DMSP F-14 craft at ∼08:54 UT and ∼10:38 UT, re-spectively.
2.2 Interplanetary conditions
The interplanetary conditions for the period under study (see Fig. 1) have been taken from the ACE satellite which is
up-stream of the Earth, along the Sun-Earth line at (XGSE =
248 RE, YGSE = 12 RE, ZGSE = 24 RE, where 1 RE is a
mean Earth radius; 6370 km). For this location we can be reasonably confident that most changes in IMF orientation measured by ACE will interact with the Earth. The time lag
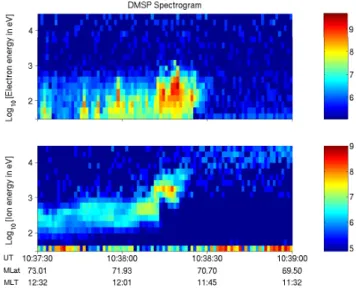
Fig. 2. Energy-time electron and ion spectrogram observed by DMSP F-14 on 20 August 1998, with the cusp crossing from 08:53:36–08:54:09 UT.
from ACE to Earth for this event is estimated from the solar wind speed to be 76 min. A southward turning of the IMF occurred at 05:18 UT. From about 04:30 UT to 08:00 UT the solar wind density was enhanced to an above average value
of np ∼37 cm−3. For the remainder of the period the IMF
was strongly southward (Bz = −5 to −10 nT), with strong
and consistently negative IMF By. The solar wind speed was
∼345 km s−1; this remained fairly constant throughout the
interval. The vertical dot-dash lines in Fig. 1 are at the lagged times of the two DMSP crossings studied in this paper. The
IMF By component is similar in the two cases (∼ − 5 nT),
but the Bz component is roughly twice as large for the
sec-ond pass (∼ − 8 nT with ∼ − 4 nT for the first pass). Though the solar wind speed is roughly the same in the two cases,
the concentration, np, is much lower (∼5 cm−3, compared to
∼30 cm−3for the first pass).
The AE index (data not shown) shows a period of sub-storm growth from roughly 06:36 UT. This corresponds to the arrival at Earth of the southward IMF seen at ACE at about 05:18 UT and thus estimated to arrive at the magneto-sphere at about 06:34 UT, confirming the propagation lag of 76 min.
3 Results
Energy-time spectrograms are presented in Figs. 2 and 3 for both electrons and ions, as observed by DMSP F-14. In these plots the differential energy flux is plotted both as a function of energy and time of observation.
On 20 August 1998, the DMSP F-14 satellite crossed the cusp just to the south of Longyearbyen, returning on the fol-lowing orbit to similar (MLT, MLat) coordinates. In both these passes, energetic magnetospheric electron fluxes were too low to show any OCB signature, which is, therefore,
Fig. 3. Energy-time electron and ion spectrogram observed by
DMSP F-14 on 20 August 1998, with the cusp crossing from 10:38:12–10:38:27 UT. 80 70 60 06 MLT 18 MLT 12 MLT 00 MLT
Fig. 4. Trajectories of DMSP F-14 on successive orbits, mapped in
invariant latitude (MLAT) and magnetic local time (MLT). The blue track corresponds to the first satellite pass, the red track corresponds to the second satellite pass. The triangles mark the OCB boundaries as defined in precipitating particle data.
clearest in the sheath electron data. The orbit paths for these cusp passes are shown in Fig. 4. The cusp crossings were from 08:53:36–08:54:09 UT and 10:38:12–10:38:27 UT, re-spectively. The poleward emission boundary was observed by the UVI instrument on Polar (see Fig. 5) to move
equator-ward from about 74.3◦to 71.4◦MLat. The OCB determined
from the equatorward edge of sheath electrons seen by F-14
was at 73.7◦MLat and 70.9◦MLat for the two passes,
indi-cating an overlap of about 0.5◦in both cases. The electrons
causing this overlap were not seen by the DMSP satellites (either because they were of too low a flux or because they were at energies above 30 keV and thus out of the range of the
950 S. Morley and M. Lockwood: The dependence of cusp ion signatures on reconnection rate
Fig. 5. Plots of the Polar UVI data at 08:59, 09:11, 10:39 and 10:48 UT, mapped in invariant latitude (MLat) and magnetic local time (MLT).
The green line indicates the approximate field-of-view.
instrument). We can conclude that the LLBL, be it open or
closed, was only about 0.5◦in latitudinal width. As the orbit
precession is extremely slow, the satellite trajectory in each case is very similar. Both cusp crossings display structure in the ion dispersions, the first crossing exhibiting a stepped sig-nature and the second crossing displaying a sawtooth signa-ture. For the first pass upward steps are seen at 08:53:42 and 08:53:56 UT, and these are separated by upward dispersion ramps, a “stepped” signature. For the later pass an upward step is again observed at 10:38:13 UT. However, the disper-sion ramp after this step is downward, giving a “sawtooth” appearance.
4 Discussion
We have presented two satellite passes with similar trajec-tories but with clearly different cusp ion dispersions. The IMF was southward in both cases. Following Lockwood and Davis (1996) we have searched for a change in the OCB ori-entation that could explain this. In the time between the two
DMSP passes, the IMF By has become slightly more
neg-ative, opening the possibility of an asymmetric expansion of the polar cap favouring the dusk sector. As the required
change in orientation of the OCB is anti-clockwise, and a
negative By shift will tend to drag the merging gap
dawn-wards – hence clockwise – any such shift cannot provide the explanation. Though the field-of-view of UVI is limited at this time (see Fig. 5), inspection of UVI images shows no evidence of the OCB orientation change needed.
The observed density enhancement, when lagged to find the time of arrival at Earth, begins over 3 h before the
first pass. The density then drops from about 30 cm−3, at
07:53 UT, to about 5 cm−3, at 08:07 UT (lagged times of
09:09 UT and 09:23 UT) – over an hour before the second pass. Any temporal effects with a causal link to the density drop will have dissipated by this time, so they will not affect the form of the signature observed. It can be seen, however, that the ion flux levels are somewhat lower in the second pass – consistent with this density change.
Structured cusp ion dispersions as a result of pulsed re-connection from an extended X-line have been modelled by Lockwood and Davis (1996), showing that different satellite trajectories can give rise to different ion dispersion signatures for the same reconnection conditions. The conditions for ob-serving a stepped or sawtooth signature are dependent on the ratio of the satellite and boundary velocities (as this is treated
500 600 700 800 900 1000 1100 1200 0 5 10 Reconnection rate [mV m −1] 500 600 700 800 900 1000 1100 1200 −10 −5 0 x 105 Poleward displacement [m] 500 600 700 800 900 1000 1100 1200 0 1 2 3 4
Time of observation [sec]
Log
10
[E
ic
in eV]
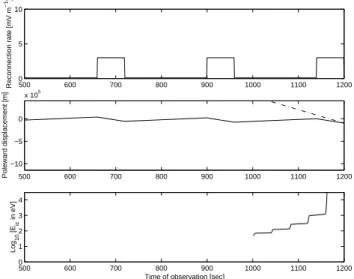
Fig. 6. A three-panel plot of: the input reconnection rate for the
model under pulsed reconnection; relative positions of the satellite (dash-dot line) and OCB (solid line); and the modelled low-energy ion cutoff as observed within the energy range of the DMSP satel-lites. The model is using a 1-minute reconnection pulse within a 4-min cycle. Pulse reconnection rate, εp = 3 mV m−1;
Back-ground reconnection rate, εb = 0.01 mV m−1; Satellite velocity, Vs =3 km s−1. 500 600 700 800 900 1000 1100 1200 0 5 10 Reconnection rate [mV m −1 ] 500 600 700 800 900 1000 1100 1200 −10 −5 0 x 105 Poleward displacement [m] 500 600 700 800 900 1000 1100 1200 0 1 2 3 4
Time of observation [sec]
Log
10
[E
ic
in eV]
Fig. 7. Same as Fig. 6, but for εp=8 mV m−1.
in 1-D, i.e. there is longitudinal symmetry, all velocities are considered normal to the merging gap) and are summarised here.
For a satellite moving poleward with the field lines (i.e. it is at rest in the de Hoffman-Teller frame), a steady-state dis-persion will be observed, even though the reconnection rate is pulsed, because the satellite stays with the same newly-opened field line. If the satellite velocity exceeds the con-vection velocity significantly, a stepped signature will result. Similarly, if the convection velocity is much greater than the satellite velocity, then a sawtooth signature is observed, even
500 600 700 800 900 1000 1100 1200 0 5 10 Reconnection rate [mV m −1] 500 600 700 800 900 1000 1100 1200 −10 −5 0 x 105 Poleward displacement [m] 500 600 700 800 900 1000 1100 1200 0 1 2 3 4
Time of observation [sec]
Log
10
[E
ic
in eV]
Fig. 8. Same as Fig. 7, but for Vs=7 km s−1.
though the reconnection behaviour in space and time is the same. The plots presented here take equatorward erosion of the OCB into account and show how a variation in the recon-nection rate can give both sawtooth and stepped signatures for identical satellite trajectories. The convection velocity is dependent on the average reconnection rate, as is the overall boundary drift.
If the satellite moves equatorward across the OCB (e.g. DMSP in the dayside Northern Hemisphere), then a stepped ion signature will be seen if the satellite boundary-normal velocity is greater than (or equal to) the boundary-normal speed of equatorward erosion. In this case the satellite will be moving from older flux tubes to more recently opened flux tubes. For the case of the satellite velocity being less than the erosion velocity, the relatively rapid erosion of the boundary means that the satellite can move onto a flux-tube that has been open for longer than the one it just left, hence a saw-tooth signature is seen.
Lockwood and Davis (1996) considered the case of the same reconnection history and two different pass orientations relative to the OCB. Here we extend the analysis by consid-ering different reconnection rate variations but the same pass orientation relative to the OCB. We have made calculations using a 1-D simulation of OCB dynamics under pulsed re-connection. The low-energy ion cutoff at the satellite is cal-culated as a function of observation time. The input recon-nection rate behaviour can be pulsed and can include back-ground reconnection between pulses. For the purposes of this paper convective flow is assumed to be constant during reconnection pulses (which have an assumed square-wave form). In other words, the pulses are inductively smoothed.
The OCB motion can be described as a sum of
boundary-normal flow velocities. The boundary velocity, Vb, is
gov-erned by the reconnection rate, ε, and the convection
veloc-ity, Vc(Lockwood and Smith, 1992):
952 S. Morley and M. Lockwood: The dependence of cusp ion signatures on reconnection rate
where V0 is the flow speed across the OCB in its own rest
frame, (dy0/dy)is the mapping factor between the length of
the reconnection X-line and its ionospheric projection and Bi
is the ionospheric magnetic field strength.
Between the cusp crossings by the DMSP satellite the IMF
Bzcomponent became more negative, suggesting a possible
cause for the increased rate of reconnection. The average reconnection voltage is known to be dependent on the
mag-nitude of Bz(Reiff et al., 1981; Freeman et al., 1993; Fedder
et al., 1991). This can occur because the X-line becomes longer or because the reconnection rate increases, or both.
The model predictions of Lockwood and Davis (1996) for the cusp ion dispersion signatures observed by satellites trav-elling meridionally and longitudinally, relative to the OCB can be reproduced in form by assuming a variation in recon-nection rate (see Figs. 6 and 7). The key factor is the ratio
of boundary-normal satellite velocity, Vs, to the equatorward
boundary velocity, Vb. Changing the satellite trajectory will
affect Vs, possibly affecting the observed cusp ion signature.
However, if the rate of reconnection is varied, the conditions for the observation of these signatures can be met. The sig-natures calculated here are longer than is typically observed. Sawtooth signatures tend to be observed over greater periods, as they are generally associated with a skimming of the OCB. These have been observed to last for several hundred seconds (Pinnock et al., 1995). Stepped signatures, resulting from a high boundary-normal satellite velocity relative to the OCB, will be observed with a shorter duration (typically a few tens of seconds). The model assumes a stable system with regular reconnection pulses and a large inter-pulse period; also the one-dimension nature of the model means that the longitudi-nal extent of the X-line projection is not taken into account. The calculated signatures are intended to be illustrative and reproduce the form of the signature.
Figures 6, 7 and 8 show the results of model calculations. In each case the top panels show the input square wave
recon-nection rate variation with pulses of amplitude εp, between
which is a background rate of εb. The middle panels show
the OCB latitude variation (solid line) and the satellite lati-tude (dot-dash line). The bottom panels show the predicted low-energy ion cutoff as a function of time as the satellite passes along the path shown in the middle panel. In each
case, the poleward convection velocity, Vc, was set to a fixed
(inductively smoothed) value of 500 m s−1 and the
bound-ary motion was found by evaluating Vbfrom Eq. (1). Note
the scales used for each panel are common to all three fig-ures. Figure 6 is for relatively small reconnection rate pulses and reveals a classic stepped signature as the satellite moves equatorward. Figure 7 uses the same reconnection rate
vari-ation, except the amplitude of the pulses, εp, is (8/3) times
larger. It can be seen that the stepped signature has become a sawtooth form. Figure 8 is for exactly the same reconnec-tion rate behaviour as Fig. 7, but the spacecraft is moving along a path that has a much greater meridional component (as can be seen from the greater slope of the dot-dash line) and the gradient of the satellite position is once again greater than that of the OCB position during the reconnection pulse,
i.e. Vs > Vb. It can be seen that this has returned the
dis-persion to a stepped form, the effect modelled by Lockwood and Davis (1996).
5 Summary
The form of cusp ion dispersion signatures was previously shown to be dependent on the trajectory of the observing satellite. Modelling has shown that reconnection rate can also determine the form of the cusp ion dispersion observed. Data from consecutive DMSP satellite passes on 20 August 1998 show both stepped and sawtooth signatures. Supporting data shows that an orientation change in the OCB is unlikely to explain the change in signature. The most likely cause of increased reconnection over this period is a 5 nT increase in
the magnitude of the already negative IMF Bzthat appears to
have increased the amplitude of the reconnection pulses. We conclude that the rate of reconnection must have in-creased – if the average reconnection voltage had inin-creased by a lengthening of the X-line alone, then the signature would not have changed form. The effect of lengthening the X-line would be to increase the longitudinal extent of the re-connection pulses.
Acknowledgements. The authors would like to thank the
ACE/MAG team for providing IMF data and G. Parks for sup-plying UVI data. The DMSP particle detectors were designed by Dave Hardy of AFRL, and data obtained from JHU/APL. We thank D. Hardy, F. Rich, and P. Newell for its use. This work was supported by PPARC (UK Particle Physics and Astronomy Research Council).
Topical Editor G. Chanteur thanks a referee for his help in evaluating this paper.
References
Baker, J. B., Clauer, C. R., Ridley, A. J., Papitashvili, V. O., Brit-tnacher, M. J., and Newell, P. T.: The nightside poleward bound-ary of the auroral oval as seen by DMSP and the Ultraviolet Im-ager, J. Geophys. Res., 105, 21 267–21 280, 2000.
Brittnacher, M., Fillingim, M., Parks, G., Germany G., and Spann, J.: Polar cap area and boundary motion during substorms, J. Geo-phys. Res., 104, 12 251–12 262, 1999.
Cowley, S. W. H. and Lockwood, M.: Excitation and decay of solar-wind driven flows in the magnetosphere-ionosphere sys-tem, Ann. Geophysicae, 10, 103–115, 1992.
Elphinstone, R. D., Jankowski, K., Murphree, J. S., and Cogger, L. L.: The configuration of the auroral distribution for interplan-etary magnetic field Bz northward, 1. IMF Bx and By
depen-dencies as observed by the Viking satellite, J. Geophys. Res., 95, 5791–5804, 1990.
Fedder, J. A., Mobarry, C. M., and Lyon, J. G.: Reconnection volt-age as a function of IMF clock angle, Geophys. Res. Lett., 18, 1047–1050, 1991.
Freeman, M. P., Farrugia, C. J., Burlaga, L. F., Hairston, M. R., Greenspan, M. E., Ruohoniemi, J. M., and Lepping, R. P.: The interaction of a magnetic cloud with the Earth: Ionospheric con-vection in the northern and southern hemispheres for a wide
range of quasi-steady IMF conditions, J. Geophys. Res., 98, 7633–7655, 1993.
Germany, G. A., Parks, G. K., Brittnacher, M. J., Cumnock, J., Lummerzheim, D., Spann, J. F., Chen, L., Richards, P. G., and Rich, F. J.: Remote determination of auroral energy characteris-tics during substorm activity, Geophys. Res. Lett., 24, 995–998, 1997.
Kauristie, K., Weygand, J., Pulkinnen, T. I., Murphree, J. S., and Newell, P. T.: Size of the auroral oval: UV ovals and precipitation boundaries compared, J. Geophys. Res, 104, 2321–2331, 1999. Lester, M., Lockwood, M., Yeoman, T. K., Cowley, S. W. H., L¨uhr,
J., Bunting, R., and Farrugia, C. J.: The response of ionospheric convection in the polar cap to substorm activity, Ann. Geophysi-cae, 13, 147–158, 1995.
Lockwood, M.: Identifying the open-closed field line boundary, in Proceedings of the NATO Advanced Study Institute on Polar Cap Boundary Phenomena, (Eds) Moen, J., Egeland, A., and Lock-wood, M., Kluwer Academic Press, Dordrecht, The Netherlands, 73–90, 1997.
Lockwood, M., Denig, W. F., Farmer, A. D., Davda, V. S., Cow-ley, S. W. H., and L¨uhr, H.: Ionospheric signatures of pulsed re-connection at the Earth’s magnetopause, Nature, 361, 424–427, 1993.
Lockwood, M. and Smith, M. F.: The variation of reconnection
rate at the dayside magnetopause and cusp ion precipitation, J. Geophys. Res., 97, 14 841–14 847, 1992.
Lockwood, M. and Davis, C. J.: On the longitudinal extent of magnetopause reconnection, Ann. Geophysicae, 14, 865–878, 1996.
McCrea, I. W., Lockwood, M., Moen, J., Pitout, F., Eglitis, P., Ayl-ward, A. D., Cerisier, J.-C., Thorolfssen, A., and Milan, S. E.: ESR and EISCAT observations of the response of the cusp and cleft to IMF orientation changes, Ann. Geophysicae, 18, 1009– 1026, 2000.
Newell, P. T. and Meng, C.-I.: Ion acceleration at the equatorward edge of the cusp: low-altitude observations of patchy merging, Geophys. Res. Lett., 18, 1829–1832, 1991.
Pinnock, M., Rodger, A. S., Dudeney, J. R., Baker, K.-B., Newell, P. T., Greenwald, R. A., and Greenspan, M. E.: High spatial and temporal resolution observations of the ionospheric cusp, Ann. Geophysicae, 13, 919–925, 1995.
Reiff, P. H., Spiro, R. W., and Hill, T. W.: Dependence of polar cap potential drop on interplanetary parameters, J. Geophys. Res., 86, 7639–7648, 1981.
Sotirelis, T., Newell, P. T., and Meng, C.-I.: Shape of the open-closed boundary of the polar cap as determined from observa-tions of precipitating particles by up to four DMSP satellites, J. Geophys. Res., 103, 399–406, 1998.