HAL Id: hal-00316949
https://hal.archives-ouvertes.fr/hal-00316949
Submitted on 1 Jan 2002
HAL is a multi-disciplinary open access
archive for the deposit and dissemination of
sci-entific research documents, whether they are
pub-lished or not. The documents may come from
teaching and research institutions in France or
abroad, or from public or private research centers.
L’archive ouverte pluridisciplinaire HAL, est
destinée au dépôt et à la diffusion de documents
scientifiques de niveau recherche, publiés ou non,
émanant des établissements d’enseignement et de
recherche français ou étrangers, des laboratoires
publics ou privés.
A Survey of large, rapid solar wind dynamic pressure
changes observed by Interball-1 and IMP 8
P. A. Dalin, G. N. Zastenker, K. I. Paularena, J. D. Richardson
To cite this version:
P. A. Dalin, G. N. Zastenker, K. I. Paularena, J. D. Richardson. A Survey of large, rapid solar
wind dynamic pressure changes observed by Interball-1 and IMP 8. Annales Geophysicae, European
Geosciences Union, 2002, 20 (3), pp.293-299. �hal-00316949�
Annales
Geophysicae
A Survey of large, rapid solar wind dynamic pressure changes
observed by Interball-1 and IMP 8
P. A. Dalin1, G. N. Zastenker1, K. I. Paularena2, and J. D. Richardson2
1Space Research Institute (IKI), ul. Profsouznaya, 84/32, Moscow, GSP-7, 117997, Russia
2Center for Space Research MIT, Cambridge, MA, 02139, USA
Received: 12 January 2001 – Revised: 20 July 2001 – Accepted: 8 October 2001
Abstract. The high time-resolution solar wind ion flux mea-surements from Interball-1 and IMP 8 show about one hun-dred large, rapid dynamic the pressure changes each year. We cataloged these events by the size and transition time of the pressure changes and present a statistical survey of these events. We find that the majority of the pressure changes of more than 1–2 nPa occur over a very short time period, on the order of a few minutes or less. Most of the large pressure changes not associated with shocks are due solely to density changes with speed remaining constant. We find that pres-sure balance between the thermal and magnetic prespres-sures is not maintained across most of these events, so these events are still evolving.
Key words. Interplanetary physics (solar wind plasma)
1 Introduction
Among the great variety of small-scale solar wind plasma structures, rapid and large increases and decreases in the plasma dynamic pressure are especially important because they can be very geoeffective.
Several papers are devoted to observations of solar wind dynamic pressure pulses (Gosling et al., 1967; Shodhan et al., 1999) and their interaction with Earth’s magnetosphere (Sibeck et al., 1989; Borodkova et al., 1995; Sibeck et al., 1996). These works focused mainly either on long duration pressure pulses with large amplitudes or on case studies of pressure changes with rather slow transition time. In this pa-per, dynamic pressure changes with rapid transition times are studied using a statistical approach. Solar wind measure-ments with good time resolution reveal that many plasma pressure (or density) structures have very sharp fronts with plasma changes occurring on time scales of seconds to min-utes.
Fast, high-amplitude changes in the solar wind pressure could be the cause of fast magnetosphere compressions and
Correspondence to: P. A. Dalin ([email protected])
expansions, rapid motions of the magnetopause, and many types of geomagnetic field variations. Understanding and identifying these events may be important (and occasionally crucial) for space weather forecasting.
The investigation of sharp pressure fronts is necessary not only to study the solar wind features, but also for pragmatic aspects of solar-terrestrial connections. Borod-kova et al. (1995) and Sibeck et al. (1996) determined a quan-titative relation linking changes in the geomagnetic field at geostationary orbit with the amplitude of solar wind dynamic pressure pulses. In this paper, we present a statistical study of rapid dynamic pressure changes in the solar wind.
2 Data sources and selection
We survey solar wind plasma data to find rapid, large changes
in the solar wind dynamic pressure P = mnV2, where m is
the proton mass, n is the plasma density, and V is the bulk speed. We used solar wind observations taken in 1996 and 1998 by the Interball-1 satellite (near the solar cycle mini-mum) and data taken in 1979 by the IMP 8 satellite (near the solar cycle maximum). The solar wind data are obtained from the Faraday cup instruments on board each spacecraft. The time resolution for the ion flux on board Interball-1 is as high as 1 s (see Safrankova et al., 1997 and Zastenker et al., 2000), while the velocity and density measurements from IMP 8 have a time resolution of 1 min (see Bellomo et al., 1978). For Interball-1 data, we calculated the dynamic pres-sure by multiplying the observed ion flux by the solar wind speed measured by the Wind spacecraft. SWE data, with a time resolution of about 1 min, was time-shifted by the so-lar wind propagation time between Wind and Interball-1. As shown below, for most of the events under investigation, the pressure changes result mainly from the ion density changes. In the course of this work, we found that during the fast den-sity changes, for most of the cases, the speed measured by Wind did not change on a low time resolution data (1 min).
294 P. A. Dalin et al.: A Survey of large, rapid solar wind dynamic pressure changes observed by Interball-1 and IMP 8 1 0 :1 0 1 0 :2 0 1 0 :3 0 1 0 :4 0 1 0 :5 0 1 1 :0 0 1 1 :1 0 1 1 :2 0 0 5 1 0 1 5 2 0 M a rc h 1 0 , 1 9 9 8 D y n a m ic p re s s u re , [n P a ] V , [k m /s ] U T IN T E R B A L L -1 (9 , 2 3 , 6 ) R e IM P 8 ( 2 5 , 1 5 , 1 5 ) R e s h ifte d b y a b o u t 2 8 0 s e c . 1 0 :1 0 1 0 :2 0 1 0 :3 0 1 0 :4 0 1 0 :5 0 1 1 :0 0 1 1 :1 0 1 1 :2 0 3 0 0 3 2 0 3 4 0 3 6 0 3 8 0 4 0 0 U T
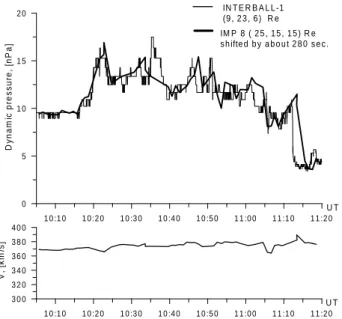
Fig. 1. An example of large and sharp pressure changes on 10 March 1998.
This allows us to make an assumption that speed also did not change on a fast time scale of a few seconds.
Interball-1 was launched in August 1995 and had a highly-elliptical orbit with apogee of about 27 RE(radius of Earth)
and perigee of about 1–3 RE. IMP 8 was launched in
Oc-tober 1973 and orbits Earth in a near-circular, near-ecliptic plane trajectory with a radius of about 35 RE.
The selection of the events (“large” and “rapid” dynamic pressure fronts) for this study was guided by the following criteria:
– we looked for increases or decreases in the solar wind dynamic pressure which were isolated in the sense that only small variations in plasma parameters occurred in the preceding and succeeding 5–10 min;
– from IMP 8 data we took only events for which the pres-sure changes by at least 1 nPa; for Interball-1 data we used a less stringent criterion; the change in pressure had to be at least 20% of Pav, where Pav=(P1+P2)/2
and P1and P2are the pressure values before and after
the pressure change;
– we took only events where the pressure change occurred in less than 10 minutes; special attention was focused on finding very sharp fronts using the high resolution Interball-1 data.
We found about 200 pressure front events meeting these criteria in the Interball-1 data and about 100 such events in the IMP 8 data.
Figure 1 shows an example of two such events, the large increase and decrease in plasma pressure on 10 March 1998. Data from Interball-1 with a 1 s resolution and from IMP 8 with a 1 min resolution are presented. The high-resolution
0 .0 2 .0 4 .0 6 .0 8 .0 1 0 .0 1 2 .0 0 4 8 1 2 1 6 2 0 2 4 2 8 p e rc e n ta g e d P , [n P a ] IN T -1 (1 9 3 p o in ts ), 1 9 9 6 ,9 8 IM P 8 (9 1 p o in ts ), 1 9 7 9
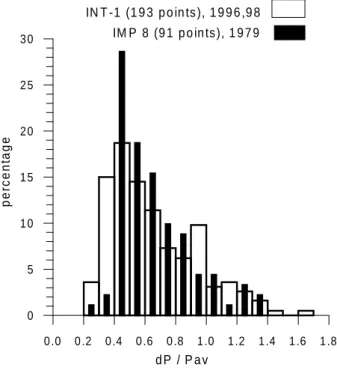
Fig. 2. Distributions of absolute pressure changes.
data show that after 10:16 UT the solar wind dynamic pres-sure increased quickly by more than a factor of 1.8, from 9 to 16 nPa, in about 4 min (the first event). The pressure fluc-tuated near this high level for 20 min and then slowly (over 30 min) decreased to 11 nPa and at 11:11 UT, very sharply (during 1 min and mainly during 10 s) decreased by a factor of 3 to 3.5 nPa (the second event). The fact that IMP 8 data shifted at each point by the solar wind propagation time (an average of about 280 s in this case) shows remarkably simi-lar (but smoother due to the lower time resolution) behaviour (except for a timing offset of the trailing front of about 3 min) and exactly the same values of plasma pressure. During these large pressure changes the bulk velocity observed by IMP 8 changed very little, less than 3% as shown in Fig. 1. Therefore, the pressure changes results solely from the
in-crease/decrease in the plasma density from 38 to 70 cm−3
and then down to 14 cm−3.
3 Statistics of the pressure front features
(1) The distributions of the amplitudes of the dynamic pres-sure changes for both data sets are presented in Fig. 2. The distribution of dP has a maximum at 1–2 nPa for both data sets and a long tail with disturbances as high as 5–11 nPa. The majority of Interball-1 pressure changes (about 60% of the events) are in the range of 0.5–2.5 nPa and the majority of IMP 8 events are in the range of 1.0–2.5 nPa. As mentioned above, the selection criteria for Interball-1 and IMP 8 data were different. But the distributions presented in Fig. 2 show that using these somewhat different criteria did not affect the results. The less stringent criterion used for Interball-1 data gave only 15% more events than the stricter criterion used for IMP 8 data.
0 .0 0 .2 0 .4 0 .6 0 .8 1 .0 1 .2 1 .4 1 .6 1 .8 0 5 1 0 1 5 2 0 2 5 3 0 d P / P a v p e rc e n ta g e IN T -1 (1 9 3 p o in ts ), 1 9 9 6 ,9 8 IM P 8 (9 1 p o in ts ), 1 9 7 9
Fig. 3. Distributions of relative pressure changes.
(2) Figure 3 shows the ratio of the pressure change to the average value of the solar wind pressure, dP /Pav. It is im-portant to determine such a relative value because the large pressure changes took place for high as well as for a low average level of the dynamic pressure. Figure 3 shows that the most probable relative pressure changes are 0.4–0.5 and are the same for both data sets. In 75–85% of the events, dP /Pavwas in the range of 0.4 to 1.0; 15–20% of the events had dP /Pavgreater than 2.
Figures 2 and 3 show that the distributions of pressure changes for the two data sets (in spite of not exactly the same criteria of data selections) are very similar at solar minimum (1996, 1998) and solar maximum (1979), so the distributions of pressure changes seem not to depend on the phase of the solar cycle.
(3) As mentioned above, for most events, the pressure changes result mainly from density changes. To confirm this statement quantitatively, we compared the magnitude of rela-tive pressure changes with the magnitude of the relarela-tive
den-sity changes (dP /Pav)with the magnitude of the relative
density changes (dn/nav). Figure 4 demonstrates this
de-pendence. Almost all the points are located along the line of equality and the average value of (dP /Pav)/(dn/nav) = 0.99, i.e. the pressure changes are really dominated by den-sity changes and the role of the velocity change in these pres-sure changes is rather small.
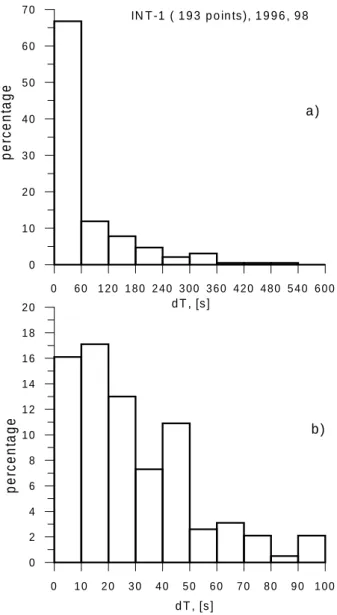
(4) We selected events with rapid pressure changes; the dis-tribution of the Interball-1 event transition time is shown in Fig. 5. The upper panel shows a courser-scale plot (0– 10 min) and the bottom panel shows a finer-scale plot (0– 100 s).
About 70% of the observed pressure fronts have transition
-2 .0 -1 .0 0 .0 1 .0 2 .0 -2 .0 -1 .0 0 .0 1 .0 2 .0
d
P
/
P
a
v
d n / n
a vFig. 4. The dependence of the magnitude of the relative pressure
changes on the magnitude of the relative density changes.
times of less than 100 s The most probable value of the event transition time is 10–20 s. Very sharp fronts (less than 10 s) were found in 15% of the cases. A simple estimate using typical solar wind parameters (a speed of 400 km/s and IMF magnitude of 5 nT) yields that pressure fronts with a transi-tion time of several seconds have spatial dimensions of about 10 proton gyroradii.
(5) Comparison of the transition time of pressure changes with their amplitudes (not presented here) shows no clear re-lation. So the pressure front amplitudes and pressure front transition time are independent. The relation between the ab-solute values of pressure changes and their transition times is presented for Interball-1 data in Table 1, which shows the number of observed events as a function of dP and dT .
We can see that the core of the event distribution (38 of 193 cases) has a transition time of 10–60 s and pressure changes of 1 to 2 nPa. Although the largest pressure changes are not, in general, the fastest ones, 5 cases with pressure changes that occurred in less than 10 s also had pressure changes of more than 4 nPa.
4 Statistics of the largest events
For space weather purposes, it is important to look at the characteristics of the largest pressure changes that are most likely to have significant consequences for the near-Earth en-vironment. Thus, we selected pressure changes (increases or decreases) of more than 3 nPa. This value is arbitrary but based on the experience gained from studies of a vari-ety of solar wind disturbances (see, for example, Zastenker and Borodkova, 1991).
296 P. A. Dalin et al.: A Survey of large, rapid solar wind dynamic pressure changes observed by Interball-1 and IMP 8 0 6 0 1 2 0 1 8 0 2 4 0 3 0 0 3 6 0 4 2 0 4 8 0 5 4 0 6 0 0 0 1 0 2 0 3 0 4 0 5 0 6 0 7 0 d T , [s ] p e rc e n ta g e IN T -1 ( 1 9 3 p o in ts ), 1 9 9 6 , 9 8 0 1 0 2 0 3 0 4 0 5 0 6 0 7 0 8 0 9 0 1 0 0 0 2 4 6 8 1 0 1 2 1 4 1 6 1 8 2 0 p e rc e n ta g e d T , [s ] a ) b )
Fig. 5. Distribution of the transition time of pressure changes.
We found 29 of these very large dynamic pressure changes in the Interball-1 data and 28 events in the IMP 8 data, 15% and 30% of our total events for each spacecraft. Fig-ure 6 shows the distributions of the dP values for the largest events. The most probable value of dP for both sets of data is 3–6 nPa. But the tails of the distributions differ slightly; in the Interball-1 data the occurrence rate of very high pressure changes (dP more than 10 and up to 50 nPa!) is significantly larger than in the IMP 8 data.
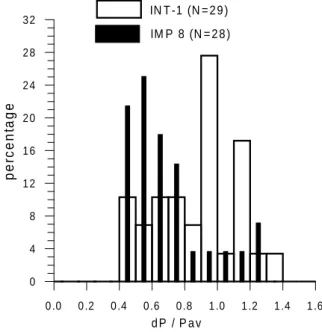
The distributions of the relative pressure changes for the largest events shown in Fig. 7 also differ significantly be-tween spacecraft; for the Interball-1 data the most probable value is 0.9–1.0, but for the IMP 8 data, it is 0.5–0.6.
The distribution of dT values for the largest events is very similar to that shown in Fig. 5. The most probable transition time for the largest events is also 0–60 s.
Table 1. Distribution of the amounts of studied events among dP
(in nPa) and dT (in seconds) ranges
dP \dT <10 10–60 60–180 >180 0–1 6 16 3 6 1–2 11 38 11 7 2–4 4 24 11 5 4–8 3 9 6 4 >8 2 16 7 4
5 Discussion of the origins of the pressure changes
One important problem is to determine the origin of observed rapid and large changes in solar wind dynamic pressure. Are they produced by processes near the Sun or during the solar wind propagation through interplanetary space? Some argu-ments on this point may be discussed using the results of our investigation.
(1) We can estimate the average frequency of rapid and large density changes detected by Interball-1 and IMP 8. Using the total number of events observed by Interball-1 (119 isolated fronts) and the number of days (281) when Interball-1 was definitely in the solar wind (three days for each orbit), we calculated the frequency of pressure events as 0.42 for such an event, per day. IMP 8 is in the solar wind for about 10 days of its 12.5 day orbit around the Earth. In 223 days of solar wind observations we found 91 large pressure change events. Therefore, the frequency of pressure jumps observed by IMP 8 is 0.40 for such an event, per day. Since Interball-1 data was from 1996 and 1998 and IMP 8 data was from 1979, this result suggests that the frequency of such events does not differ significantly between solar minimum and solar maxi-mum.
It is necessary to estimate the homogeneity of the event occurrence rate. The large and sharp pressure changes are not distributed homogeneously. For example, for Interball-1 data, these events are observed on only 30% of the days in 1996 and 1998; gaps of 10–20 days without such pressure changes are common. For IMP 8 data, the large and sharp pressure changes are observed on 20% of the days in 1979 and these “active” days usually occur in groups of 2–3 with large (10–20 days) “quiet” gaps between them. So, the cre-ation of sharp and large pressure changes may require that special conditions exist in the solar wind. The study of such conditions will be the focus of future work.
(2) Shodhan et al. (1999) found that long (1 hour and more) density (pressure) pulses were associated with solar events (coronal mass ejections, CMEs) or with the interaction of fast and slow solar wind streams in the interplanetary medium (corotating interaction regions, CIRs). Some of the sharp density (pressure) fronts, in principal, may be connected to interplanetary shock waves of CME or CIR origin.
0 3 6 9 12 15 18 21 24 27 30 33 36 39 42 45 48 51 0 5 1 0 1 5 2 0 2 5 3 0 3 5 4 0 4 5 5 0 5 5 6 0 6 5 p e rc e n ta g e d P , [n P a ] IM P 8 (N = 2 8 ) IN T -1 (N = 2 9 )
Fig. 6. Distributions of dP for the largest events.
with the simultaneous changes in the solar wind bulk speed, thermal velocity and IMF magnitude in the Wind data. Of the 204 pressure change events detected by Interball-1, only 11 cases coincided with a significant increase in the solar wind speed, together with the increasing of density, thermal velocity and IMF magnitude that identified these events as fast interplanetary shocks. In all the other cases, the changes in the solar wind parameters at the pressure fronts did not allow one to identify these events as interplanetary shocks.
A similar result was obtained for the IMP 8 data; only 25 of 116 events were identified as interplanetary shocks. All of these shock-like events were excluded from the statisti-cal results discussed above. We conclude that most fast and large solar wind pressure changes are not associated with in-terplanetary shocks.
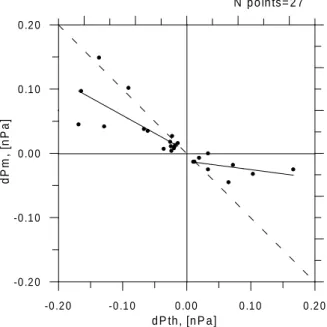
(3) We compare the plasma thermal pressure variations (dPt h) with the simultaneous magnetic field pressure varia-tions (dPm) across the fast and large dynamic pressure fronts. The aim of this comparison is to check the hypothesis that pressure balance is maintained across the boundary of so-lar wind plasma structures (see, for example, Burlaga et al., 1970, 1981); for tangential discontinuities, thought to be the most frequent type of discontinuity in the solar wind, the pressure balance must be maintained in the MHD limit.
We selected the 27 cases from the Interball-1 data that had dynamic pressure changes dP > 3 nPa. For these cases we estimated the thermal pressure changes and magnetic field pressure changes using the bulk velocity, ion thermal veloc-ity, electron temperature and magnetic field amplitude ob-served by Wind and shifted to the Interball-1 position by the solar wind propagation time. The plasma density was deter-mined by dividing the Interball-1 ion flux data by the bulk velocity observed by Wind.
The changes in dynamic pressure observed by Interball-1
0 .0 0 .2 0 .4 0 .6 0 .8 1 .0 1 .2 1 .4 1 .6 0 4 8 1 2 1 6 2 0 2 4 2 8 3 2 d P / P a v p e rc e n ta g e IM P 8 (N = 2 8 ) IN T -1 (N = 2 9 )
Fig. 7. Distributions of dP /Pavfor the largest events.
coincide well with observations by Wind after taking the time shift into account. Plasma thermal pressure changes were calculated as dPt h=k · dn · (dTi+dTe), where dTi and dTe are the changes in the ion and electron temperatures across the dynamic pressure front. In most cases the changes in the ion and electron temperatures were not large, 10–20%, whereas the density change is typically a factor of 2–3.
The comparison of thermal and magnetic pressure changes for these events is presented in Fig. 8. Several features can be seen from this plot:
– the changes in the thermal pressure and magnetic field pressure always have the opposite sign, as required for pressure balance, with increasing thermal pressure co-inciding with decreasing magnetic pressure and vice versa;
– however, values of dPmin all cases except two are sig-nificantly (several times) lower than values of dPt h(see the dash line in Fig. 8), so pressure balance is often not maintained across events with sharp and large dynamic pressure changes;
– we find a large effect which depends on the sign of the dPt hvariations (see the solid line in Fig. 8); for posi-tive dPt h, (the plasma thermal pressure increases) the
change in dPmis, on average, about 8 times less than
the thermal pressure change, whereas for negative dPt h, the average value of dPmis only about 2 times less than
dPt h.
For most of the events the direction of the field changes significantly but we need to conclude that these events can-not be tangential discontinuities because pressure balance is not maintained. They could be either slow shocks or
rota-298 P. A. Dalin et al.: A Survey of large, rapid solar wind dynamic pressure changes observed by Interball-1 and IMP 8 -0 .2 0 -0 .1 0 0 .0 0 0 .1 0 0 .2 0 -0 .2 0 -0 .1 0 0 .0 0 0 .1 0 0 .2 0 d P th , [n P a ] d P m , [n P a ] N p o in ts= 2 7
Fig. 8. Relation between magnetic field pressure and thermal
pres-sure changes during the largest dynamic prespres-sure fronts. The dash line shows the equality of changes, solid lines show the best fit ap-proximation.
tional discontinuities with an anisotropy of the thermal pres-sure (Hudson, 1971, 1973).
6 Conclusion
Three years of solar wind data were surveyed to develop a data set of rapid, sharp solar wind dynamic pressure changes that were then investigated statistically. For about two hun-dred selected events observed by Interball-1 and about one hundred events observed by IMP 8 we found the average pressure change (dP ) was 4 nPa and the average value of the
relative pressure change (dP /Pav)equaled 0.65.
Compari-son of the two observational periods, near solar cycle mini-mum (1996, 1998) and solar cycle maximini-mum (1979), shows little difference in the observations. The frequency of rapid, large pressure changes is nearly the same at both solar max-imum and solar minmax-imum and is about one event per two days.
The most impressive feature of the large pressure changes is their short transition time; in about 50% of the studied events, the large change in the dynamic pressure takes less than 1 min In 10% of the cases, large changes in plasma pres-sure occurred in a few seconds. It seems unlikely that such short time scale solar wind phenomena are created near the Sun and survive the propagation to Earth. However, these pressure changes are not distributed homogeneously in time, but are observed to occur in clumps. They may be created only under specific solar wind conditions which have not yet been determined. Of course, fast and sharp pressure changes occur at interplanetary shocks, but less than 10% of the
pres-sure changes are associated with shocks. The other events cannot be shocks since they do not propagate relative to the solar wind plasma, as comparison with Wind observations shows.
Bulk velocity changes across the pressure changes usu-ally are small (except for the interplanetary shocks), so these sharp events are not the interfaces of fast and slow streams (CIRs).
For the largest events, the plasma thermal pressure and magnetic field pressure changes have the opposite signs, but pressure balance in many cases is not maintained; the plasma thermal pressure changes in almost each case are signifi-cantly (several times) larger than the magnetic field pres-sure changes. These events are, therefore, not tangential dis-continuities, and the pressure changes are not compressional waves because the density and magnetic field changes do not have the same sign. It is probably that slow shocks or rota-tional discontinuities with an anisotropy of the thermal pres-sure could be responsible for the observed prespres-sure changes. Since we have ruled out other options, we suggest that the large and fast dynamic pressure changes result from plasma instabilities in the interplanetary medium which perhaps re-sult in the steepening of density fronts when pressure pulses propagate from the Sun to Earth. If so, a better understand-ing of this process and the evolution of these structures is needed.
Acknowledgements. Author thanks to A. Lazarus, to R. Lin and to R. Lepping for possibility to use Wind ion and electron solar wind and magnetic field data and to M.O. Riazantseva for the help in data preparation . The work in IKI was partly supported by NASA contract NAG5–8720 (JURRISS) to MIT and IKI (administrated by CRDF under award RP0-847) and by RFBR grants 00–15–96631 and 01–02–16182. The work at MIT was supported by the NSF Space Weather program grant ATM-9819699.
Topical Editor G. Chanteur thanks H. Biernat and another ref-eree for their help in evaluating this paper.
References
Bellomo, A. and Mavretic, A.: Description of the MIT Plasma Ex-periment on IMP 7/8, CSR MIT TR-78–2, pp. 51, 1978. Borodkova, N. L., Zastenker, G. N., and Sibeck, D. G.: A case
and statistical study of transient magnetic field events at geosyn-chronous orbit and their solar wind origin, Journ. Geophys. Res., 100, 5643–5656, 1995.
Burlaga, L. F.and Ogilvie, K. W.: Magnetic and thermal pressures in the solar wind, Sol. Phys., 15, 61–70, 1970.
Burlaga, L. F., Sittler, E., Mariani, F., and Schwenn, R.: Magnetic loop behind an interplanetary shock: Voyager, Helios and IMP-8 observations, J. Geophys. Res., 86, 6673–6684, 1981.
Gosling, J. T, Asbridge, J. R., Bame, S. J., Hundhausen, A. J., and Strong, I. B.: Discontinuities in the solar wind associated with sudden geomagnetic impulses and storm commencements, J. Geophys. Res., 72, 13, 3357–3363, 1967.
Hudson, P. D.: Rotational discontinuities in an anisotropic plasma, Planet. Space Sci.,19, 1693–1702, 1971.
Hudson, P. D.: Rotational discontinuities in an anisotropic plasma-II, Planet. Space Sci.,21, 475–483, 1973.
Safrankova, J., Zastenker, G., Nemecek, Z., Fedorov, A., Simer-sky, M., and Prech, L.: Small scale observation of magnetopause motion: preliminary results of the Interball project, Ann. Geo-physicae, 15, 5, 562–569, 1997.
Shodhan, S., Crooker, N. U., Fitzenreiter, R. J., Lepping, R. P., and Steinberg, J. T.: Density enhancements in the solar wind, CP471, in: Solar Wind Nine, (Eds) Habbal, S. R., Esser, R., Hollweg, J. V., and Isenberg, P. A., 601–604, 1999,
Sibeck, D. G., Baumjohann, W., and Lopez, R. E.: Solar wind dynamic pressure variations and transient magnetospheric sig-natures, Geophys. Res. Lett., 16, 13–16, 1989.
Sibeck, D. G., Borodkova, N. L., and Zastenker, G. N.: Solar wind parameters variations as an origin of short magnetic field distur-bances at the dayside magnetosphere, Cosmic Research, 34, 3, 248–263, 1996.
Zastenker, G. N. and Borodkova, N. L.: Long-term energy and mo-mentum flux fluctuations of the solar wind at 1 AU, Journ. Geo-magn. Geoelectr.,43, 89–99, 1991.
Zastenker, G. N., Fedorov, A. O., Sharko, Yu. V., Moldosanov, K. A., Dalin, P. A., Kirpichev, I. P., Kim, L. S., and Samsonov, M. A.: The Faraday integral cup on the board Interball-1, Kos-mich. Issled. (in Russian), 38, 1, 23–30, 2000.