Distinct Neural Circuits for the Formation
and Retrieval of Episodic Memories
The MIT Faculty has made this article openly available.
Please share
how this access benefits you. Your story matters.
Citation
Roy, Dheeraj S., Takashi Kitamura, Teruhiro Okuyama, Sachie
K. Ogawa, Chen Sun, Yuichi Obata, Atsushi Yoshiki, and Susumu
Tonegawa. “Distinct Neural Circuits for the Formation and Retrieval
of Episodic Memories.” Cell 170, no. 5 (August 2017): 1000–
1012.e19.
As Published
http://dx.doi.org/10.1016/J.CELL.2017.07.013
Publisher
Elsevier BV
Version
Author's final manuscript
Citable link
http://hdl.handle.net/1721.1/118753
Terms of Use
Creative Commons Attribution-NonCommercial-NoDerivs License
Distinct neural circuits for the formation and retrieval of episodic
memories
Dheeraj S. Roy1,5, Takashi Kitamura1,5, Teruhiro Okuyama1, Sachie K. Ogawa1, Chen Sun1, Yuichi Obata2, Atsushi Yoshiki2, and Susumu Tonegawa1,3,4,6,*
1RIKEN-MIT Center for Neural Circuit Genetics at the Picower Institute for Learning and Memory, Department of Biology and Department of Brain and Cognitive Sciences, Massachusetts Institute of Technology, Cambridge, MA 02139, U.S.A.
2RIKEN BioResource Center, 3-1-1 Koyadai, Ibaraki 305-0074, Japan
3Howard Hughes Medical Institute, Massachusetts Institute of Technology, Cambridge, MA 02139, U.S.A.
4RIKEN Brain Science Institute, 2-1 Hirosawa, Wako-shi, Saitama 351-0198, Japan
SUMMARY
The formation and retrieval of a memory is thought to be accomplished by activation and reactivation, respectively, of the memory-holding cells (engram cells) by a common set of neural circuits, but this hypothesis has not been established. The medial temporal-lobe system is essential for the formation and retrieval of episodic memory for which individual hippocampal subfields and entorhinal cortex layers contribute by carrying out specific functions. One subfield whose function is poorly known is the subiculum. Here, we show that dorsal subiculum and the circuit, CA1 to dorsal subiculum to medial entorhinal cortex layer 5, plays a crucial role selectively in the retrieval of episodic memories. Conversely, the direct CA1 to medial entorhinal cortex layer 5 circuit is essential specifically for memory formation. Our data suggest that the subiculum-containing detour loop is dedicated to meet the requirements associated with recall such as rapid memory updating and retrieval-driven instinctive fear responses.
INTRODUCTION
It is generally thought that formation and retrieval of a memory are accomplished by activation and reactivation of memory-holding cells (engram cells), respectively, by a largely common set of neural circuits that convey relevant sensory and/or processed information. However, this hypothesis has not been well studied. One of the best neural systems to prove this issue is the medial temporal lobe (MTL), including the hippocampus (HPC) and
*Correspondence: tonegawa@mit.edu.
5Co-first author 6Lead contact
AUTHOR CONTRIBUTIONS
D.S.R., T.K., and S.T. contributed to the study design. D.S.R., T.K., T.O., S.K.O., and C.S. contributed to the data collection and
HHMI A
uthor Man
uscr
ipt
HHMI A
uthor Man
uscr
ipt
HHMI A
uthor Man
uscr
ipt
entorhinal cortex (EC), which plays crucial roles in episodic memory (Eichenbaum et al., 2007; Squire, 1992). Numerous studies have identified specific and crucial roles of
individual HPC subfields and EC layers to the overall mnemonic function (Deng et al., 2010; Hasselmo and McClelland, 1999; Hitti and Siegelbaum, 2014; Moser et al., 2014; Nakazawa et al., 2004). However, the essential function of one HPC subfield, subiculum (Sub), is poorly known. The mammalian HPC formation is organized primarily as a unidirectional circuit, where information transferred from the EC’s superficial layers to the dentate gyrus (DG) is processed successively in CA subfields: CA3, CA2, and CA1. Dorsal CA1 (dCA1) sends its primary projections directly to medial EC layer 5 (EC5) or indirectly via dorsal subiculum (dSub) (a detour circuit). One of the interesting differences between the direct and indirect HPC output pathways is that in the latter, dSub projects not only to EC5, but also to many cortical and subcortical brain regions (Ding, 2013; Kishi et al., 2000). Using functional magnetic resonance imaging of human subjects, several studies have suggested that the DG and CA subfields are selectively activated during episodic memory formation, whereas subiculum (Sub) is active during the recollection of an episode (Eldridge et al., 2005; Gabrieli et al., 1997). In rodents, ibotenic acid lesions of the CA1 subfield or Sub caused impairments in the acquisition of place navigation (Morris et al., 1990).
However, since human imaging studies provide only correlative, rather than causal, evidence and rodent lesions are not well targeted to a specific hippocampal subregion, especially given the close proximity of CA1 and dSub, it has not been possible to identify the essential function of Sub in episodic memory. Furthermore, previous studies did not address the potential purpose of the parallel diverging and converging dCA1 to medial EC5 and dCA1 to dSub to medial EC5 circuits in memory formation versus retrieval.
In the present study, we addressed these issues by creating a mouse line expressing Cre recombinase specifically in dSub neurons. Combined with circuit tracing and optogenetic manipulations during behavioral paradigms, we found differential roles of dSub projections in hippocampal memory retrieval and retrieval-induced stress hormone responses. We demonstrate that dSub and the circuit, CA1→dSub→EC5, is selectively required for memory retrieval, while the dSub to mammillary bodies (MB) circuit regulates stress hormones following memory retrieval. In contrast, the direct CA1→EC5 circuit is essential for hippocampal memory formation, but not recall. Our study reveals a functional double-dissociation between parallel hippocampal output circuits that are important for memory formation versus memory retrieval.
RESULTS
Generation of FN1-Cre Mice
We took advantage of the finding that fibronectin-1 (FN1) gene expression is restricted to dSub neurons (Lein et al., 2004) and created a transgenic mouse line (FN1-Cre) that expresses Cre recombinase under the FN1 promoter (Figure 1A, and see Methods). When infected with a Cre-dependent adeno-associated virus containing an eYFP gene, eYFP expression was highly restricted to dSub neurons and was completely absent in neighboring dCA1 excitatory neurons identified by WFS1 (Figure 1B). The expression of eYFP was restricted to CaMKII+ excitatory neurons in both the deep and superficial layers of dSub
HHMI A
uthor Man
uscr
ipt
HHMI A
uthor Man
uscr
ipt
HHMI A
uthor Man
uscr
ipt
(Figures 1C–1D, and see Figure S1A). This eYFP expression accounted for over 85% of all excitatory neurons in this brain region, and was dSub-specific along the entire medial-lateral axis (Figures 1E–1K). Further, Cre expression was absent in ventral subiculum (vSub) and medial entorhinal cortex (MEC) in this mouse line (Figures S1B–S1K). Using in situ hybridization, we confirmed that Cre expression in this mouse line is highly restricted to dSub, and the dorsal tegmental nucleus (DTg) in the brain stem (Figure S1L). Thus, FN1-Cre mice allows for the genetic manipulation of dSub excitatory neurons with unprecedented specificity.
Input-Output Organization of dSub Neurons
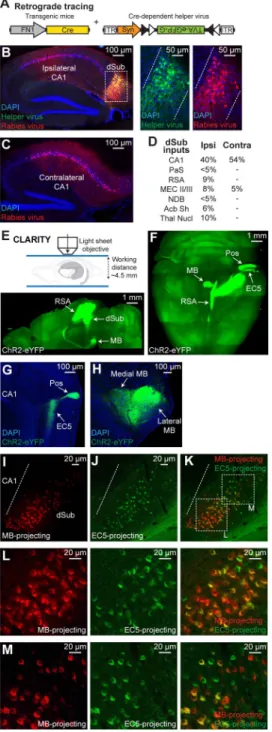
We next examined the inputs to dSub excitatory neurons as well as their anterograde brain-wide projection pattern. Monosynaptic retrograde tracing experiments using a
Cre-dependent helper virus combined with rabies virus (RV) expressing mCherry (Wickersham et al., 2007), labeled 78% of dSub cells relative to all cells (i.e., DAPI+ cells). The results confirmed that dCA1 provides the major input to dSub excitatory neurons (Figures 2A–2C) (Ding, 2013; Kishi et al., 2000). Other brain areas that provide inputs to dSub include parasubiculum (PaS), retrosplenial agranular cortex (RSA), superficial layers of EC (MEC II/III), nucleus of the diagonal band (NDB), nucleus accumbens shell (Acb Sh), and several thalamic nuclei (Thal Nucl) (Figure 2D, and see Figure S1M).
A Cre-dependent channelrhodopsin-2 (ChR2)-eYFP virus combined with light sheet microscopy of CLARITY (Chung et al., 2013, see Methods)-processed brain samples revealed that major efferents of dSub neurons were directed to RSA, mammillary bodies (MB), medial EC5, and postrhinal cortex (Pos) (Figures 2E–2F). No projections from dSub were observed in the superficial layers (II/III) of MEC (Figure 2G). These dSub neurons converged on both medial and lateral regions of MB (Figure 2H). Using a Cre-dependent synaptophysin virus to label dSub axonal terminals, we found that these Cre+ neurons express vesicular glutamate transporters 1 and 2 (Kaneko et al., 2002), reflecting their excitatory nature (Figures S1N–S1P). Injection of a retrograde tracer, cholera toxin subunit B (CTB), into the MB revealed a gradient of CTB555 with higher intensity labeling in the proximal part of dSub (i.e., closer to CA1), whereas injection into medial EC5 showed a gradient of CTB488 with higher intensity labeling in the distal part of dSub (i.e., away from CA1) (Figures 2I–2M, and see Figure S1Q) (Witter et al., 1990). However, neurons in both proximal and distal parts of dSub were weakly labeled by CTB injected into MB or EC5. Together, these results indicate that dCA1 serves as the main input structure to dSub, and that the majority of dSub neurons send projections to multiple downstream target structures.
The dSub→EC5 Circuit Bidirectionally Regulates Episodic Memory Retrieval
To examine the functional role of dSub neurons and their circuits, we performed optogenetic inhibition experiments using a Cre-dependent eArch3.0-eYFP virus. During the contextual fear-conditioning (CFC) paradigm, we confirmed that green light inhibition of dSub decreased behavior-induced immediate early gene cFos-positive neurons (Figures S2A– S2L). Inhibition of dSub neurons during CFC training had no effect on footshock-induced freezing behavior or long-term memory formation (Figure 3A). In contrast, dSub inhibition during CFC recall tests decreased behavioral performance (Figure 3B). Inhibition of dSub
HHMI A
uthor Man
uscr
ipt
HHMI A
uthor Man
uscr
ipt
HHMI A
uthor Man
uscr
ipt
neurons had no effect on motor behaviors in an open-field assay (Figure S2M). Inhibition of dSub terminals in medial EC5, but not in MB, also revealed a memory retrieval deficit (Figure 3C). Since the behavioral effect of dSub inhibition in this mouse line is based on eArch expression in approximately 85% of excitatory neurons in this brain region, we examined the effect of a more complete inhibition of dSub neurons. Inhibition of dSub→EC5 terminals in wild type mice using an EF1α-eArch3.0-eYFP virus revealed a greater memory retrieval deficit (Figure S3 vs. Figure 3C). Further, inhibition of
vSub→EC5 terminals showed normal levels of memory recall (Figure S3).
Conversely, optogenetic activation of ChR2-eYFP-expressing dSub projections to medial EC5 during CFC recall tests increased recall-induced freezing behavior in the training context, but not in a neutral context (Figure 3D, and see Figure S4A). This result indicates that dSub is involved in hippocampal memory retrieval in a context-specific manner. Activation of dSub→EC5 in mice that did not receive footshocks during training lacked freezing behavior during the recall test, supporting the specificity of increased memory retrieval in CFC-trained animals. Our interpretation of these optogenetic activation experiments is that in the training context natural recall cues reactivate engram cells in all subfields of the hippocampus, like DG, CA3, and CA1, but also in dSub. When the activity of dSub projections to EC5 is further increased by ChR2 this leads to enhanced freezing due to increased activation of dSub engram cells. On the other hand, in a neutral context lacking the specific natural recall cues to reactivate dSub engram cells, the ChR2 activation without engram labeling is not sufficient to induce memory recall. In another
hippocampus-dependent memory paradigm, trace fear-conditioning, dSub→EC5 inhibition impaired memory recall (Figure 3E, and see Figures S4B–S4C). In contrast, inhibition of dSub→EC5 had no effect on the recall of a hippocampus-independent memory formed during delay fear-conditioning (Figures S4D–S4E). Together, these experiments indicate that the dSub→EC5 circuit regulates episodic memory retrieval bidirectionally. We confirmed that the
dSub→EC5 projection is also necessary for the retrieval of a positive-valence,
hippocampus-dependent (Raybuck and Lattal, 2014) memory formed in a conditioned place preference (CPP) paradigm (Figure 3F, and see Figures S2N, S4F–S4G).
The dSub→MB Circuit Regulates Retrieval-Induced Stress Hormone Responses
During both CFC training and recall, levels of the stress hormone corticosterone (CORT) increases in the blood (Figure 3G), which is believed to be important to prepare the animal for a predicted immediate danger (Kelley et al., 2009). Given our finding that dSub neurons are required for memory retrieval, but not memory formation, we investigated whether the dSub→MB circuit is involved in retrieval-induced stress hormone responses. Optogenetic inhibition of dSub→MB projections following CFC recall, but not following CFC training, prevented the CORT increase (Figure 3G, and see Figure S2N). This deficit was specific to dSub→MB terminal inhibition, since dSub→EC5 terminal inhibition had no effect. In addition, optogenetic activation of ChR2-expressing dSub→MB projections following CFC recall increased CORT levels, revealing a bidirectional regulation of blood stress hormone levels by the dSub→MB circuit following fear memory retrieval. Interestingly, we did not observe increased CORT levels following CPP memory retrieval (Figure S4H). From our finding that the dSub→EC5 circuit is crucial for CPP memory retrieval (Figure 3F), it is
HHMI A
uthor Man
uscr
ipt
HHMI A
uthor Man
uscr
ipt
HHMI A
uthor Man
uscr
ipt
clear that dSub neurons are activated and therefore both downstream EC5 and MB circuits would be activated. The lack of increased CORT levels following CPP memory retrieval suggests that the dSub→MB circuit is necessary but not sufficient to induce CORT. These experiments uncovered a neural circuit originating from dSub that regulates stress hormone responses to conditioned cues.
Heterogeneity of dCA1 Neurons that Project to dSub and EC5
The dCA1 neurons send primary projections directly to medial EC5, or indirectly via dSub (Ding, 2013). We examined whether the same dCA1 neurons send divergent projections to both dSub and EC5, or whether these two circuits involve distinct subpopulations of dCA1 neurons. To test these possibilities, we conducted monosynaptic retrograde tracing by injecting a Cre-dependent helper virus combined with rabies virus expressing mCherry (Wickersham et al., 2007) into dSub of FN1-Cre mice combined with CTB488 injected into medial EC5 (Figures 4A–4C, and see Figure S1Q). The dCA1 cells revealed a gradient of RV-mCherry with higher intensity labeling in the distal part of dCA1 (i.e., closer to dSub) (Figure 4B) and a gradient of CTB488 with higher intensity labeling in the proximal part of dCA1 (i.e., away from dSub) (Figure 4C). The higher intensity labeling of distal dCA1 by RV-mCherry and proximal dCA1 by CTB488 are consistent with earlier observations (Knierim et al., 2013), and suggests their stronger projections to dSub and EC5, respectively. However, in counting the total number of labeled cells regardless of labeling intensity, we did not find any significant difference in the number of RV-mCherry-positive dCA1 cells nor in the number of CTB488-positive dCA1 cells along the proximal-distal axis (Figure S5J). This suggests that the strength of the projections from dCA1 to dSub and from dCA1 to EC5 are not reflected in the total number of projecting dCA1 cells, but in their labeling intensity. Such differences in projection strength and targets of the distal vs. proximal dCA1 cells may provide the basis for their differential roles in behaviors. It has been suggested that proximal and distal dCA1 may play differential roles in memory formation (Nakazawa et al., 2016). Importantly, we observed three neuronal populations distributed throughout the proximal-distal axis of dCA1, namely RV-mCherry-positive dCA1 cells, CTB488-positive dCA1 cells, and double-positive dCA1 cells (Figures 4D–4F), indicating that dCA1 neurons project collaterally to both dSub and medial EC5 (22%), project to dSub alone (18%), or to medial EC5 alone (23%) (Figure 4G, and see Figures S5A–S5H). A significant proportion of the remaining dCA1 neurons most likely send primary projections to the deep layers of the lateral EC (LEC5) (Knierim et al., 2013), which we confirmed using CTB retrograde tracing (Figure S5I). Thus, these data demonstrate that, although there are distinct dCA1
subpopulations that project to either dSub or EC5, a significant proportion of dCA1 neurons projecting to dSub and EC5 are shared between these two circuits.
The dCA1→EC5 Circuit is Crucial for Episodic Memory Encoding
Given the selective role of the dSub→EC5 circuit in memory retrieval and our finding that heterogeneous subpopulations of dCA1 neurons project to dSub and medial EC5,
respectively, we next investigated the behavioral contributions of the direct dCA1→EC5 circuit. The injection of a Cre-dependent H2B-GFP virus into dCA1 of CA1 pyramidal cell-specific Cre transgenic mice, TRPC4-Cre (Okuyama et al., 2016), resulted in GFP
HHMI A
uthor Man
uscr
ipt
HHMI A
uthor Man
uscr
ipt
HHMI A
uthor Man
uscr
ipt
expression restricted to dCA1 pyramidal cells without any expression in dSub (Figure 4H). Terminal inhibition of CA1 axons at medial EC5 during CFC training impaired long-term memory formation (Figure 4I), whereas the same manipulation during CFC recall had no effect on behavioral performance (Figure 4J). Further, consistent with the role of dSub in CFC recall, terminal inhibition of dCA1→dSub during CFC recall, but not during CFC training, decreased behavioral performance (Figures 4K–4L). Therefore, the direct dCA1→EC5 circuit plays a crucial role in the encoding, but not recall, of CFC long-term memory, whereas the indirect dCA1→dSub→EC5 circuit is crucial for memory recall, but not encoding.
Distinct Roles for the Direct and Indirect Circuits in Memory Updating
A potential purpose of the parallel diverging and converging direct dCA1→EC5 and indirect dCA1→dSub→EC5 circuits could be to support rapid memory updating (Lee, 2010). To test this possibility, we performed the pre-exposure mediated contextual fear-conditioning (PECFC) paradigm with optogenetic terminal inhibition of CA1→EC5 (Figure 4M) or dSub→EC5 (Figure 4N) during the pre-footshock period (context retrieval) only or
footshock period (fear association) only, on Day 2. CA1→EC5 inhibition specifically during the footshock period of Day 2 impaired the context-shock association evidenced by
decreased freezing on Day 3, whereas inhibition during the pre-footshock period had no effect (Figure 4M). In contrast, dSub→EC5 inhibition during the pre-footshock period of Day 2 impaired the context-shock association on Day 3, while inhibition restricted to the footshock period had no effect (Figure 4N). Together, these data indicate that the dSub→EC5 circuit is crucial for the rapid recall in order to perform memory updating, while the CA1→EC5 circuit is crucial for encoding new information into a long-term memory.
cFos Activation in dCA1 and dSub during Memory Encoding and Retrieval
Expression of immediate-early genes (IEGs) has been used to map specific functions onto neuronal activity in a given brain region (Kubik et al., 2007). In order to acquire cellular level evidence supporting the dedicated role of dSub in recall rather than encoding of CFC memory, we monitored IEG cFos activation in dCA1 and dSub during CFC behavior. To measure cFos activation by training or recall, we took advantage of a virus-mediated strategy (Roy et al., 2016) using a cocktail of c-Fos-tTA and TRE-H2B-GFP viruses (Figures 5A– 5B). Wild type mice raised on a doxycycline (DOX) diet to prevent activity-dependent labeling by the injected virus cocktail were taken off DOX 24 hr before CFC encoding or recall to visualize H2B-GFP labeling in CA1 and dSub (Figures 5C–5E). There was significant cFos activation in both CA1 and dSub following encoding or recall epochs as compared to the home cage group (Figure 5F). Interestingly, in dSub, memory recall epochs enhanced cFos activation more compared with encoding epochs, whereas there was no difference of cFos activation in CA1 neurons elicited by these epochs (Figure 5G).
Further, we examined the overlap between behavior-induced cFos in CA1 and CA1 cells that were retrogradely labeled by injection of CTB555 into dSub or medial EC5 (Figure S1Q). Consistent with the optogenetic manipulation experiments, CA1 neurons projecting to EC5 showed higher levels of cFos activation during CFC encoding rather than retrieval, whereas
HHMI A
uthor Man
uscr
ipt
HHMI A
uthor Man
uscr
ipt
HHMI A
uthor Man
uscr
ipt
CA1 neurons projecting to dSub showed higher levels of cFos activation during retrieval (Figure 5H, and see Figures S5K–S5N). To examine CA1 memory engram cell reactivation following recall, among dSub and EC5 projecting subpopulations, we tagged CA1 engram cells formed during CFC encoding using a virus cocktail of c-Fos-tTA and TRE-ChR2-eYFP (Liu et al., 2012), while simultaneously labeling CA1 cells projecting to dSub or medial EC5 with CTB555. One day after training, we quantified the overlap between recall-induced cFos in CA1 and CA1 engram cells that were retrogradely labeled (Figures 5I–5L). Strikingly, dSub-projecting CA1 engram cells showed higher cFos reactivation following memory retrieval compared to EC5-projecting CA1 engram cells (Figure 5M). Next, following CFC recall, we measured cFos activation levels in the basolateral amygdala (BLA), which plays crucial roles in fear memory encoding and recall (Hall et al., 2001). Terminal inhibition of the dSub→EC5 circuit, but not the dCA1→EC5 circuit, decreased cFos levels in the BLA (Figure 5N), further indicating that the direct and indirect dCA1 output circuits have differential functional roles in memory retrieval.
In Vivo Calcium Imaging of dCA1 and dSub Neurons
We also investigated activation of dSub and dCA1 pyramidal cells in response to training and recall by monitoring in vivo calcium (Ca2+) transients using a miniaturized
microendoscope (Kitamura et al., 2015; Sun et al., 2015; Ziv et al., 2013). For this purpose, Cre-dependent GCaMP6f virus was injected into the dSub of FN1-Cre mice to specifically express the Ca2+ indicator in dSub cells (Figure 6A, and see Figures S6A–S6B). As expected, expression of GCaMP6f was restricted to dSub, with no expression in CA1 neurons in these mice (Figures 6B, 6D). Similarly for dCA1 neurons, GCaMP6f virus was injected into the dCA1 of dCA1-specific WFS1-Cre mice (Kitamura et al., 2014, and see Methods) (Figures 6C, 6E). With the open field paradigm (Figures S6C–S6G, and see Movies S1–S2), CA1 neurons showed homogeneous activation profiles, whereas dSub neurons displayed two types of activation profiles (Geva-Sagiv et al., 2016; Sharp and Green, 1994; Staff et al., 2000; Taube, 1993): short-tail cells whose profiles were similar to those of CA1 cells, and long-tail cells in which the post-stimulation activity persisted as long as 15 s (Figures 6F–6G). Consistent with a previous study (Sharp and Green, 1994), dSub neurons exhibited place fields, which were larger in both types of dSub cells compared to CA1 pyramidal cells (Figure 6H, and see Figure S6H).
Next, we investigated Ca2+ activity patterns as mice went through the CFC paradigm (Figure 6I, and see Figures S6I–S6K). CA1 showed an increased percentage of active cells during both training and recall periods compared to the pre-footshock period in the context in which a footshock was subsequently delivered. The dSub neurons showed an increased percentage of active cells during recall compared to the pre-footshock or training periods, and no significant difference of active cell percentages was observed between the latter two periods (top row, Figure 6I). We then divided the training and recall periods into two epochs —non-freezing (NF) and freezing (F)—in order to differentiate an effect of the animal’s movement state (Ranck, 1973) on the proportion of active cells. During training, the proportion of active CA1 cells was greater during F epochs compared to the NF epochs, whereas these proportions were similar during recall. In contrast, the proportions of active dSub cells were greater during recall compared to training regardless whether the mice were
HHMI A
uthor Man
uscr
ipt
HHMI A
uthor Man
uscr
ipt
HHMI A
uthor Man
uscr
ipt
in F or NF epochs. We then subdivided active dSub cells into short-tail and long-tail cells, and found that the proportion of active short-tail cells were greater during recall compared to training regardless whether mice were in F or NF epochs. In contrast, the proportion of active long-tail dSub cells was greater specifically during recall-induced F epochs, compared to the other three types of epochs (bottom row, Figure 6I). Together, and consistent with the behavior and cFos activation experiments, these data demonstrate distinct contributions of dCA1 and dSub cells to memory encoding and memory recall, respectively.
DISCUSSION
It has been established that CA1 and Sub serve as the major output structures of the hippocampus (O’Mara, 2006); however, the functional role of Sub in hippocampus-dependent episodic memory has remained elusive. Here, we have shown that optogenetic inhibition of dSub during recall, but not during encoding, impairs behavioral performance in three hippocampal-dependent memory paradigms: CFC, trace fear-conditioning, and conditioned place preference. The activity of dSub neurons is capable of regulating memory recall bidirectionally: its inhibition impairs recall and its activation enhances recall. To our knowledge, this is the first identification of the specific causal role of dSub neurons in episodic memory recall.
Previously, lesions (Morris et al., 1990) as well as optogenetic inhibition (Goshen et al., 2011) showed that in rodents, neuronal activity in the CA1 subfield is necessary for both the encoding and retrieval of long-term memories. In this study, we employed optogenetic inhibition of specific terminals of CA1 cell projections and found that the CA1→dSub circuit is crucial for memory recall but not for encoding, whereas the CA1→EC5 circuit is crucial for memory encoding but not for recall. Supporting this role of the CA1→dSub circuit is the finding that inhibition of the downstream dSub terminals in medial EC5 also impairs memory recall selectively. Together, these data indicate that the hippocampal output pathways are functionally segregated: episodic memory encoding uses primarily the direct dCA1→EC5 circuit, while episodic memory retrieval uses primarily the indirect
dCA1→dSub→EC5 circuit. The functional dissociation between these two dCA1 output circuits is especially striking given that a significant proportion of dCA1 neurons projecting to dSub and EC5 are overlapping, and that the overall difference in cFos activation levels between dCA1 neurons projecting to dSub versus EC5 during either training or recall epochs is approximately 2% of all dCA1 cells. Further, it is intriguing that we found that about 20% of dCA1 engram cells, those projecting to EC5, are not reactivated by memory recall and thus do not contribute to this behavioral epoch. What could be the purpose of these dCA1 engram cells? We speculate that these engram cells are the stable holder of the original memory, which are undisturbed by a retrieval process, and contribute to the generation of engrams in downstream regions, such as remote memory engram cells in the prefrontal cortex.
The dSub neurons displayed two types of activation profiles—short-tail cells and long-tail cells. These cells may not correspond to the previously reported non-bursting cells and bursting cells (Geva-Sagiv et al., 2016; Sharp and Green, 1994; Staff et al., 2000; Taube, 1993), because the temporal dynamics of bursting activity measured by previous
HHMI A
uthor Man
uscr
ipt
HHMI A
uthor Man
uscr
ipt
HHMI A
uthor Man
uscr
ipt
electrophysiological studies was 10–20 msec, which is different from the long-tail cells identified by calcium transients lasting as long as 6–15 sec. Interestingly, the proportion of active long-tail dSub neurons is greater specifically during recall-induced freezing epochs compared to training-induced freezing epochs. This may be because activation of long-tail cells requires more powerful drive than short-tail cells, and because such a potent drive may be provided only by reactivation of previously formed CA1 engram cells by recall cues (Tonegawa et al., 2015), and not by activation of naïve CA1 cells which occurs during training.
What advantages would the distinct circuits for memory encoding and recall provide? One possible merit may be related to episodic memories with negative valence. Fear memory retrieval by conditioned cues induces not only an instinctive fear response (anxiety, avoidance, freezing, etc.), but also an increase in blood stress hormones that organizes multiple body systems to prepare the animal for a predicted immediate danger (Kelley et al., 2009). While a recent study showed that an area of the rodent’s olfactory cortex plays a key role in the hormonal component of the instinctive fear response to volatile predator odors (Kondoh et al., 2016), neural circuits responsible for triggering both episodic memory retrieval and retrieval-induced stress hormone responses have remained unknown. In this study, we have identified two neural circuits originating from dSub that independently regulate freezing behavior and stress hormone responses to conditioned cues: the
dSub→EC5 circuit mediates appropriate freezing behavior during memory retrieval, while the dSub→MB circuit is crucial for memory retrieval-induced stress responses via bed nucleus of the stria terminalis (BNST) and the hypothalamic corticotropin hormone-releasing neurons (Herman et al., 1998). The preferential activation of long-tail dSub neurons by recall cues may contribute to a sustained enhancement of hormonal release from these downstream areas (Bourque et al., 1993). It has been known that glucocorticoid hormone synthesis is enhanced during memory consolidation (Roozendaal, 2002). Similarly, the retrieval-induced enhancement of CORT may promote memory reconsolidation triggered by recall. Therefore, the Sub→MB pathway may regulate memory retrieval-based emotions and together with the Sub→EC5 pathway that controls the retrieval-based instinctive fear response, would allow for more flexible actions that improve the animal’s survival during challenging events in nature.
Another possible merit of distinct circuits for encoding and retrieval of memory may be to perform rapid memory updating. When a new salient stimulus (such as footshock) is delivered while a subject is recalling a previously acquired memory, the original memory is known to be modified (or updated) by incorporating the concurrently delivered salient stimulus. The diverging followed by converging CA1→dSub→EC5 and CA1→EC5 circuits seem to be ideal for this mnemonic processing: the content of the previously formed memory is retrieved by dSub and a stimulus transmitted directly from CA1 will be co-delivered to EC5 to make a new association resulting in memory updating. It has previously been suggested that such memory updating takes place in the PECFC paradigm by
converting the previously acquired contextual memory to a context-dependent fear memory (Lee, 2010). Our findings, that in the PECFC paradigm, conversion of a contextual memory to a context-dependent fear memory is impaired by either the inhibition of dSub→EC5 terminals targeted to the short (8 sec) context recall period, or inhibition of CA1→EC5
HHMI A
uthor Man
uscr
ipt
HHMI A
uthor Man
uscr
ipt
HHMI A
uthor Man
uscr
ipt
terminals targeted to the period when an association of the recalled context memory with footshock takes place, supports the crucial role of dSub in memory updating.
Our study is on hippocampus-dependent episodic (or episodic-like) memories, which involves information processing by the hippocampus and other medial temporal lobe structures. Additional work is required to examine whether distinct circuits for encoding and retrieval is a property shared by brain regions responsible for the formation of non-episodic memories, which would involve structures other than the temporal lobe. In this context, it is interesting that a recent study with a worm (Caenorhabditis elegans) showed that aversive long-term memory formation and retrieval are carried out by distinct neural circuits (Jin et al., 2016). Therefore, it is possible that distinct circuits for long-term memory formation versus retrieval may be an evolutionarily conserved feature in many species that are capable of learning. With regards to cognitive disorders, it is widely believed that subiculum is among the earliest brain regions affected in Alzheimer’s disease patients (Hyman et al., 1984). Our findings contribute to a better understanding of neural mechanisms underlying episodic memory formation and may provide insights into pathological conditions affecting memory retrieval.
CONTACT FOR REAGENT AND RESOURCE SHARING
Further information and requests for reagents may be directed and will be fulfilled by the corresponding author Susumu Tonegawa (tonegawamit.edu).
EXPERIMENTAL MODEL AND SUBJECT DETAILS
Animals
The C57BL/6J wild type male mice were obtained from Jackson Laboratory. For
optogenetic behavioral manipulations of dCA1 neuronal terminals, we used the previously described CA1-specific TRPC4-Cre transgenic mouse line (Okuyama et al., 2016). For in vivo Ca2+ imaging of dCA1 neurons, we used the previously described dCA1-specific WFS1-Cre transgenic mouse line (Kitamura et al., 2014). WFS1-Cre mice were used for dCA1-specific Ca2+ imaging experiments due to their lower levels of transgene expression compared to TRPC4-Cre mice, which was crucial for stable long-term recordings. All transgenic mouse lines were maintained as hemizygotes. Mice had access to food and water ad libitum and were socially housed in numbers of two to five littermates until surgery. Following surgery, mice were singly housed. For behavioral experiments, all mice were male and 3–5 months old. For virus-mediated activity-dependent labeling experiments (Roy et al., 2016), male mice had been raised on food containing 40 mg kg−1 doxycycline (DOX) for at least one week before surgery, and remained on DOX for the remainder of the experiments except for 24 hr preceding the target labeling day. For CLARITY and in vivo Ca2+ imaging experiments, male mice were 4–6 months old at the time of surgery. All experiments were conducted in accordance with U.S. National Institutes of Health (NIH) guidelines and the Massachusetts Institute of Technology Department of Comparative Medicine and Committee of Animal Care.
HHMI A
uthor Man
uscr
ipt
HHMI A
uthor Man
uscr
ipt
HHMI A
uthor Man
uscr
ipt
Generation of FN1-Cre mice
Bacterial artificial chromosome (BAC) recombineering was carried out using the EL250 bacterial strain, provided by Dr. Neal Copeland at the Houston Methodist Research Institute. BAC clone RP24-211L16 containing the whole FN1 (NM_001276408.1, Mus musculus fibronectin 1) was obtained from Invitrogen and transferred into EL250. To introduce the Cre sequence in-frame following the first exon of FN1, a BAC modifying cassette was prepared: a 5’ homology arm, Cre, the kanamycin resistance gene flanked by FRTs, and a 3’ homology arm. The modifying cassette was electroporated into EL250 carrying the BAC clone. Resistant clones were selected and confirmed for appropriate homologous recombination, after which kanamycin was removed using the site-specific recombinase FLP. Purified DNA from the selected clone containing the modified BAC was digested with NotI, which cut both ends of the insert. Insert DNA was purified (1 ng/µl) and microinjected into C57BL/6JCrlj male pronuclei of fertilized eggs. Two-cell stage embryos were
transferred to pseudopregnant recipient female mice. The C57BL/6J-Tg(FN1-Cre)41(RBRC03020) transgenic mice were established and maintained in the same background. Cre mRNA expression was visualized by in situ hybridization as previously described (Okuyama et al., 2016).
METHOD DETAILS
Viral constructs
The AAV9-EF1α-DIO-eYFP, AAV9-EF1α-DIO-ChR2-eYFP, and AAV9-EF1
α-DIO-eArch3.0-eYFP viruses were acquired from the University of North Carolina (UNC) at Chapel Hill Vector Core. The AAV9-EF1α-DIO-mCherry, AAV9-EF1
α-DIO-eArch3.0-mCherry, and AAV9-EF1α-eArch3.0-eYFP viruses were acquired from Vector BioLabs. The
AAV2-Syn-DIO-GCaMP6f and AAV5-Syn-DIO-GCaMP6f viruses were acquired from the
University of Pennsylvania Vector Core. The AAV8-CMV-DIO-Synaptophysin-mCherry
construct was provided by Dr. Rachael Neve at the MIT Viral Gene Transfer Core and packaged at the University of Massachusetts Medical School Gene Therapy Center and Vector Core. The pAAV-EF1α-DIO-H2B-GFP plasmid was constructed by cloning the histone H2B gene into a pAAV-EF1α-DIO-GFP backbone, which was serotyped with AAV9
coat proteins and packaged at Vigene Biosciences. The c-Fos-tTA (Roy et al., 2016) and TRE-H2B-GFP (Okuyama et al., 2016) vectors were serotyped with AAV9 and AAV5 coat
proteins respectively, and packaged at the University of Massachusetts Medical School Gene Therapy Center and Vector Core. The TRE-ChR2-eYFP (Liu et al., 2012) vector was serotyped with AAV9 coat proteins and packaged at Vigene Biosciences. We used our
previously established method (Roy et al., 2016) for labeling memory engram cells using a virus cocktail of c-Fos-tTA and TRE-H2B-GFP or c-Fos-tTA and TRE-ChR2-eYFP (Figure 5J). Viral titers were 1.2 × 10¹³ genome copy (GC) ml−1 for AAV9-EF1α-DIO-eYFP, 4 ×
1012 GC ml−1 for AAV9-EF1α-DIO-ChR2-eYFP, 1.6 × 10¹³ GC ml−1 for AAV9-EF1
α-DIO-eArch3.0-eYFP, 3 × 10¹³ GC ml−1 for AAV9-EF1α-DIO-mCherry and AAV9-EF1
α-DIO-eArch3.0-mCherry, 1 × 10¹¹ GC ml−1 for AAV9-EF1α-eArch3.0-eYFP, 4 × 10¹² GC
ml−1 for AAV2-Syn-DIO-GCaMP6f and AAV5-Syn-DIO-GCaMP6f, 1.1 × 10¹³ GC ml−1 for
AAV8-CMV-DIO-Synaptophysin-mCherry, 2 × 10¹⁴ GC ml−1 for AAV9-EF1
α-DIO-H2B-HHMI A
uthor Man
uscr
ipt
HHMI A
uthor Man
uscr
ipt
HHMI A
uthor Man
uscr
ipt
GFP, 4 × 10¹³ GC ml−1 for AAV9-c-Fos-tTA, 1.4 × 10¹³ GC ml−1 for AAV5-TRE-H2B-GFP,
and 1.5 × 10¹³ GC ml−1 for AAV9-TRE-ChR2-eYFP.
Surgery and optic fiber implants
Mice were anesthetized with isoflurane or 500 mg kg−1 avertin for stereotaxic injections. Injections were targeted bilaterally to the dCA1 (−2.1 mm AP, +/− 1.5 mm ML, −1.4 mm DV), dSub (−3.08 mm AP, +/− 1.5 mm ML, −1.5 mm DV), vSub (−4.2 mm AP, +/− 3.25 ML, −4.0 mm DV), medial EC5 (−4.63 mm AP, +/− 3.36 mm ML, −2.55 mm DV), MB (−2.8 mm AP, +/− 0.35 mm ML, −4.9 mm DV), and lateral EC5 (−3.40 mm AP, +/− 4.0 mm ML, −4.30 mm DV). Injection volumes were 400 nl for dCA1, 200 nl for dSub and vSub, 300 nl for medial EC5, 300 nl for MB, and 400 nl for lateral EC5. Viruses were injected at 70 nl min−1 using a glass micropipette attached to a 10 ml Hamilton microsyringe. The needle was lowered to the target site and remained for 5 min before beginning the injection. After the injection, the needle stayed for 10 min before it was withdrawn. Custom dSub and MB implants containing two optic fibers (200 mm core diameter; Doric Lenses) was lowered above the injection site (dSub: −3.08 mm AP, +/− 1.5 mm ML, −1.2 mm DV; MB: −2.8 mm AP, +/− 0.35 mm ML, −4.8 mm DV). Single optic fiber implants (200 mm core diameter; Doric Lenses) were lowered above the EC5 injection sites (−4.8 mm AP, +/− 3.36 mm ML, −2.20 mm DV). The implant was secured to the skull with two jewelry screws, adhesive cement (C&B Metabond) and dental cement. An opaque cap derived from the top part of an Eppendorf tube protected the implant. Mice were given 1.5 mg kg−1 metacam as analgesic and allowed to recover for 2 weeks before behavioral experiments. All injection sites were verified histologically. As criteria, we only included mice with virus expression limited to the targeted regions.
Retrograde neuronal tracing
Cholera toxin subunit B—To characterize neuronal populations in dSub and dCA1 based on downstream projection targets, we used cholera toxin subunit B (CTB) conjugated to Alexa-488 or Alexa-555 diluted in phosphate buffered saline (PBS) solution at a final concentration of 1% wt vol−1. Diluted CTB was aliquoted and stored at −20°C. For tracing experiments, 50–200 nl CTB was unilaterally injected into target sites. Six days after injections, mice were perfused for histology and imaging.
Rabies virus—To identify major inputs to dSub Cre+ neurons, we used a monosynaptic retrograde tracing approach via a Cre-dependent helper virus combined with rabies virus (RV) technology. The first component was an AAV vector that allowed simultaneous expression of three genes: TVA, eGFP, and RV glycoprotein (G). Briefly, this vector was constructed by deleting the sequence between the inverse terminal repeats of pAAV-MCS (Stratagene), and replacing it with a cassette containing the following: human synapsin-1 promoter (Syn, Genbank NG_008437); the Kozak sequence; a FLEX cassette containing the transmembrane isoform of TVA (lacking a start codon), eGFP, and G separated by the highly efficient porcine teschovirus self-cleaving 2A element; the woodchuck post-transcriptional regulatory element (WPRE) and a bovine growth hormone polyadenylation site. This vector was termed pAAV-synP-FLEX-sTpEpB (i.e., the helper virus), serotyped with AAVrh8 coat
proteins, and packaged at the University of Pennsylvania Vector Core. The second
HHMI A
uthor Man
uscr
ipt
HHMI A
uthor Man
uscr
ipt
HHMI A
uthor Man
uscr
ipt
component was a deletion-mutant RV produced by replacing the eGFP gene in
cSPBN-4GFP with the mCherry gene (i.e., the RVΔG-mCherry virus, also known as the rabies virus), which was packaged with the ASLV-A envelope protein. For tracing
experiments, 50 nl of the Cre-dependent helper virus was unilaterally injected into dSub of FN1-Cre mice. One week later, 50 nl of RVΔG-mCherry virus was unilaterally injected into the same dSub. Six days after the second viral injection, mice were perfused for histology and imaging.
Immunohistochemistry—Mice were dispatched using 750–1000 mg kg−1 avertin and transcardially perfused with PBS, followed by 4% paraformaldehyde (PFA). Brains were extracted and incubated in 4% PFA at room temperature overnight. Brains were transferred to PBS and 50 µm coronal slices were prepared using a vibratome. For immunostaining, each slice was placed in PBS + 0.2% Triton X-100 (PBS-T), with 5% normal goat serum for 1 hr and then incubated with primary antibody at 4°C for 24 hr. Slices then underwent three wash steps for 10 min each in PBS-T, followed by a 2 hr incubation with secondary antibody. After three more wash steps of 10 min each in PBS-T, slices were mounted on microscope slides. All analyses were performed blind to the experimental conditions. Antibodies used for staining were as follows: CA1-specific excitatory neurons were stained with rabbit anti-WFS1 (1:400, Proteintech) and anti-rabbit Alexa-555 (1:500), excitatory neurons were stained with mouse anti-CaMKII (1:200, Abcam) and anti-mouse Alexa-555 (1:300), inhibitory neurons were stained with mouse anti-GAD67 (1:500, Millipore) and anti-mouse Alexa-555 (1:300), nuclei were stained with DAPI (1:3000, Sigma), neuronal nuclei were stained with mouse anti-NeuN (1:200, Millipore) and anti-mouse Alexa-555 (1:300), parvalbumin inhibitory neurons were stained with mouse anti-PV (1:500, Swant) and anti-mouse Alexa-555 (1:300), Wisteria floribunda lectin was stained with biotinylated WFA lectin (1:3000, Vector Labs) and streptavidin Alexa-555 (1:200), calbindin was stained with mouse anti-CALB (1:500, Swant) and anti-mouse Alexa-555 (1:300), vesicular glutamate transporter 1 was stained with rabbit anti-VGLUT1 (1:1000, Synaptic Systems) and anti-rabbit Alexa-488 (1:300), vesicular glutamate transporter 2 was stained with rabbit anti-VGLUT2 (1:500, Synaptic Systems) and anti-rabbit Alexa-488 (1:300), vesicular glutamate transporter 3 was stained with guinea pig anti-VGLUT3 (1:1000, Millipore) and guinea pig Alexa-488 (1:500), myelin basic protein (MBP) was stained with rabbit anti-MBP (1:1000, Abcam) and anti-rabbit Alexa-546, cFos was stained with rabbit anti-cFos (1:400, Santa Cruz Biotechnology) and anti-rabbit Alexa-488, and TRE-ChR2-eYFP (Figure 5J) was stained with chicken anti-GFP (1:1000, Life Technologies) and anti-chicken
Alexa-633.
CLARITY—Mice were anesthetized with 750–1000 mg kg−1 avertin and transcardially perfused with a hydrogel monomer solution containing 4% acrylamide, 0.05% bis-acrylamide, 0.25% VA-044 initiator, and 4% PFA in PBS. Brains were incubated in the monomer solution at 4°C for 48–72 hr. For hydrogel tissue embedding, the brains were degassed in a desiccation chamber replacing all the gas with nitrogen, after which polymerization was initiated by raising the solution temperature to 37°C for 1 hr. Brains were extracted from the hydrogel, and washed in clearing solution containing 200 mM boric acid, 4% sodium dodecyl sulfate (SDS), and sodium hydroxide (pH 8.5) at 37°C for 24 hr.
HHMI A
uthor Man
uscr
ipt
HHMI A
uthor Man
uscr
ipt
HHMI A
uthor Man
uscr
ipt
Brains were placed in a custom-built electrophoretic tissue-clearing (ETC) chamber, as previously described (Chung et al., 2013). Clearing solution was circulated through the ETC chamber at 37°C for 3 days along with 15V application across the brain sample. After clearing, brains were washed twice for 24 hr each in PBS-T at room temperature. Before imaging, brains were incubated in FocusClear solution for 2 days at room temperature to achieve the optimal refractive index of 1.45. Whole brain fluorescence z-stacks were acquired using a light sheet fluorescence microscope (5×). Stitching and high resolution rendering of z-stacks was performed using an Arivis Vision4D software package at the Harvard Center for Biological Imaging (HCBI).
Cell counting—To quantify the number of neurons in each brain region projecting to dSub Cre+ neurons, rabies virus (RV)-mCherry+ neurons in each target structure were counted from 4–5 sagittal slices per mouse (n = 4 mice). To quantify the number of dCA1 neurons projecting to lateral EC5, CTB555+ neurons were counted from 5–6 coronal slices per mouse (n = 3 mice). Fluorescence images were acquired using a Zeiss AxioImager.Z1/ ApoTome microscope (10, 20, or 40×). Automated cell counting analysis was performed using ImageJ software. DAPI+ counts were approximated from 5 sagittal slices using ImageJ. Percentage of neurons in each brain region projecting to dSub was calculated as ((mCherry+) / (Total DAPI+)) × 100. To characterize dSub Cre+ eYFP neurons, the overlap between eYFP and several molecular markers (labeled with mCherry-tagged antibodies) were examined. The number of eYFP+, mCherry+, and eYFP+ mCherry+ neurons were counted from 4–5 sagittal slices per mouse (n = 3 mice per group). Percentage of dSub Cre+ neurons expressing the different molecular markers was calculated as ((eYFP+ mCherry+) / (Total eYFP+)) × 100. A similar quantification strategy was used to examine the overlap of cholera toxin subunit B (CTB) 488 and 555 from different downstream brain regions in dSub and dCA1, as well as the overlap of RV-mCherry and CTB488 from different downstream brain regions in dCA1. For these retrograde tracing experiments, the percentage of overlap was calculated as ((eYFP+ mCherry+) / (Total DAPI+)) × 100. Chance overlap calculated as ((eYFP+ / Total DAPI+) × (mCherry+ / Total DAPI+)) × 100, where eYFP+ and mCherry+ represents the total population of cells labeled by eYFP and mCherry, respectively. For activity-dependent labeling experiments using cFos (as TRE-H2B-GFP signal) or cFos staining, cFos+ neurons were counted from 5–7 sagittal or coronal slices per mouse (n = 5–6 mice). The cell body layers of dCA1, dSub, EC5, MB, or basolateral amygdala (BLA) were outlined as regions of interest (ROIs) and the percentage of cFos+ neurons were calculated as ((cFos+) / (Total DAPI+)) × 100. For cFos+ CTB555+ neurons in dCA1, percentage overlap was calculated as ((cFos+ CTB555+) / (Total DAPI+)) × 100. Chance overlap calculated as ((cFos+ / Total DAPI+) × (CTB555+ / Total DAPI+)) × 100, where cFos+ and CTB555+ represents the total population of cells labeled by cFos and CTB555, respectively. For cFos+ ChR2+ CTB555+ neurons in dCA1 (Figure 5M), percentage overlap was
calculated as ((cFos+ ChR2+ CTB555+) / (Total DAPI+)) × 100. The numbers of fluorophore-positive cells per section were quantified after applying a threshold above background fluorescence. Data were analyzed using Microsoft Excel with the Statplus plug-in, or Prism 6 software. All counting experiments were conducted blind to experimental group. Researcher 1 trained the animals, prepared slices and randomized images, while Researcher 2 performed semi-automated cell counting. Statistical comparisons were
HHMI A
uthor Man
uscr
ipt
HHMI A
uthor Man
uscr
ipt
HHMI A
uthor Man
uscr
ipt
performed using unpaired t tests, one-sample t tests, and Fisher’s exact tests: *P < 0.05, **P < 0.01, ***P < 0.001.
In vivo calcium imaging
Microendoscope surgery—We used our previously established method (Kitamura et al., 2015; Sun et al., 2015) for microendoscope surgeries. Briefly, for Ca2+ imaging
experiments, unilateral injections were targeted to the right dSub of FN1-Cre mice or the right dCA1 of WFS1-Cre mice. Mice were injected with AAV2-Syn-DIO-GCaMP6f
(FN1-Cre) or AAV5-Syn-DIO-GCaMP6f (WFS1-Cre). One month after AAV injection, we
implanted a microendoscope lens (1 mm diameter) above the dorsal region of CA1 (−2.0 mm AP, +/− 1.5 mm ML, −1.2 mm DV), specifically targeting the medial region along the proximodistal axis, or the dorsal region of Sub (−3.1 mm AP, +/− 1.5 mm ML, −1.0 mm DV). These microendoscope lenses have a working distance of 0.3 mm (Inscopix, Inc.). One month later, the baseplate for a miniaturized microscope camera (Ziv et al., 2013) was attached above the implanted microendoscope. Following baseplate surgeries, mice were habituated to investigator handling and the attachment of a microscope camera for 2 weeks.
Imaging during open field and CFC—Mice were housed in a reverse light cycle room (dark period: 9 am to 9 pm). This is different from the light cycle room for the optogenetic behavior experiments (see below). This was necessary in order to maximize the animal’s movement during the open field experiments for best coverage of the arena, which was crucial to examine spatial information and place field properties. All Ca2+ imaging
experiments were performed during the dark cycle. Open field tests were conducted using a 50 × 50 cm white plastic platform, which lacked walls and was raised by 15 cm above the table. Under dim light conditions, Ca2+ activity in the open field arena was collected for 30 min per mouse in order to obtain sufficient numbers of transients for adequately powered statistical analyses. Contextual fear conditioning (CFC) tests were conducted using a 29 × 25 × 22 cm chamber with grid floors, dim white lighting, and scented with 1% acetic acid. Mice were conditioned (300 s exploration, one 0.75 mA shock of 2 s duration at 300 s, 120 s post-shock period). One day later, mice were returned to the conditioned chamber (7 min) to assess memory recall-induced freezing behavior. Before and between runs in the open field and CFC paradigms, the experimental apparatus was cleaned with quatricide. Mouse behavior, specifically position tracking and freezing epochs, was recorded using an automated infrared (IR) detection system (EthoVision XT, Noldus). As we previously described (Kitamura et al., 2015; Sun et al., 2015), Ca2+ events were captured at 20 Hz on an Inscopix miniature microscope.
Image processing and cell identification—We used our previously established method (Sun et al., 2015) for image processing and single cell identification analyses. Briefly, Ca2+ imaging movies were motion corrected using Inscopix Mosaic software: translation and rotation; reference region with spatial mean (r = 20 pixels) subtracted, inverted, and spatial mean (r = 5 pixels) applied. Using ImageJ software, each image was divided one pixel at a time by a low pass (r = 20 pixels) filtered version, after which the ΔF/F signal was calculated. Two hundred cell regions of interest (ROIs) were carefully selected from the resulting movie by PCA-ICA method (300 output PCs, 200 ICs, 0.1
HHMI A
uthor Man
uscr
ipt
HHMI A
uthor Man
uscr
ipt
HHMI A
uthor Man
uscr
ipt
weight of temporal information in spatio-temporal ICA, 750 iterations maximum, 1 × 10⁻⁵ fractional change to end iterations) in Inscopix Mosaic software, and the independent components (ICs) were binarized using a threshold of 0.5 of the maximum intensity. Non-circular ROIs (i.e., if its length exceeded its width by greater than 2 times) were not included in the analysis. Ca2+ events were detected by applying a threshold (greater than 2 standard deviations from the ΔF/F signal) at the local maxima of the ΔF/F signal. Since we employed GCaMP6f, our analysis used a threshold of >=5 frames (~250 ms). Events that occurred within 250 ms of a previous Ca2+ event were excluded from the analysis. For ICs that satisfied all criteria, Ca2+ traces during behavior were computed. For open field, using this high resolution spatial map, the distribution of Ca2+ events were calculated, while event rate heat maps were calculated by binning the behavioral arena into 50 × 50 array bins, each of which covered a 2 × 2 cm area. Smoothed rate heat maps were constructed with each pixel boxcar averaged over the surrounding 5 × 5 pixel area using a Gaussian smoothing kernel (σ = 2 pixels). For CFC, 8–15 s epochs during pre-footshock periods (Pre), and non-freezing (NF) and freezing (F) periods of training and recall were examined. The total duration examined within each test session was held constant across mice. For the NF and F epoch analysis, the total time was held constant across each of the test sessions, which was necessary in order to make meaningful comparisons between these epochs. On average, 10– 20 epochs per mouse were analyzed. Active cells (Figure 6I) were defined as those
exhibiting at least 15 significant Ca2+ events during a given recording session. We confirmed that these active cell results show robustness to change around this value (15) in the range of 10–18 significant Ca2+ events.
Spatial information, place field size, and sparsity—We used our previously established method (Sun et al., 2015) for these analyses. Briefly, the behavior position tracking data was sorted into 5 × 5 cm spatial bins. Ca2+ event rate per spatial bin was calculated for all dCA1 and dSub cells. Individual spatial bins were accepted if their event rate exceeded 0.2 Hz. Bins that had mouse occupancy duration less than 100 ms were not included in the analysis. Without smoothing, the spatial information rate in bits per second was calculated for each cell according to (Skaggs et al., 1992):
where pi is the probability of the mouse occupying the i-th bin for all i, λi is the mean Ca2+
event rate in the i-th bin, and λ is the overall Ca2+ event rate. Cells with significant spatial information were identified as those above the 95th percentile of all shuffles (all cell event times were shuffled 100 times, for a total of approximately 20,000 shuffles per mouse). To identify a place field, the criterion was at least 4 contiguous spatial bins (16 cm2). For each place cell, only the largest place field was considered for the place field size analysis. Single cell sparsity is defined as <R>2 / <R>2, where R is the calcium activity rate in a particular spatial bin, and **< > denotes the average value over all spatial bins. A sparsity of 0.15 indicates that the cell is active in 15% of the open field arena (Treves and Rolls, 1992).
HHMI A
uthor Man
uscr
ipt
HHMI A
uthor Man
uscr
ipt
HHMI A
uthor Man
uscr
ipt
Classification of short and long tail cells—For each dCA1 and dSub cell, Ca2+ events that were greater than 4 standard deviations were included for this analysis. For each cell and each Ca2+ event, the total time to decay to 0.33 the maximum value was defined as the event width. Cells that had an average decay time of less than 3.5 s were categorized as short tail cells, while cells that had an average decay time of greater than 3.5 s were categorized as long tail cells. We confirmed that these cell type classification results show robustness to change around this value (3.5 s) in the range of 3.0–4.0 s. The distributions of individual calcium transient durations for the entire population of dCA1 and dSub cells were plotted (the x-axes used a logarithmic scale for optimal visualization of the data). A line fit was included in each population distribution (black lines). The cell type classification results are supported by the fact that dSub calcium transient durations showed a bimodal
distribution (Figure S6C).
Corticosterone assay—To measure stress responses following behavior, we used a CORT enzyme-linked immunosorbant assay (ELISA; Enzo Life Sciences). One hour after training or testing sessions, we collected trunk whole blood. For sample collection following optogenetic manipulations (Figure 3G), ChR2 activation (40 min blue light on) and eArch inhibition (10 min green light on, 2 min green light off, repeated for 40 min) was carried out immediately after CFC training or recall. Specifically, once mice were removed from the CFC training context, they were returned to their home cages, optic fibers were attached, and optogenetic manipulations were initiated. Details of the laser light sources and power are provided in the optogenetic manipulations section (see below). Samples remained on ice until centrifugation (2000 × g, for 10 min) to isolate blood plasma. Plasma samples were aliquoted and stored at −80°C. 1–3 days after plasma collection, ELISA assays were performed.
Behavior assays—Experiments were conducted during the light cycle (7 am to 7 pm). Mice were randomly assigned to experimental groups for specific behavioral assays
immediately after surgery. Mice were habituated to investigator handling for 1–2 minutes on three consecutive days. Handling took place in the holding room where the mice were housed. Prior to each handling session, mice were transported by wheeled cart to and from the vicinity of the behavior rooms to habituate them to the journey. For natural memory recall sessions, data were quantified using FreezeFrame software. Optogenetic
manipulations interfered with motion detection, and therefore freezing behavior in these experiments were manually quantified. All behavior experiments were analyzed blind to experimental group. Unpaired student’s t-tests were used for independent group
comparisons, with Welch’s correction when group variances were significantly different, or two-way ANOVAs followed by Bonferroni post-hoc tests were used. Given behavioral variability, initial assays were performed using a minimum of 10 mice per group to ensure adequate power for any observed differences. Following behavioral protocols, brain sections were prepared to confirm efficient viral labeling in target areas. Animals lacking adequate labeling were excluded prior to behavior quantification.
Contextual fear-conditioning—Two distinct contexts were employed (Roy et al., 2016). The conditioning context were 29 × 25 × 22 cm chambers with grid floors, dim white
HHMI A
uthor Man
uscr
ipt
HHMI A
uthor Man
uscr
ipt
HHMI A
uthor Man
uscr
ipt
lighting, and scented with 0.25% benzaldehyde. The neutral context consisted of 30 × 25 × 33 cm chambers with white perspex floors, red lighting, and scented with 1% acetic acid. All mice were conditioned (180 s exploration, one 0.75 mA shock of 2 s duration at 180 s, 120 s post-shock period), and tested (3 min) one day later. Experiments showed no
generalization in the neutral context. Floors of chambers were cleaned with quatricide before and between runs. Mice were transported to and from the experimental room in their home cages using a wheeled cart. The cart and cages remained in an anteroom to the experimental rooms during all behavioral experiments. For activity-dependent labeling using cFos (as H2B-GFP signal), mice were kept on regular food without DOX for 24 hours prior to training or recall. When training or recall was complete, mice were switched back to food containing 40 mg kg−1 DOX.
Trace and delay fear-conditioning—The conditioning context were 29 × 25 × 22 cm chambers with grid floors, bright white lighting, and scented with 1% acetic acid. The recall test context consisted of 30 × 25 × 33 cm chambers with white perspex floors, red lighting, and scented with 0.25% benzaldehyde. For trace fear-conditioning, mice were conditioned (240 s exploration, 20 s tone, 20 s trace period, a 0.75 mA shock of 2 s duration at 280 s, 60 s post-shock period, repeated 3 more times). For delay fear-conditioning, mice were conditioned (240 s exploration, 20 s tone co-terminating with a 0.75 mA shock of 2 s duration, 60 s post-shock period, repeated 3 more time). For both paradigms, memory recall was tested (14 min; 2 min exploration, 60 s tone, 120 s post-tone period, repeated 3 more times) one day later. The tone was calibrated to 75 dB SPL, with a frequency of 2 kHz. Experiments showed no generalization in the recall test context.
Conditioned place preference—The conditioned place preference (CPP) behavior chamber was a rectangular arena (40 × 15 cm), divided into three quadrants (left, middle, right). The left and right quadrants were 15 cm long, while the middle quadrant was 10 cm long. The left quadrant had grid floors and a pattern (series of parallel lines) on the wall. The right quadrant had smooth polypropylene floors and a pattern (series of circles) on the wall. On day 1 (pre-exposure), mice were allowed to explore the entire arena for 30 min.
Experiments showed no preference to any one quadrant. On day 2 (training), mice were confined to the left or right quadrants for 20 min following cocaine (20 mg kg−1) or saline intraperitoneal administration. On days 3–7 (training continued), mice were conditioned in opposite quadrants in an alternating manner (i.e., cocaine left-saline right-cocaine left, etc.) until every mouse received 3 cocaine and 3 saline pairings. For every behavioral cohort, half the mice were conditioned with cocaine in the left quadrant, while the remaining mice received cocaine in the right quadrant. On day 8, memory recall was measured by preference to the left or right quadrant (10 min). All sessions were performed with dim white lighting. Mouse behavior, specifically position tracking and duration, was recorded using an automated infrared (IR) detection system (EthoVision XT, Noldus). The tracking software plotted heat maps for each mouse, which was averaged to create representative heat maps for each group. Raw data was extracted and analyzed using Microsoft Excel.
Memory updating—We employed the pre-exposure mediated contextual
fear-conditioning (PECFC) paradigm to examine memory updating. The behavior context were
HHMI A
uthor Man
uscr
ipt
HHMI A
uthor Man
uscr
ipt
HHMI A
uthor Man
uscr
ipt
29 × 25 × 22 cm chambers with grid floors, dim white lighting, and scented with 0.25% benzaldehyde. On day 1, mice were allowed to explore the context for 6 min. On day 2, mice were conditioned (8 s exploration, one 0.75 mA shock of 2 s duration at 8 s, no post-shock period), and tested for 3 min one day later (day 3).
Open field assay—Spontaneous motor activity was measured in an open field arena (52 × 26 cm) for 10 min. Mice were transferred to the testing room and acclimated for 30 min before the test session. During the testing period, lighting in the room was turned off. The apparatus was cleaned with quatricide before and between runs. Total movement (distance traveled and velocity) in the arena was quantified using an automated infrared (IR) detection system (EthoVision XT, Noldus). The tracking software plotted heat maps for each mouse, which was averaged to create representative heat maps for each group. Raw data were extracted and analyzed using Microsoft Excel.
Optogenetic manipulations—All behavioral paradigms were performed as described above. For experiments that included optogenetic manipulations, the behavior chamber ceilings were customized to hold a rotary joint (Doric Lenses) connected to two 0.32 m optic fibers. All mice had optic fibers attached to their optic fiber implants prior to training and recall tests. For ChR2 experiments, dSub terminals were stimulated at 20 Hz (15 ms pulse width) using a 473 nm laser (10–15 mW, blue light), for the entire duration (3 min) of CFC recall tests or neutral context tests (Figures 3D, S4A). For eArch experiments, dSub cell bodies/terminals, vSub terminals, and dCA1 terminals were inhibited using a 561 nm laser (10 mW, constant green light). For CFC experiments (Figures 3A, 3B, 3C, 4I, 4J, 4K, 4L; Figures S2, S3), green light inhibition was performed during the entire duration (3 min) of training or recall tests. For TFC and DFC training experiments (Figures S4B, S4D), green light inhibition was performed during the entire duration from tone initiation through shock delivery (for all tone-shock pairings). The following day, tone-induced memory recall was tested without green light. For TFC and DFC recall experiments (Figures 3E, S4C, S4E), green light inhibition was performed during the first and third tones (each tone is 60 s) in half the mice, while the remaining mice received inhibition during the second and fourth tones. This reflects a counter-balanced experimental design. For CPP training experiments (Figure S4F), green light inhibition was performed during days 2–7, for the entire 20 min session per day (9 min green light on, 1 min green light off, 10 min green light on). For CPP recall experiments (Figures 3F, S4G), green light inhibition was performed during the entire duration (10 min) of recall tests on day 8. For memory updating experiments (Figures 4M, 4N), green light inhibition was performed during the entire pre-footshock periods (first 8 s on day 2, left panels) or during the footshock periods alone (last 2 s on day 2, right panels). For open field experiments (Figure S2M), green light inhibition was performed during the entire duration (10 min).
QUANTIFICATION AND STATISTICAL ANALYSIS
Data are presented as mean values accompanied by SEM. No statistical methods were used to predetermine sample sizes. Data analysis was performed blind to the conditions of the experiments. Data were analyzed using Microsoft Excel with the Statplus plug-in and Prism 6 software. Two-way ANOVA followed by Bonferroni post-hoc test, unpaired t test, Fisher’s
HHMI A
uthor Man
uscr
ipt
HHMI A
uthor Man
uscr
ipt
HHMI A
uthor Man
uscr
ipt
exact test, one-sample t test, and paired t test were used to test for statistical significance when appropriate. Statistical parameters including the exact value of n, precision measures (mean ± SEM), and statistical significance are reported in the figure legends. The
significance threshold was placed at α = 0.05 (NS, P > 0.05; *, P < 0.05; **, P < 0.01; ***, P < 0.001).
Supplementary Material
Refer to Web version on PubMed Central for supplementary material.
Acknowledgments
We thank S. LeBlanc, S. Huang, A. Arons, J. Martin, L. Smith, F. Bushard, A. Hamalian, W. Yu, and C. Lovett for help with experiments; N. Mise and Y. Koga for help with generating the dorsal subiculum mouse line; M. Morrissey for comments; L. Brenner for proofreading; and all members of the Tonegawa laboratory for their support. We thank Ian Wickersham for providing rabies virus, Ki Goosens for sharing a microplate reader, and the Harvard Center for Biological Imaging for access to a light sheet fluorescence microscope. This work was supported by the RIKEN Brain Science Institute, the Howard Hughes Medical Institute, and the JPB Foundation (to S.T.).
References
Bourque CW, Oliet SH, Kirkpatrick K, Richard D, Fisher TE. Extrinsic and intrinsic modulatory mechanisms involved in regulating the electrical activity of supraoptic neurons. Ann. N. Y. Acad. Sci. 1993; 689:512–519. [PubMed: 8396876]
Chung K, Wallace J, Kim SY, Kalyanasundaram S, Andalman AS, Davidson TJ, Mirzabekov JJ, Zalocusky KA, Mattis J, Denisin AK, et al. Structural and molecular interrogation of intact biological systems. Nature. 2013; 497:332–337. [PubMed: 23575631]
Deng W, Aimone JB, Gage FH. New neurons and new memories: how does adult hippocampal neurogenesis affect learning and memory? Nat. Rev. Neurosci. 2010; 11:339–350. [PubMed: 20354534]
Ding SL. Comparative anatomy of the prosubiculum, subiculum, presubiculum, postsubiculum, and parasubiculum in human, monkey, and rodent. J. Comp. Neurol. 2013; 521:4145–4162. [PubMed: 23839777]
Eichenbaum E, Yonelinas AP, Ranganath C. The medial temporal lobe and recognition memory. Annu. Rev. Neurosci. 2007; 30:123–152. [PubMed: 17417939]
Eldridge LL, Engel S, Zeineh MM, Bookheimer SY, Knowlton BJ. A dissociation of encoding and retrieval processes in the human hippocampus. J. Neurosci. 2005; 25:3280–3286. [PubMed: 15800182]
Gabrieli JD, Brewer JB, Desmond JE, Glover GH. Separate neural bases of two fundamental memory processes in the human medial temporal lobe. Science. 1997; 276:264–266. [PubMed: 9092477] Geva-Sagiv M, Romani S, Las L, Ulanovsky N. Hippocampal global remapping for different sensory
modalities in flying bats. Nat. Neurosci. 2016; 19:952–958. [PubMed: 27239936]
Goshen I, Brodsky M, Prakash R, Wallace J, Gradinaru V, Ramakrishnan C, Deisseroth K. Dynamics of retrieval strategies for remote memories. Cell. 2011; 147:678–689. [PubMed: 22019004] Hall J, Thomas KL, Everitt BJ. Fear memory retrieval induces CREB phosphorylation and Fos
expression within the amygdala. Eur. J. Neurosci. 2001; 13:1453–1458. [PubMed: 11298807] Hasselmo ME, McClelland JL. Neural models of memory. Curr. Opin. Neurobiol. 1999; 9:184–188.
[PubMed: 10322183]
Herman JP, Dolgas CM, Carlson SL. Ventral subiculum regulates
hypothalamo-pituitary-adrenocortical and behavioural responses to cognitive stressors. Neuroscience. 1998; 86:449–459. [PubMed: 9881860]