Do Women Who Die of Early Breast Cancer Experience a Burst of Mutations During the Growth of the Mammary Gland in Puberty?
by
Paula Maria Lee
S.B. Civil and Environmental Engineering , Massachusetts Institute of Technology (June, 1993)
Submitted to the Division of Toxicology
in Partial Fulfillment of the Requirements for the Degree of Master of Science
in Toxicology at the
MASSACHUSETTS INSTITUTE OF TECHNOLOGY June 1996
© Massachusetts Institute of Technology 1996 All rights reserved
Author
Division of Toxicology May 30, 1996
Certifiedby l
Professor William G. Thilly Thesis Supervisor
Acceptedby Professor Peter Dedon
,.ASSAuCHSE-TTrS N i •• Chairman, Department Committee on Graduate Students OF TECHNOi.0OGY
ACKNOWLEDGMENTS
I would first like to thank my advisor, Professor William Thilly for giving me the opportunity to work on this project and for his guidance throughout. His scientific rigor and enthusiasm for numerical analysis motivated me to always strive beyond the surface analysis.
I would also like to thank Gengxi Hu, who graciously taught me the molecular biology skills necessary for surviving in the lab and for instilling in me a healthy dose of scientific cynicism. I would especially like to thank Paulo Andre, aka (Paulinho) for all his support and patient late night and early morning discussions of the meaning of my "peaks". Special thanks also to Konstantin Khrapko for his discussions of my PCRs and John Hanekamp for his kind assistance in obtaining tissue samples from Dr. Sam Singer. I would also like to especially acknowledge Rita DeMeo for her endless help and Beth-Ann Turnquist for always bailing me out of Bill Gates' computer traps. I am also indebted to Pablo Herrero for his expertise and extensive help in converting the population data to actual graphs.
To my friends in the Thilly lab, both past and present: Andrea, Aoy, Beth-Ann, Brindha, Cindy, Enda, Gengxi, Henny, Hilary, Jackie, Jia, Klaudyne, Luisa, Paul, Pablo, Paulo, Rita (Cha), Rita (DeMeo), Wei-Ming, Wendy, Wen and Xiao-Cheng, thank you for sharing the ups and downs of daily life and for providing unending patience and support. I would specially like to acknowledge my cell culture friends, Jackie and Aoy. Jackie, thanks for keeping me out of trouble, feeding me well and always keeping me on my toes. Aoy, thanks for all the encouragement, coo-fee breaks and always keeping me focused on the big picture. To the lunch time crew, Amba, Suki and Al, thanks for always providing me with stimulating discussions and lots of good food.
This thesis is dedicated to my parents and to Ted, who have always provided stability and a sense of perspective. My parents have always supported my pursuits of knowledge and encouraged me throughout. To Ted -thank you for standing by me and always believing in me.
This work was supported by a training grant from the National Institute of Environmental Health Sciences (NIEHS).
Do Women Who Die of Early Breast Cancer Experience a Burst of Mutations During the Growth of the Mammary Gland in Puberty?
by Paula Maria Lee
Submitted to the Division of Toxicology on May 30, 1996, in partial fulfillment of the
requirements for the degree of Master of Science
Abstract
This thesis outlines the theoretical basis of the hypothesis that women who die of early breast cancer experience a burst of mutations in any number of oncogenes or tumor suppressor genes during the development of the mammary gland in puberty. The basis of this hypothesis is derived from previous experiments in which the mammary epithelium of untreated sexually immature 50 day old female Fischer 344 rats contained clusters of c-H-ras codon 12 G->A mutants. The average size of these mutant clusters and their distribution within the glands indicated that they arose earlier in the pubertal development of the gland. We have examined the birth year cohort age-specific breast cancer mortality curves for both European American and African American females born in the years 1867, 1877, 1887, 1897, 1907, 1917, 1927 and 1937. We have postulated that the overall shape of the curve which may be separated into two distinct populations indicates a possible epidemiological basis of our hypothesis.
We have laid out the development of the mammary gland during each of its hormonal stages, i.e. puberty, pregnancy and menopause and have estimated within an order of magnitude the number of epithelial cells at risk during each of these stages. We have also modeled the epithelial cell kinetics during the development of the gland during
puberty and have outlined the possible scenarios for the appearance of spontaneous mutant cell clusters during this period.
Thesis Supervisor: William G. Thilly Title: Professor of Toxicology
TABLE OF CONTENTS
1 Introduction ... ... 13
1.1 The M utational Basis of Cancer... 13
1.2 Mammary Carcinogenesis... ... 14
1.2.1 Breast Cancer M ortality Data... 14
1.3 The Alternative Hypothesis of Rodent Mammary Carcinogenesis...20
1.4 Testing the Alternative Hypothesis...22
2 Hypothesis ... ... 25
2.1 H ypothesis... ... 27
2.2 The Human Mammary Gland... 27
2.2.1 General Structure of the Mammary Gland... .... 27
2.2.2 Pre-natal Development of the Human Mammary Gland...30
2.2.3 Development of the Mammary Gland During Puberty...31
2.2.4 The Mammary Gland During Pregnancy... 32
2.2.5 The Mammary Gland During Menopause... ... 33
2.3 The Hormonal Status of the Mammary Gland During Puberty...33
2.4 Estimated Number of Epithelial Cells at risk as a Function of Hormonal Status....35
2.5 Potential Relationship Between Breast Cancer Risk Factor and Tissue Kinetics...38
3 M aterials and M ethods... ... 52
3.1 Isolating Mammary Epithelial Cells From a Reduction Mammoplasty Sample...52
3.2 Histology of the Reduction Mammoplasty Sample... .... 56
3.3 Alternative Approaches for Separating Fibroblasts and M ammary Epithelial Cells... ... ... 58
3.4 Cell Culture for Obtaining Positive and Negative Controls...58
3.5 Genomic DNA Extraction... ... 59
3.5.1 Extraction Protocol... ... ... 59
3.5.2 Determining the Yield of DNA After Extraction... .... 60
3.5.3 Determining the Copy Number Using an Internal Standard...61
3.6 Mismatch Amplification Mutation Assay (MAMA)... ... 62
3.6.1 The General Method...62
3.6.2 Sequence and Design of Mismatch Primers... .... 64
3.7 Optimizing the System -The Story of the Positive Controls...65
Appendix ... ... 67
A 1.1 History of Rodent Mammary Neoplasia...67
A 1.2 Tim ing of Initiation... ... 68
A 1.3 Background of N M U ... ... 70
A1.4 Mutational Specificity of NMU in Bacterial and Mammalian Cells...71
A1.5 Further Evidence for the Mutational Specificity of NMU from Rodent Models...73
A1.6 Formation of 06-methylguanine in DNA and its repair by 06-methylguanine methyltransferase (MGMT)...74
LIST OF FIGURES
Figure 1 Birth year cohort age specific breast cancer mortality curve for European American Females (1867-1937)
Figure 2 Birth year cohort age specific breast cancer mortality curve for non-European American Females (1867-1937)
Figure 3 Birth year cohort age specific Hodgkin's lymphoma mortality curve for European American Females (1867-1937)
Figure 4 Birth year cohort age specific Hodgkin's lymphoma mortality curve for European American Males (1867-1937)
Figure 5 Birth year cohort age specific testicular cancer mortality curve for European American Males (1867-1937)
Figure 6 Theoretical shape of mortality curves based upon pubertal burst hypothesis
Figure 7 Composite theoretical curve for both pubertal burst and non-pubertal burst populations
Figure 8 Ultrastructure of the resting human mammary gland
Figure 9 Concentration of estradiol and progesterone in 7-18 year old girls
Figure 10 Graph depicting exponential growth of epithelial cells in human mammary gland in puberty
Figure 11 Expected distribution of # of mutant colonies vs. #mutants/colony Figure 12 Theoretical distribution of mutant colonies (p>>r)
Figure 14 Culture of collagenase-treated reduction mammoplasty sample homogenate after two serial passes of differential attachment to petri plates
Figure 15 Histology of reduction mammoplasty sample (H&E stain)
Figure 16 Schematic of H-ras codon 12 G->A MAMA assay primers and product lengths
Figure 17 Schematic of p53 codon 157 G->T MAMA assay primers and product lengths
LIST OF TABLES
Table 1 Distribution of H-ras mutants cells in sectored mammary tissue of 50 day old untreated Fischer 344 rats (Cha et al., 1994)
Table 2 Number of epithelial cells per cross-section of alveolar bud/ductule/acinus, # of alveolar buds/ductules/acini per lobule and cross-sectional area per lobule (mm2)
Table 3 Values of parameters obtained necessary for the order of magnitude estimate of the number of epithelial cells at risk in the breast
Table 4 Values of k and doubling times for various values of No holding Nfinal constant
Table 5 Values of k and doubling times for various values of Nfinal holding No constant
Table 6 Probability of not observing a single mutant as a function of the number of epithelial cells in the developing gland
Table 7 Expected size of mutant cluster and probability of observing a cluster of such a size in a cross-section of women as a function of the number of cells
LIST OF ABBREVIATIONS
ACF Aberrant crypt foci
APC Adenomatous polyposis coli
BCNU 1,3-bis(2-chloroethyl)- 1-nitrosourea BSA Bovine serum albumin
CDCE Constant denaturing capillary electrophoresis
C(NU Chloroethy1nitrosourea
D MB A )Dimethylbenz(a)anthracene dNTP deoxynucleotide triphosphate EBV Epstein-barr virus
ENU N-ethyl-N-nitrosourea
FACS Fluorescence activated cell sorting FBS Fetal bovine serum
FFTB First full term birth FFTP First full term pregnancy FTB Full term birth
F TP Full term pregnancy
gDNA Genomic DNA
H&E Hematoxylin and eosin
MAMA Mismatch amplification mutation assay MEGM Mammary epithelium growth medium M GM T 06-methylguanine methyltransferase
MNNG N-methyl-N'-nitro-N-nitrosoguanidine
mRNA messenger RNA
NMU N-nitroso-methylurea PAGE Polyacrylamide gel SDS Sodium dodecyl sulfate TID Tenninal interlobular ducts
1. INTRODUCTION
1.1 The Mutational Basis of Cancer
The field of genetic toxicology has had at its foundation the premise that humans are exposed to exogenous chemicals which induce mutations in cellular genes, which subsequently lead to the development of cancer in a susceptible organ. Somatic mutations have been found in at least two classes of genes (proto-oncogenes and tumor suppressor genes) in both human and experimental animal tumors. The spectrum of mutations found in these tumors range from chromosomal rearrangements such as translocations or gene amplification to large scales insertions or deletions to point mutations. For example, the activation of the K-ras oncogene and the inactivation of at least 3 tumor suppressor genes, including the adenomatous polyposis coli (APC) gene have been found to occur in human colon tumors (Fearon et al., 1990). The normal cellular counterparts of oncogenes, termed "proto-oncogenes" function in controlling cell growth and differentiation, while normal tumor suppressor genes act as negative regulators of cell division.
Molecular characterization of spontaneous and chemical induced tumors generated in several rodent model systems revealed the presence of activated ras oncogenes, which were first discovered in avian and murine oncoviruses. Activated ras oncogenes have also been found in quite high percentages in colon carcinomas, pancreatic carcinomas, lung adenocarcinomas, cholangiocarcinomas, certain types of thyroid tumors, endometrial
adenocarcinomas, mucinous carcinomas of the ovary, squamous cell carcinomas and to a much lesser extent in several other types of human tumors (Anderson et al., 1992). It was difficult to define the precise role of oncogene activation in the initiation and development of human cancers. The availability of animal model systems, in particular, rodent model systems, in which oncogenes could be reproducibly activated by chemical treatment made the goal of defining the role of the oncogenes in the multistep process of carcinogenesis more realistic. The reproducible activation of the ras oncogene in chemical induced rodent tumors made it possible to correlate the activating mutations with the pre-mutagenic adducts which were supposedly formed directly by the carcinogen. In particular, rodent mammary models proved useful for studying the mechanisms of human mammary carcinogenesis.
1.2 Mammary Carcinogenesis
1.2. 1Breast CancerMortality Data
The current estimate of every 1 in 8 American women developing breast cancer during the course of a lifetime has caused an increase in research activity in this field. We have obtained the breast cancer mortality data (Vital Statistics of the United States) and have separated it according to birth years and plotted it accordingly. The composite birth year cohort age-specific mortality breast cancer curves for European American females and non-European American females born in the years 1867, 1877, 1887, 1897, 1907, 1917,
Breast Cancer (European
250 200 150 100 20 40 60 80 100Age
120Figure 1 - Birth year cohort age-specific breast cancer mortality curve for European American Females
Breast Cancer
(Non-European American Females)
P(t)
P(t)
200 -150 100 50 0Figure 2 - Birth year cohort age-specific breast cancer mortality curve for Non-European American Females 60 80 100 120
Age
-5.- 1867 1877 -"4- 1887 -1897 ---- 1907 --+-- 1917 --- 1927 ---- 1937 20 40 ~ ii: - I I .... 250 -- -- -~ --~ --I-Examination and analysis of the mortality curves reveals a reproducibly distinct inflection in the curves around the ages of 55-65. There is a peak in the curve somewhere around age 55, followed by a relatively flat 5 year period. After this point, the curves begin to rise again in an approximately linear fashion. This inflection suggests to us that there might be two separate populations of women who die of breast cancer. We may separate the overall curve into two separate populations by more or less symmetrically extrapolating the first part of the curve to yield "Population 1". The second population curve may be obtained by subtracting the extrapolated values from "Population 1" from the overall values of the combined curve. We may then postulate that the breast cancers in both populations occur by distinct mechanisms, the kinetics of which may be considered separately. It must however be noted that if the rates of dying of breast cancer for the women in "Population 2" begin to increase, it is possible that we may no longer observe the inflection in the overall mortality curve. It is interesting to note that at values of "t"
corresponding to "Population 1", the slope of the curve of "P(t)" vs "t" does not increase with birth year. In contrast, the slope of the curve of "P(t)" vs ""t" increases with advancing birth year for "Population 2".
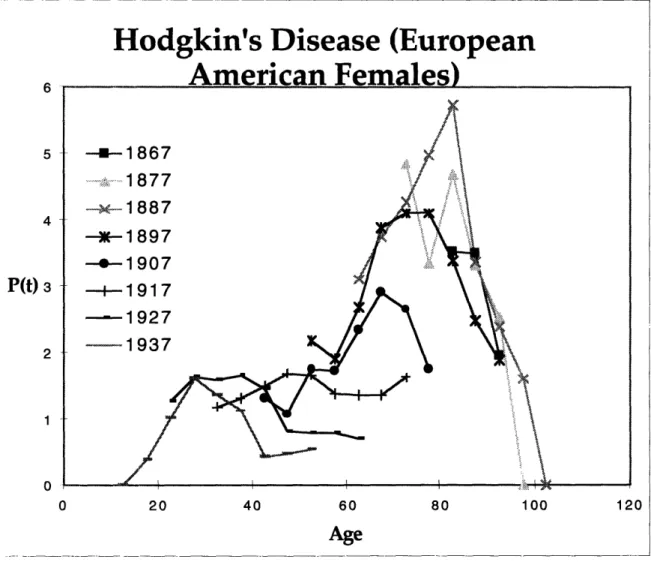
Two clearly distinct populations are also observed in the birth year cohort age-specific mortality curves for testicular cancer and Hodgkin's lymphoma. Figures 3, 4 and
5 depict the birth year cohort age-specific mortality curves for European American Female Hodgkin's lymphoma, European American Male Hodgkin's lymphoma and European American Male Testicular cancer respectively. Examination of Figures 3 and 4 show that the first population begins dying off around age 15, peaks at age 35 and then falls. The second population then begins to rise around age 50. In the case of testicular cancer, an examination of Figure 5 reveals a first population reminiscent of that in Hodgkin's lymphoma. Similarly, the curve of the first population begins to rise around age 15, peaks
between ages 30 to 35 and then begins to fall. The second population in testicular cancer however begins to rise around ages 60 to 65, in contrast to age 50 in Hodgkin's lymphoma.
Hodgkin's Disease (European
6 5 4 P(t) 3 2 1 0 0 20 40 60 80 100 120
Age
Figure 3 -Birth year cohort age-specific Hodgkin's lymphoma mortality curve for European American females
H
9 8 7 6 5P(t)
odgkin's Disease (European
20 40 60 80 100
Age
120
Figure 4 - Birth year cohort age-specific Hodgkin's lymphoma mortality curve for European American males
Testicular Cancer (European
20 40 60 80 100 120
Age
Figure 5 - Birth year cohort age-specific testicular cancer mortality American males
curve for European
1.3 The Alternative Hypothesis of Rodent Mammary Carcinogenesis
The reproducible induction of mammary carcinomas after treating sexually immature female rats with the methylating agent, N-nitroso-methylurea (NMU) provided a useful model for the study of human mammary carcinogenesis. Specific G->A mutations were consistently found in codon 12 of the c-H-ras gene in these tumors. The collective hypothesis that arose from these experiments (see Appendix for detailed descriptions) is that chemical carcinogens act as initiators in the multi-stage theory of carcinogenesis by
P(t)
directly inducing the oncogenic mutations which are later found in tumors. It was presumed that as tumors are monoclonal, the nature of the predominant genetic changes in the tumors is indicative of both the timing of the event and the chemical responsible for the changes.
For many years, the idea that NMU induced the specific mutation in the mammary epithelial cells which later underwent clonal expansion and developed into mammary tumors dominated the field of oncogenesis. However, there is an alternative hypothesis which was never seriously investigated. It is quite possible that the chemicals are not directly inducing the mutations which are observed in the resulting tumors, but are simply selecting the pre-existing mutant cells. It may be that the mutations arose prior to treatment with the chemical, perhaps during the window of time between the onset of puberty and treatment with the chemical. In the case of rats, treatment with the chemicals usually takes place at about 50-55 days of age and the onset of puberty occurs around 35 days of age (Dr. Rita Cha, Ph.D. Thesis, MIT 1992). Therefore, there is a window of approximately 15-20 days in which the mammary gland is undergoing development via branching of the ducts and proliferation of the mammary epithelial cells lining the ducts. In this stage of rapid cell proliferation, it is possible that spontaneous mutations, in this case in the c-H-ras gene may occur. Treatment with NMU may have some independent effect on the c-H-ras mutant cells, possible selecting them and promoting their proliferation into mammary tumors.
Despite the fact that the resulting mammary tumors may contain predominantly codon 12 mutations in the c-H-ras gene, this may not mean that these are the predominant mutations induced by NMU, (assuming that NMU induced the mutations). A tumor is a clonal population which was selected in vivo and for this reason, we may not assume that the predominant mutation is the one induced by the chemical. The only information that
may be garnered is that the cells with the predominant mutation have a selective growth advantage and that these mutant cells were present earlier in the development of the mammary tumor. It is possible that the chemical induces other mutations which do not have a selective growth advantage and may not be detected because the mutant frequency
is below the level of detection of the specific assay.
1.4 Testing the Alternative Hypothesis
Cha et al., (1994) were the first to directly test this alternative hypothesis, by trying to prove that the oncogenic mutations which are detected in chemical-induced rodent tumors are directly induced by the chemical carcinogens themselves. They set out to determine if a carcinogenic dose (30 mg/kg) of NMU administered to female Fischer 344 rats induced mutations in the the c-H-ras oncogene of mammary epithelial cells or if the mutations were pre-existing.
Using the mismatch amplification mutation assay (MAMA) which was key to the testing of the hypothesis and had a demonstrated sensitivity of 10- 5 (Cha et al., 1992), they determined that the G->A transition mutation at codon 12 of the c-H-ras gene existed in the mammary epithelium of these rats prior to treatment with NMU (Cha et al., 1994). They hypothesized that NMU acted in a manner independent of inducing the codon 12 mutations and was perhaps selecting for the mammary epithelial cells bearing the mutations, inducing them to expand and develop into a mammary tumor. The evidence for this conclusion is based on the fact that (i) 70% of untreated animals contained detectable levels of c-H-ras mutants (an average of about 128 mutants per animal), (ii) the mutants were clustered as sectors within the mammary gland and (iii) that treatment with the carcinogenic dose of NMU did not result in a significant increase in the number of mutants, the fraction of organ sectors with mutant cells or the fraction of animals containing
detectable levels of c-H-ras mutants. Table 1 shows the distribution of c-H-ras mutant cells in sectored mammary tissue of 50 day old untreated Fischer 344 rats (taken from Cha et al., 1994). By determining the average number of c-H-ras mutants per sector and their distribution in the rat mammary gland, Dr. Cha and her colleagues were able to conclude that there was a "burst" of mutations and to pinpoint the "timing" of the burst close to the first estrus'. The clustering of the c-H-ras mutants as sectors in the gland is consistent with their origin as descendants of single cells which mutated early in the development of the gland. Otherwise, if the mutants arose independently or at a time closer to the attainment of maximum cell number of the organ, they would be randomly and evenly distributed throughout the organ. This is based on the logic that the induced mutants would not have had sufficient time/doublings to clonally expand and develop into colonies. It must be remembered however, that the limit of sensitivity of the MAMA assay does not allow us to distinguish between truly independent mutants and colonies which have not yet attained sufficient mutant cells (mutant fraction required >= 10-5), which would
allow them to be scored as positive sectors.
tDr. Cha determined the timing of the burst using the following method (Dr. R. Cha, doctoral thesis, 1992).
Sectors that she analyzed from 50 day old rats contained on average 128 (27) mutant colonies. Assuming that each sector arose from a single cell, she determined that the single mutation in these sectors arose 8 cell divisions prior to the time of observation. Using the observation that the cell division cycle in young virgin rats varies between 10 and 28 hours (Russo and Russo, 1988), she was able to calculate that the early event occurred around 40 days of age.
Tablel. Distribution of H-ras mutant cells in sectored mammary tissue of 50 day old untreated Fischer 344 rats (from Cha et al., 1994)
ANIMAL SECTOR MUTANT/SECTOR MUTANT
FRACTION 50-1 D 150 2.1x10⁻⁵ 50-2 E 100 1.4x10- 5 50-4 A 110 1.6x10- 5 D 50 0.7x10- 5 E 80 1.2x10⁻⁵ 50-5 B 200 2.8x10⁻⁵ C 150 2.1x10- 5 50-6 C 120 1.7x10⁻⁵ Average # of mutants 322
2. 1 Hypothesis
The results of Cha et al. (1994) have altered our perspective on the mechanism of rat mammary carcinogenesis. The mutations which are found in the rat mammary tumors, if indeed spontaneous in origin, will force us to consider the contributions to the overall role of carcinogenesis of endogenous agents in human mammary carcinogenesis. Their observations prompted us to think that perhaps a similar phenomenon (a burst of spontaneous mutations during puberty) might be occurring in humans. We then decided to determine if there was any theoretical evidence that would support our notion of a pubertal burst occurring during the growth of the mammary gland in puberty. Using the shape of mortality curves for a number of different cancers as a reference, we may predict the shapes of the breast cancer mortality curves, if indeed a pubertal burst did occur. As shown in Figure 6, there would be an early population which would begin dying off beginning somewhere around age 25. The curve would then peak and begin to fall until age 40-45. The predominant pattern which is found in tumors in which there is no expected pubertal burst would be an approximately linear increase in the curve beginning around age 55-60, which is also shown in Figure 6. The composite of both of these curves is shown in Figure 7, and is remarkably reminiscent of the breast cancer mortality curves (birth year cohort specific data for the years 1867-1937) shown in Figures 1 and 2.
HYPOTHESIS
The basis of this thesis was to determine if women who die of early breast cancer experience a burst of mutations during the growth of the mammary gland during puberty in any number of oncogenes or tumor suppressor genes.
c4 -0 0 s-I ny tumors hilrct Age (years)
Figure 6 -Theoretical shape of mortality curves based upon pubertal burst hypothesis
C4 -4-4
0
I-Age (years)
Figure7 -Composite theoretical curve of both pubertal burst and non-pubertal burst
2.2 The Human Mammary Gland
2.2.1 General Structure of Mammary Gland
The structure of the mammary gland varies with the hormonal status of the individual. The human mammary gland may be divided into three structural compartments:
* the glandular tissue, i.e. epithelial cells of the compound tubulo-alveolar type, which is further divided into lobes
* connective tissue which surrounds the glandular tissue and separates lobes from each other
* interlobular adipose tissue.
The glandular component is composed of a tree-like network of branching ducts and terminal secretory lobules, which becomes increasingly ramified as it extends away from the nipple in both the radial and longitudinal directions. The gland consists of 15-25 lobes, each of which converges to a lactiferous duct which then opens up into the lactiferous sinus at the apex of the nipple. The lactiferous ducts lead into the terminal interlobular ducts (TID), each of which further divides into several intralobular ducts. Gray's Anatomy (38th edition) cautions that even though the lobes of the mammary gland are depicted as discrete anatomical regions in the gland, they typically grow into each other at the edges and do not look like discrete structural entities during surgery. Lobules are the terminal secretory portion of the branching structure and their structures are dependent on the hormonal status of the gland. In the mature breast (specialized for milk production and secretion), each lobule consists of several blind ending extensions, termed as alveolar buds, ductules or alveoli (acini) depending on their stage of development. Each of these branches converge and form an alveolar duct through which the milk is secreted.
The connective tissue stroma of the mammary gland loosely encapsulates and surrounds the lobules, thus accomodating easy, rapid expansion of the glandular portion of the organ both during puberty and pregnancy. Adipose tissue occurs between the lobules in a lobe and the quantity is also dependent both on the individual and the hormonal status of the individual.
The ducts are lined by columnar epithelium for most of their length. Larger ducts are typically lined by two layers of cells, while the smaller ones are lined by a single layer of epithelium (luminal epithelium). The bases of the luminal epithelial cells are in close contact with numerous myoepithelial (basal) cells which invaginate their bases and form a separate layer surrounding the ducts and alveoli. The lactiferous ducts are lined with stratified cuboidal epithelium and close to their openings at the apex of the nipple, the stratified cuboidal epithelium is replaced by keratinized stratified squamous epithelium. Figure 8 depicts the ultrastructure of the resting mammary gland (Krstic, 1991).
Lobe
(•J
2 cm
L
B
Figure 8 -Ultrastructure of the resting human mammary gland (Krstic, 1991)
LD
®
Aý-. 14 Zý
Z/Am
2.2.2Pre-Natal Development of the Human Mammary Gland
The first evidence of the mammary gland appears as the milk streak during the 4th week of gestation, when the fetus is approximately 2.5 mm long. The milk streak then becomes the mammary ridge or the milk line during the 5th week. According to the qualitative ultrastructural observations of Dabelow (1957) described by Russo and Russo, the process of gland development in the fetus may be characterized into 9 different stages. The first stage is the thickening of the mammary ridge stage which is termed the "milk hill" stage in the 6th week, followed by the "mammary disc" stage when parenchymal cells start to invade the underlying stroma. The "mammary disc" stage then progresses to the globular stage between the 7th and 8th week. Subsequent to this is the cone stage which occurs at the 9th week and is characterized by further inward growth of the mammary parenchyma. Epithelial buds sprout from the invading parenchyma and these buds become lobular in shape between the 12th and 13th week, with notching at the epithelial-stromal border, otherwise known as "indentation". The next stage is called the "branching" stage and is marked by the appearance of 15-25 epithelial strips or solid cords in the 15 week old fetus. The canalization stage occurs next between 20 and 32 weeks of gestation and the solid cords become "canalized" by desquamation and lysis of the central epithelial cells. The final stage is the end-vesicle stage in which the end vesicles contain colostrum and have a monolayer of epithelial cells. Lobules have thus far never been observed in the fetal mammary gland. Their formation has been associated only with the onset of puberty. The male and female mammary glands are structurally similar at birth, with the exception that the male mammary gland never undergoes hormone-mediated development.
2.2.3 Development of the Human Mammary Gland During Puberty
Development of the mammary gland is initiated during puberty and varies from woman to woman. Mammary gland development may be characterized by determining the mammary gland area, volume, degree of branching of the ductal network, the degree of structures, such as lobules whose appearance shows the level of differentiation of the gland, or a combination of each of these variables. At the onset of puberty, somewhere between ages 11 and 13, an increase in the secretion of estrogen and progesterone (see Figure 9 for details on the age correlated systemic levels of the hormones) drives the proliferation and branching of the ductal network and an accompanying increase in the density of the surrounding stroma, characterized by an increase in deposition of collagenous connective tissue and adipose tissue. This accounts primarily for the increase in size of the mammary gland during puberty. The ducts grow and divide in both a dichotomous (repeated bifurcation) manner and a sympodial manner (formation of an apparent main axis form successive secondary axes) on a dichotomous basis. The ducts lengthen, divide and form club-shaped terminal end buds, which later become small ductules or alveolar buds. The alveolar buds then become acini or alveoli. The ductules/alveolar buds are morphologically more developed than the terminal end buds but less developed than the acini (alveoli). According to Russo and Russo, the alveolar buds cluster around a terminal duct forming a type 1 lobule. These terminal ducts or alveolar buds are lined by two layers of epithelial cells, whereas the terminal end buds are lined by up to four layers of epithelium. The acini are the secretory unit of the mammary gland. Lobule formation occurs within 1-2 years after the first menarche.
2.2.4 The Mammary Gland During Pregnancy
The breast achieves its maximal state of development during pregnancy. There are two distinct stages; the first is characterized by the proliferation of the distal portions of the ductal network (otherwise referred to as lobule formation), resulting in the transformation of ductules or alveolar buds to acini (alveoli). Rapid proliferation and morphological development of the functional secretory units occurs during the first three months of pregnancy. The epithelial cells in the acini of the newly formed lobules increase greatly in number as they are actively undergoing cell division and they also increase in size due to cytoplasmic enlargement. It was not possible to garner any information in the literature about whether there is a distinct "stem cell" population which is responsible for most of the cell division and increase in epithelial cell population or if all the cells in the ductal network are capable of undergoing cell division. I would postulate that it would be more efficient for the gland to have a reserved "stem cell" population which would remain at the distal portions of the ductal network. As the network grows radially and orthogonally away from the apex of the nipple, the cells in the distal portion of the ducts would automatically give rise to the components of the new lobules. We must also note that as the glandular portion of the breast increases, the stromal component actually decreases to accomodate the expanding glandular compartment.
During the middle of pregnancy, the lobules are further enlarged and increased in number. The lobules at this stage still contain a combination of terminal ducts and acini. Certainly, by the end of the first half of pregnancy, the groundwork for the structure of the expanded ductal network is already established. The second half of pregnancy is characterized mostly by differentiation into the milk secreting acini, which are the fully differentiated structures. These acini are not susceptible to neoplastic transformation and hence would theoretically reduce the number of cells at risk. This structure is maintained
throughout lactation. However, the post-lactational stages of the mammary gland are marked by a regression of the alveolar/ductal system, an increase in apoptosis of the epithelial cell population and a decrease in their cell size.
2.2.5 The Mammary Gland During Menopause
The decrease in the secretion of ovarian hormones, beginning around age 45 causes a regression in the glandular structure of the mammary gland. The main ducts and their branches remain, while there is shrinkage and collapse of the lobules. There is an increase in the fat and connective tissue content of the gland.
2.3 The Hormonal Status of the Pre-Pubertal and Pubertal Mammary Gland
Female puberty is characterized by a number of endocrine changes. Some of these changes are actually initiated several years before the first menarche (average age of 12 [Gray's Anatomy, 38th Edition]). The hormonal status of the pre-pubertal and the pubertal mammary gland is an important factor in our hypothesis. The link between the physiology and the endocrinology of the gland during the different stages of its development and the molecular changes underlying the hypothesized mutational burst is unknown. Such vital information is unfortunately unavailable in the existing literature. Vihko and Apter gathered data on some 200 health girls aged 7 -18 years and were able to come up with average systemic concentrations of several hormones, including estradiol and progesterone. We focused on the concentrations of estraogen/estradiol and progesterone as these are the strategic hormones driving the maturation and development of the mammary gland during puberty. Figure 9 represent the graphs of the concentrations of estradiol and
progesterone respectively which have been adapted from the data presented by Vihko and Apter.
Examination of Figure 9 shows that the concentration of estradiol increases two fold between the ages of 7 and 9 (0.025 nM -0.05 nM). Over the course of the following four years (ages 9-13), the concentration of estradiol increases five fold, leveling off at 0.2375 nM for about two years until age 15. An additional slight increase occurs again from age 15 until age 17 and finally flattens at 0.275 nM. The overall concentration of estradiol increases 11 fold in the period of approximately 11 years. The concentration of progesterone also changes significantly throughout the pre-pubertal and pubertal years. The increase in concentration is however more gradual than that of estradiol and increases overall by approximately 2.3 fold (0.3 nM - 0.7 nM) over the span of 11 years. The progesterone concentration increases 1.3 fold during the first 4 years (ages 7-11), 1.25 fold between 11 and 12, holding steady until age 14 and finally increasing 1.4 fold between ages 14 and 18. Data on the post-pubertal concentrations of these key enzymes have not been found in the literature.
Concentration of estradiol and progesterone in 7-18 year old females
0 o 0D 0 'U 'U U 'U 0o 0-- [Estradiol](nmole/L) -- [Progesterone](nmole/L) 5 10 15 Age
Figure 9 -Concentration of Estradiol and progesterone in 7-18 year old females
2.4 Estimated Number of cells as a Function of the Hormonal Status
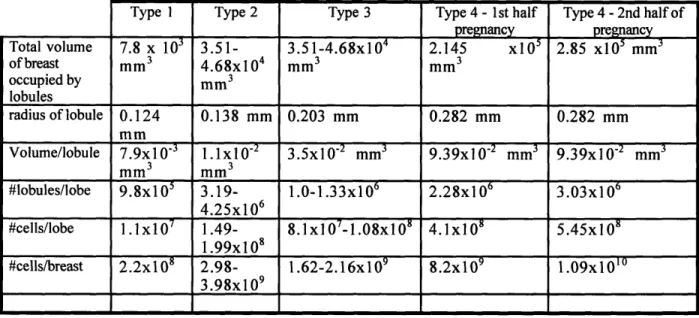
In an effort to obtain an order of magnitude estimate of the number of epithelial cells at risk of transformation in the human mammary gland as a function of the hormonal status of the gland, we have gathered data from several sources and made several assumptions. Russo and Russo determined the level of differentiation of lobules in the breast tissue of 22 adult women, ranging in age from puberty to 63 years of age who were undergoing reduction mammoplasties. Morphologically, lobules can be characterized as type 1, type 2, type 3 and type 4. They found that lobules of type 1 were found mainly in pubertal and young nulliparous pubertal women, while type 2 and type 3 lobules were found in parous, non-pregnant women and type 4 lobules were found primarily in
pregnant women. They have also measured parameters such as the number of cells per alveolar bud/ductule/acinus depending on the lobule type and the number of alveolar buds/acini/ductules per lobule. A summary of this data is shown in Table 2. The hierarchy of structures in the mammary gland is as follows: epithelial cell ->
ductule/alveolar bud/acinus ->lobule -> lobe. Since the hormonal status of the gland has been determined as a function of the type of lobules found in breast tissue, we are assuming that the parameters for the different lobule types may be used to represent the different hormonal stages in the mammary gland. Therefore, parameters for lobules type 1 may be used to estimate the number of cells at risk for young post-pubertal women, lobules type 2 and 3 for parous post-pubertal non-pregnant and nulliparous young women and lobules type 4 for pregnant women.
Number /lobule3 # cells/cross-section4 Cross-sectional area/lobule (mm2) Lobule Type 1 11.20 32.43 0.048 Lobule Type 2 47.0 13.14 0.060 Lobule Type 3 81.0 11.0 0.129 Lobule Type 4 180.0 10.0 0.250
.Table 2 Number of epithelial cells per cross section of alveolar bud/ductule/acinus, number of alveolar buds/ductules/acini per lobule and cross-sectional area per lobule (mm2)
" # of alveolar buds/ductules or acini per lobule
The number of epithelial cells at risk in each lobe may be determined by multiplying the number of cells per cross-section of either alveolar bud/ductule/acinus by the number of lobules in each lobe. We may then obtain the number of epithelial cells per breast as we know that there are between 15-25 lobes per breast depending on the individual. For the purposes of our calculations, we have chosen to use an average of 20 lobes per breast. Since a measurement of the number of lobules per lobe is not available, we have estimated the value of this parameter for lobules types 1 through 4 using the following assumptions. We know that the mass of each breast in post-pubertal women is between 150-200 g and increases to about 500 g during pregnancy (Gray's Anatomy, 38th edition). Based on this, we have estimated the mass of each breast in late puberty females to be about 100 g. Therefore, using the density of body fat (0.78 mg/mm3) and the relative parenchyma-stroma ratio measurements made using whole mount studies of 14 human breasts of pubertal, post-pubertal and pregnant women by Russo and Russo, we are able to determine the total volume of the mammary gland occupied by the lobules. Russo and Russo have found that 10% of the mammary gland in late pubertal females is composed of parenchyma, and this value increases to 30% in post-pubertal and young nulliparous women. During pregnancy, this ratio changes significantly and during the first half of pregnancy, 55% of the gland is composed of parenchyma while it increases to 73% during the second half of pregnancy. The volume of each lobule may be estimated as we have the cross-sectional area of lobules types 1-4, and we are assuming that the lobule may be modeled as a sphere. Therefore, the number of lobules per lobe may be obtained by dividing the total volume of each breast occupied by lobules by the volume of each lobule. The number of cells per lobe may then be obtained by multiplying the number of lobules/lobe by the number of cells/lobule (Table 2). Multiplying this parameter by 20 (average number of lobes/breast) gives an estimate of the number of epithelial cells at risk in each breast. Table 3 shows the values of all the estimates of the parameters which have been obtained using the above assumptions. It must also be noted that the number of
epithelial cells at risk during the second half of pregnancy is overestimated as a large number of the epithelial cells in the first half of pregnancy have become fully differentiated milk producing acini and are no longer susceptible to neoplastic transformation.
Total volume of breast occupied by lobules radius of lobule Volume/lobule #1obules/lobe #cells/lobe #cells/breast Type 1 7.8 x 10' mm3 0.124 mm 7.9x1 03 mm3 9.8x10⁵ 1.1x10⁷ 2.2x10⁸ Type 2 3.51-4.68x104 mm 3 0.138 mm 1.1xl0-mm 3 3.19-4.25x10⁶ 1.49-1.99x10⁸ 2.98-3.98x10⁹ Type 3 3.51-4.68x104 mm3 0.203 mm 3.5x10⁻² mm3 1.0-1.33x10⁶ 8.1xl07 -1.08x10 8 1.62-2.16x10⁹ Type 4 - 1st half pregnancy 2.145 xl01 mm3 0.282 mm 9.39x102 mm3 2.28x1 06 4.1x10' 8.2x10⁹ Type 4 -2nd half of pregnancy 2.85 xl0 mm 0.282 mm 9.39x10- mm3 3.03x10⁶ 5.45x10⁸ 1.09x10ol
Table 3 -Values of parameters obtained necessary for the order of magnitude estimate of the number of epithelial cells at risk in the breast
2.5 Potential Relationship Between Breast Cancer Risk Factors and Tissue Kinetics
Early age at menarche (age 11 and before), late menopause (> 55 years of age), and age at first full term pregnancy (FFTP) have been identified as "risk factors" for the development of breast cancer [Moolgavkar et al., (1980), Pike et al., (1981), MacMahon et al., (1970), Trichopoulos et al., (1972)]. We can try to relate these risk factors with the events which are taking place at the cellular level as the organ proceeds through its
hormone-mediated stages of development. Pike et al., (1981) found that the relative risk for developing breast cancer in women aged 32 or younger is twice as high for those who experienced menarche at 11 versus those who experienced menarche at 13 or older. MacMahon et al., (1970) showed that nulliparous women in an age-controlled study had a relative risk that was twice the value for women who had a FFTP before the age of 20. If the FFTP was between the ages of 20 to 24, 25 to 29 or 30-35, the relative risk increased by 20%, 56% and 88% respectively. It appears that the key factor is the age at FFTP as the relative risk does not decrease significantly with subsequent full term births (FTB), controlling for age at FFTB. Trichopoulos et al., (1972) have also estimated that women whose natural menopause occurred before age 45 had about half the breast cancer risk as the women whose natural menopause occurred after age 55. Based on our hypothesis, these kinetics probably affect "Population 2".
For the sake of speculating on the possible tissue kinetics which might be underlying the epidemiological observations, we shall think of the mammary gland as a homogeneous population of cells which are susceptible to transformation. As mentioned previously, the cells in the mammary gland which are susceptible to the development of carcinomas are the ductal epithelial cells. We are making the simple assumption that breast cancer risk is determined solely by the number of susceptible epithelial cells and topographic factors such as the positions of these epithelial cells in the architecture of the gland do not have any significant influence on the overall risk. We are also assuming that the two main determinants for decreasing the size of this population are death and differentiation.
The status of the population of epithelial cells can be characterized at each of the hormonally distinct stages in a woman's life - puberty, pregnancy and menopause. Epithelial cell proliferation is stimulated at the onset of puberty by increased levels of
estrogen. The mammary gland is continuously in a state of development and the epithelial cells undergo a limited amount of hormonally-induced proliferation during each menstrual cycle. During the first half of pregnancy, the maturation of the gland continues and there is much ductal branching and epithelial cell division. However, during the second half of pregnancy, much of the epithelial cell population undergoes differentiation and becomes specialized for the task of milk production. Regression in the levels of the hormones which maintain the breast epithelium at the onset of menopause causes the involution of the breast. The size of the population of susceptible cells is significantly reduced as a result of either an increase in the death rate of the cell population, an increase in the rate of differentiation or a decrease in the growth rate or a combination of all three factors (Moolgavkar et al., 1980).
An early age at menarche induces early proliferation of the breast epithelium and consequently leads to an increase in the number of susceptible epithelial cells earlier in life. This increases the length of time for which they can acquire the rate limiting mutations in order to acquire the selective growth phenotype. Similarly, a late menopause also increases the length of time the epithelium is susceptible to incurring the rate limiting mutations. At the onset of menopause (45-55), one would expect a population of cells which have already acquired one of the two rate limiting mutations would exist. This would imply that the longer this population of cells stays around, the more likely it would be that they would acquire the second rate limiting mutation, thus setting the stages for the development of a clinically detectable tumor. The protective effect of a full term pregnancy probably arises from the fact that in the second half of pregnancy, the significant fraction of the cells which arose from a rapid rate of cell turnover during the first half of the pregnancy are removed by differentiation. This translates into a decrease in the value of N and hence, a decrease in the value of the slope. Moolgavkar et al., (1980) also caution us that a FTP not only decreases the population of cells which have not
acquired any of the rate limiting mutations, but it also decreases the population of cells which have acquired one of the two mutations. Phenotypically, these two populations should be identical and there should be no selection for one population over the other in the process of differentiation. Therefore, the earlier the FFTP occurs, the faster the number of susceptible cells is decreased and the smaller the population of cells available for acquiring the rate limiting mutations. This smaller number of cells effectively decreases the probability of mutation induction (assuming that N is decreased by at least one order of magnitude).
2.6 Modeling the Cell Kinetics During Development of the Mammary Gland
The kinetics of epithelial cell growth in the developing human breast is crucial to the prediction of the expected number of mutant clusters and the average size of the clusters. Let us consider a developing mammary gland and assume continuous growth in time. We assume that the human mammary gland begins with 105 epithelial cells at the onset of puberty at age 11, and most of the cell growth is complete by age 16, at which time the mature breast contains approximately 7.5x10⁸ cells5. Therefore, the mammary gland undergoes a 104 fold expansion in the space of about 5 years.
During the critical growth phase, the mammary gland will exhibit growth such that the rate of growth of cells is proportional to the number of cells in the organ. In other words, the growth of the gland is exponential and may be described by equation 2 and Figure 11. In equation 2, k is the proportionality constant and describes the net growth of
s 4 g of reduction mammoplasty tissue yields 1.5x10⁷ epithelial cells on collagenase digestion (PML). The average mass of the mammary gland in a non-pregnant post-pubertal female is about 150-200g (Gray's Anatomy, 38th edition). Therefore, the estimated number of epithelial cells in an adult non-pregnant gland is about 7.5xl 08, which is about 40% lower than the theoretical estimate derived in Table 3.
epithelial cells during a fixed time interval and has units of inverse time (time-l). Separation of the variables in the linear ordinary differential equation expressed in equation 1 yields equation 2, which is the explicit solution.
aNSkN (1) at ekt (
N = Noekt (2)
Number of cells (N Nfina 11 16 Time (years)Figure 11 -Graph depicting exponential growth of epithelial cells in human mammary gland during puberty
Based on Equation 1, we may obtain values for k by making an exponential fit to the two data points. We may vary
(1) No in the range of 103-106 holding Nfinal constant at 2x10⁹ or (2) Nfinal in the range of 108-1011 holding No constant at 105 or (3) vary both No and Nfinal.
After obtaining a reasonable value for k, we may then use equation 2 to obtain an estimate of the doubling time of the epithelial cells. Tables 3 and 4 show the various values of k and doubling times (t2) for different combinations of No and Nfinal.
Table 4 - Values of k and doubling times (t2) for various values of No holding Nfinal constant
No Nfinal
Ik/cell.yr
Doubling time (t2)103 2x10⁹ 2.9 0.24 yr = 88 days
104 2x10⁹ 2.44 0.28 yr = 102 days
105 2x10⁹ 1.98 0.35 yr = 128 days
106 2x10⁹ 1.52 0.46 yr = 168 days
Table 5 - values of k and doubling times (t2) for various values of Nfinal holding No constant
105 108 1.38 0.50 yr = 183 days
105 109 1.84 0.38 yr = 139 days
105 1010 2.30 0.30 yr = 110 days
105 1011 2.76 0.25 yr = 91 days
Returning to the central hypothesis, we are attempting to determine if there is a burst of mutations during the growth of a human breast during puberty. It has already been established by the work of Cha et al., 1994 that such a burst occurs in the rat mammary gland in the c-H-ras oncogene, beginning around the first estrus. It is therefore necessary for us to determine if:
(i) a similar burst occurs in other gene sequences in the pubertal rat mammary gland (ii)a similar burst occurs in humans in the c-H-ras oncogene
(iii) a similar burst occurs in other gene sequences in the pubertal human mammary gland
In the event that the burst occurs, we must determine
(i) is the burst limited to a specific base change, for example G->A (ii) determine when it occurs and
(iii) determine the distribution of mutants and the average size of the clusters.
Let's consider the case in which the total number of epithelial cells is less than 107 cells, as is the case for the first net 7 doublings of the pubertal breast (105-107). In the case in which N = 105 cells, the expected number of mutant cells at the time of doubling of N would be 10-2, using a mutation rate of 10-7/cell.generation. Since we cannot speak of 0.01 or 0.1 mutants arising from a population of 105 or 106 cells at the time of doubling, this is not a good physical representation of the process as the generation of spontaneous mutants can be considered to be a binomial event, that is, a mutant is generated or it isn't. Therefore, when N<107 cells, we must think of the probability of finding a cluster of a specific size from a sample of women rather than thinking of the expected number of individual mutants which are generated at the time of doubling. Table 6 summarizes the expected size of a single mutant cluster and the probability of finding a cluster of a specific size in a sample of women, as a function of the number of epithelial cells in a growing mammary gland. We must also consider the fact that even at N> 107 cells, there is still a possibility of not observing any mutants, the probability of which can be determined using the Poisson distribution.6 Table 5 show the probabilities of not observing a single mutant
6 The Poisson distribution can be described by the equation
P(n)= Xne-l/n! where P(n) is the probability of observing n events and X is the expected number of events.
cell and the expected number of independent mutants generated function of the changing values of N in the developing gland. necessary to model the total expected number of mutants and distribution and average colony size.
at each doubling as a Therefore, it will be to the determine their
Table 6 - Probability of not observing a single mutant as a function of the number of epithelial cells in the developing gland (N)
Number of cells at risk (N) Expected number of P(observing no mutants) independent mutants 1.625x10⁵ (0.01625) 0.98 3.25x10⁵ (0.0325) 0.97 6.25x10⁵ (0.0625) 0.94 1.25x10⁶ (0.125) 0.88 2.5x10⁶ (0.25) 0.78 5x10⁶ (0.5) 0.61 107 1 0.37 2x10⁷ 2 0.14 4x10⁷ 4 1.8x10⁻² 8x10⁷ 8 3.35x10⁻⁴ 1.6x10⁸ 16 1.1x10⁻⁷ 3.2x10⁸ 32 1.2x10⁻¹⁴ 6.4x10⁸ 64 1.6x10⁻²⁸ 1.28x10⁹ 128 2.6x10-56 1/e X
Table 7 -Expected size of mutant cluster and probability of observing a cluster of such a
size in a cross-section of women as a function of the number of cells present in the breast at the time at which the mutation is obtained
Number of cells at 7Expected size of8 Mutant fraction Probability of risk (N) single mutant per sector if single observing cluster
cluster in mature cluster of appropriate size breast 1.625x10⁵ 214 = 16,384 4x10- 5 2/100 women 3.25x10⁵ 213 = 8,192 2x10- 5 3/100 women 6.25x10⁵ 212 = 4,096 1x10⁻⁵ 6/100 women 1.25x10⁶ 211 - 2,048 5.1x10- 6 1/10 women 2.5x10⁶ 210 = 1,024 2.55x10- 6 2-3/10 women 5x10⁶ 29 = 512 1.3x10- 6 5/10 women 107 28 = 256 6.5xl0- 7 (ND) every woman 2x10⁷ 27 = 128 3.3x10- 7 (ND) every woman 4x10⁷ 26 = 64 1.65x10- 7 (ND) every woman 8x10⁷ 25 = 32 8.3x10⁻⁸ (ND) every woman 1.6xl 08 24 = 16 4.2x10- 8 (ND) every woman 3.2x10⁸ 23 = 8 2.1x10- 8 (ND) every woman
7Assume that each single mutant generated at the time of doubling of the breast may give rise to a single mutant cluster or colony
8 This assumes that the mutant cells do not possess any proliferative advantage over normal cells and both
grow at the same rate.
Each sector will contain 4x 10⁸ epithelial cells (2x10⁹/5 sectors)
After the gland reaches 107 cells, it is expected that there will be more than 1 positive sector per breast (>107 cells) and more than one mutant cluster per sector (>5x 10⁷ cells). However, the mutant fraction will not be expected to increase significantly to the point at which the expected mutant fraction increases over -~6x10⁻⁷.
This work is based on the detection of mutants in the human pubertal breast. It is therefore imperative that we consider the different mechanisms forcing the generation of mutants in the whole mammary gland. In the growing breast, there are two sources of mutants. The first source is the spontaneous generation of mutants from normal cells which is driven by the parameter r, which is the spontaneous mutation rate in equation 3. The second source of mutants is the growth of mutant cells which were generated spontaneously during previous cell divisions, which will be referred to as preexisting mutants hereafter. The parameter p in equation 3 is similar to the parameter k for normal cells and describes the net growth rate for the mutant cells. Again, the effect of this component is exponential as in the case of normal cells, the rate of growth of the mutant cells is dependent on the number of existing mutant cells. For predictive purposes, we will assume that p = k. However, in reality, p may be different from k because the net turnover rates of mutant epithelial cells may be significantly different from that of normal cells. In addition, perhaps only a select fraction of the mutant cell population may actually be undergoing division.
If we attempt to model the total number of mutants as a function of the number of epithelial cells N in the developing mammary gland, we will arrive at an equation such that
AM = rNAt + pMAt (3)
6.4x10⁸ 22 = 4 1.05x10- 8 (ND) every woman
1.28x10⁹ 2 5.3x10- 9 (ND) every woman
where AM is the change in the number of mutants and At is the change in time. For an infinitely small At, equation 3 approaches the partial differential equation and becomes equation 4, where rN is the contribution from the spontaneous generation of mutants and pM is the contribution from the growth of pre-existing mutants. The premise is that every mutant cell which arises in the growth of an organ is capable of giving rise to an independent colony of mutant cells, driven by the component pM.
BMS= rN + pM
(4) at
When the linear differential equation expressed in equation 8 is solved using integrating factors, the following solutions are obtained. Equation 5 is the solution when p is different from k. When k > p, ekt -ePt > 0, k-p > 0, and M > 0 growing as ekt. When p < k, ekt - ept < 0, k-p < 0, and M > 0 growing as ePt. When p = k, the solution becomes equation 6 because in this case, equation 5 becomes an indeterminant (0/0). The ratio of p to k determines the total number of mutants such that when p > k, M/N grows exponentially, when p = k, M/N grows proportionally to time and when p < k, M/N decays exponentially. The ratio of p to r determines the size distribution of the clusters, such that when p >> r and p << r, the situations depicted in Figures 12 and 13 result. The solutions to Equation 4 will allow us to determine the actual value after the number of mutants is determined from the tissue samples.
M = PNo [ektePt] (5)
k-p
M = pNotekt (6)
The first specific condition which we will consider is the case where p << r, that is the effect of the spontaneous generation of mutants far outweighs the effect of the net
growth of pre-existing mutants. The effect of p would be to give rise to smaller colonies, while the effect of r would be the initiation of a large number of independent mutants. The net effect of this condition would be predicted to be a large number of colonies of smaller average size. The expected distribution in the mature breast is depicted in Figures 12 and 13.
The second condition which we will consider is the case where p >> r, that is the effect of the net growth of pre-existing mutants far outweighs the effect of the spontaneous generation of mutants. The lower value of r would implicate the initiation of a smaller number of mutant cells capable of giving rise to independent colonies. However, the value of p would mean that each of these single independent colonies would on average contain a greater number of mutant cells. The expected distribution in the mature breast is depicted in Figures 12 and 13. In the case in which p = r, an intermediate situation would be expected. Figure 11 is a plot of the expected number of colonies versus the expected number of mutants per colony for the cases p << r and p >> r. In any of the specific situations described, it is clear that mutants which arise soon before the mammary gland attains its final N will not have the chance to show themselves as a detectable mutant colony (see Table 6).
# of colonies
# mutants/colony
Figure 11- Expected distribution of number of mutant colonies versus the number of mutants per colony
p>>r
Driving component is the growth of pre-existing mutants Figure 12 Smaller number of mutant colonies of larger size p<<r Driving component is the spontaneous generation of mutants Figure 13 Larger number of mutant colonies of smaller size
In order to detect these mutant colonies, a minimum mutant fraction of 10- 6 - 10 - 5 is required. This means that in the mature breast of approximately 2x10⁹ epithelial cells which is divided into 5 equally sized sectors containing approximately 4x10⁸ cells, there must be at least 1 colony containing a minimum of 400 to 4000 mutant cells (see Table 6).
3. MATERIALS AND METHODS
3.1 Isolating Mammary Epithelial Cells from a Reduction Mammoplasty Sample
One of the major challenges of this work is to obtain a purified fraction of the epithelial cells lining the ducts. These are the cells which are at risk of getting mutations and giving rise to carcinomas. The approach which has been used is an adaptation of the method outlined by Freshney, (1992). The sterile 9surgical discard tissue which was obtained from reduction mammoplasties was first cut into sections of predetermined masses so that we may obtain sufficient numbers of epithelial cells for molecular analysis. The "whitish" areas of the tissue were excised from the remainder of the tissue, which according to Freshney, (1992) are the regions which contain the ducts. Each tissue section had an average mass of 106 g. The tissue was then minced using a razor blade and then placed into a 50 ml centrifuge tube containing approximately 30 ml of tissue processing media, 10 ml of 5X enzyme solution and 5 ml of fetal bovine serum (FBS). The tissue processing media contains Ham's F12 nutrient mixture supplemented with insulin (10 gg/ml), penicillin (100 U/ml), streptomycin (100 pg/ml), polymixin B (50 U/ml) and Fungizone (5 gLg/ml). The enzyme solution consists of collagenase type IV (1,500 U/ml) dissolved in an appropriate amount of tissue processing media, filtered sequentially through 0.8 gm, 0.45 gtm, and 0.20 gm Nalgene filters and hyaluronidase (100 U/ml) dissolved in an appropriate amount of tissue processing media and filtered through a 0.20
9 The tissue used in this work has been kindly provided by Dr. Samuel Singer of the Brigham and Women's
Hospital in Boston.
[0) A 4g mass of breast tissue obtained from a reduction mammoplasty (Dr. Sam Singer) yielded an average of
3x10⁷ cells (samples HBDRAI (PML) and HBDRIE (PML)). Assuming that this cell fraction contains about equal proportions of epithelial cells and fibroblasts, then there are 1.5x10⁷ epithelial cells in this sample. Assuming that on average 1 g of tissue contains about 108 cells, then 4 g of tissue should contain 4x10⁸ cells. Therefore in the 4 g sample, the epithelial cells constituted approximately 3.75% of the whole tissue sample.