THE DISABLED PEDESTRIAN: HUMAN FACTORS
by
CHARLES ARNOLD COFIELD bachelor of science
massachusetts institute of technology 1972
masters of architecture
massachusetts institute of technology 1973
submitted in partial fullfilment of the requirements for the degree of
MASTER OF CITY PLANNING
A
certified by
thepis spervisigr/x Y
accepted by
chairman, departmental
committee on graduate students
Archives
OCT 25 1974
L-JBRAMESTABLE OF CONTENTS
TEXT
PREFACE...00... ... 01
INTRODUCTION...000000000...
The Disabled Pedestrian... THE MODEL...0 ...
Models.000000000**00000000*
References... * ... .3 . . . ... 0 ... 00.4 ... 0 ... 0 ... 0DEFINING THE MARKET... Bibliography... ....16
.... 26
000.31 MOBILITY - ITS HUMAN COST EXAMINED...73
References...00...94
MOBILITY - ITS HUMAN COST EXPLAINED.... Pedestrian Issues...
Mapp
ing...
... Visual Communication... ... .*****98 .0000 00000000099 ... 100Physiological Characteristics Subjective Measures..109
(Section Aging Symptoms...110
The Older Disabled, Subjective, Physiological Measures...**...119
(Section Human Performance Measures...129
B.) Disabled Classifications...000...0132
Sensory
Modalities...
Human Motor Activities...137Ambulant Disabled...138
Non-Ambulatory
Disabled...0...164
Semi-Ambulant Disabled...176
Equipment Performance Measures...183
References.... ... **... 189
User Comparative Analysis...194
ENVIRONMENTAL ISSUES...*...203
Street Performance Specs...268
References...**
*....000000000. ... .*...226 APPENDIX...0.231 BIBLIOGRAPHY. ...00....263 I. II. III. IV. V. ... 00.38 ... 70 A.) VI.FIGURES, GRAPHS, TABLES, CHARTS...
Environmental Framework... Pedestrian Environment... Pedestrian Planning Process.. Pedestrian Trips Variables... Pedestrian Design Elements...
Mobility Impairing Diseases...
Prevalence of Paralysis...
Use of Mobility Aids...
Prevalence of Impairment by Chronic Conditions... Mobility Distribution by Age...
Mobility Distribution by Race... Mobility Distribution by Family Income... Mobility Distribution by Employment... Mobility Distribution by Geographic Area... Age by Geographic Distribution... Age Adjusted Disability by Chronic Mobility...
. ...
.40
... 41 ... 43 ... ..46
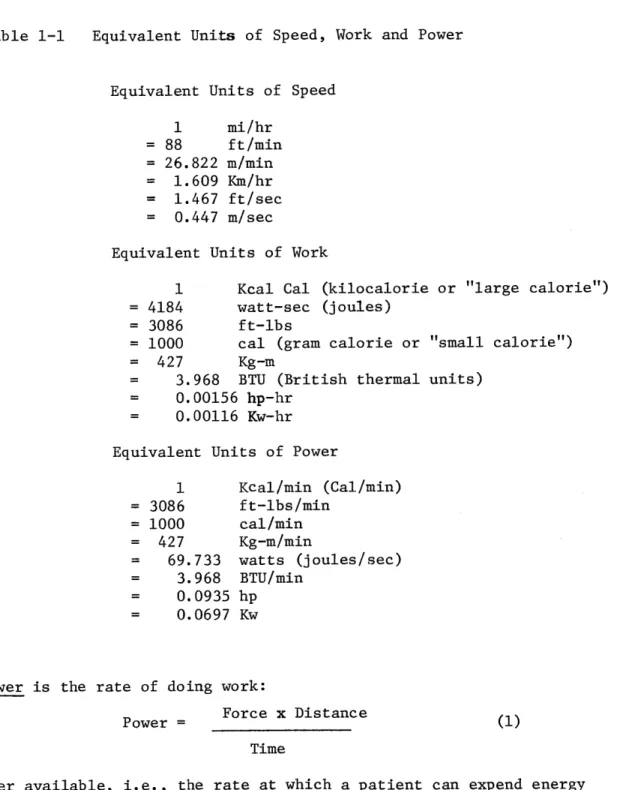
.. 49-50 . . . .. 52 .. 53-55 .. 59-61 .. 63-64 ... 67 .. . .. 68Units of Speed Work, Energy Cost
Activity...76
Power of
Walking...84
Work of Walking... Energy Cost... Immobilization and Deformity... Information Hierarchy... Accomodationl... Illumination Standards...
Graphic
... Discriminability...HlumnAdtory Standars... ... Gaki Ratev... ... . .... ... .. ... Hearing Acuity... Human Auditory Response... Walk Rate vs. Time... Power vs. Ascent,... Reaction Time vs. Ae... Stability vs. Surfacing... Walk Rate vs.Surface... Time vs. Energy Consumed... Slope vs. Walking Efficiency... Energy Consumption vs. Riser... Resting Distance... ParkingDistance...
Disability and Problems....,... Vision Zn... ... 86 ... 87 ... 91 ... 108 ... 139 ... 141 . .. . .... 0 .... 0 .... * .0. ... ... .. . .. 0 .. 0 ...143 ...144
...147 ... 149 ... 150 ...152 ...153 ... 155 ...156 ...157 ...159 ...160
... 162 ...163 ... 164 ...166 ...167 ... 168 ...170 ... #0 0# 00 *0 0 8 ... 0 9 ... ... ... 10 ... 11 ... 12 ... 0 ViewAx s ... .... ... ... 7Power vs.
Time...
... ....175
Slope Rise vs u... ... .. 177
Maximum Slope...178
Sensory Territory.e...* .o...180
Queuing Space Traffic
Stream...181
Queuing Space Crossflow Stream...182
PREFACE
This thesis, The Disabled Pedestrian: Human Factors is an attempt to identify and focus on the issues associated with those persons who are mobility impaired. The intent, however, is to help fill the broad gap
that exists in the knowledge about the physical nature of the disabled and their interaction in the planning and design of street spaces for comfortable and convenient use. At present, there seems to be a great need for more data and information concerning external environments for the disabled in order to facilitate integration. This project is to try to put together
data on what has, is and should be done and to try to work out some directions for requirements enabling disabled persons greater mobility as pedestrians.
Firstly, it is a misnomer to consider the disabled an all encompassing homogeneous group. For this study it was necessary to establish a set of principles which addressed the mobility limiting problems of the disabled pedestrian. According to the nature and extent of the disability the following distinctions can be made:
- Ambulant disabled people whose power of locomotion is not restricted by external aids but whose mobility may be impaired by old age, which affects strength, heart rate, vision, hearing and psycho-motor
cap-abilities.
- Semi-Ambulant disabled people whose power of locomotion seriously restricted by canes, crutches, and other walking aids, tripods and wheel frames. Thus a need for vertical security carries a balance problem during mobility.
- Non-Ambulant disabled people whose power of locomotion is so impaired that they are restricted to wheelchairs and the use of arm power. Also their seated position affects their visual and motor ranges. Since it is very difficult to adjust the accessibility and service-ability of the pedestrian environment to the requirements of each and every
different form of disability, the scope of this thesis will be to optimize
performance criteria for pedestrain environments to include those independent or who could be made independent disabled persons within the full spectrum
of a maximizing percentile. i.e., 90% of the persons catagorized above. Chapter one focuses on the concept of human factors and its application in the process of developing a model for man/environment interaction.
Chapter two focuses on the who and how many disabled pedestrians there may be.
Chapter three analyzes the concept of mobility and its human costs
--energy, capabilities, and limitations.
Chapter four which is divided into two sections, actually explains the
human factors both on the subjective and technical level. It gives some
insight into some of the physiological and psychological factors of disability that affect the planning and design of pedestrian spaces.
Chapter five translates the human factor elements into a rational environmental operational standards manaul for pedestrian spaces.
Finally the pictorial appendix is easy to handle and still contains the
most essential data. I have concentrated on the requirements of the disabled
person and basic data for freedom of movement which can be obtained from the sketches containing information on dimensions and motor and sensory zones of the disabled persons.
Thesis Supervisor: John A. Steffian
Title: Associate Professor of Architecture
The Disabled Pedestrian
Fruin notes the disabled pedestrian as follows:1
An estimated 12 million persons in the United States have serious disabilities which limit their mobility and the activities and work that they do. The seriously disabled include 500,000 wheelchairs, 2 million orthopedically impaired children, and 5 million cardiac cases.
Each year 100,000 children are born with birth defects that will force them to use crutches, braces or wheelchairs for the rest of their lives.
In addition to serious disabilities, many millions are limited by age in-duced phenomena or by minor sight deficiencies or other physical impair-ments which limit their locomotive capabilities. Added to the ranks of permanently disabled persons (pedestrians) are persons temporarily disabled due to accidents, persons encumbered with baby carriages, heavy baggage or packages, and women labored in pregnancy. The ranks of the disabled have been expanding much faster than the general population growth because:
- medical advances have decreased the number of accidental deaths, thus increasing the number of disabled
- longer average life spans have increased the number of aged and infqrmed;
- more leisure time, greater personal mobility and expanded op-portunities for recreation have increased accident exposure
for all persons.
Because of thoughtless architectural barriers, many of those persons
Fruin, John J., Pedestrian Planning and Design, Metropolitan Associates of Urban Designers and Environmental Planners, Inc., Church St. New York, New York, Box 722.
have been denied opportunities for education, employment, and recreation. Although they comprise a large segment of the public, they have been denied access to many "public" places, building and transit systems. This has relegated many of the aged and disabled to the status of disenfranchised citizens, denied the use of streets, free access to courts, polling places or public educational and cultural institutions. There are instances where the disabled is a handicapped citizen unable to attend court to attend their own interests. At best, they are often required to use freight elevators, facilities commonly used for refuse removal. The common bar-riers to the aged and handicapped include: steps or curbs that are too high, long flights of stairs; inaccessible elevators; steep and narrow walks; gratings in walkways; doors that are too narrow, revolve or are hard to open; too narrow aisles in theatres, stations, and other public gathering places; and lack of accommodation for wheelchairs. In addition, little if any consideration has been given to improving the mobility and safety of the blind and partially sighted, by supplementary auditory or tactile means. Needless to say, every effort should be made to improve the personal mobility and quality of life for these persons subjected to daily hardships connected with their disabilities. Furthermore, improve-ments made for the aged and the disabled are improveimprove-ments which ease the mobility for all.
This qualitative design of a pedestrian environment for the disabled requires a basic understanding of the related human characteristics and human capabilities -- an analysis of human factors. The physical dimensions
of their body and mobility aids determine working widths of doorways and passageways, and affect the practical capacity on stairs and walkways. Psychological (subjective data) preferences of bodily contacts with others is a determinant of inter-person spacing inigueuing and other crowded pedestrian environments. Normal human locomotion involves many complex characteristics of balance, timing and even human sight, imagine just how difficult this movement must be for those with disabilities. Natural free-speed locomotion requires spacial components for pacing and
for human sensing and reaction. Human locomotion exhibits difficult characteristics on different surfaces, on level surfaces, and on stairs, with the latter requiring much more expenditure of energy and attention
to design because of safety. The perception of urban space is related to its coherence of expression. Confused spacial design lowers human receptivity to aesthetics and other secondary visual inputs.1
Insufficient considerations of disabled human space requirements has resulted in inadequate design of many areas where pedestrians may be
re-quired to circulate. Different environments logically require the application of different qualitative , as well as quantitative, design standards.
The pedestrian design rationale for shopping areas would not apply to trans-portation terminals and it follows that airport terminal standards would not directly apply to rapid transit facilities. Each has its'own traffic patterns, physical restraints and individual environmental requirements,
but underlying each is a human performance factor essential to the indivi-dual performance of disabled users. To date no evaluation or consideration
of these human conveniences have been made.
Since
human convenience is a primary consideration in environmental design, pedestrian design standards must be based on a relative scale of this factor.In analyzing the pedestrian environment for the disabled outlined from the following (next sheet) outline of the pedestrian planning process are the factors and variables which this thesis needs to take into account in consideration of a human factor application of disability to pedes-trianism. One may notice we are only concerned with the actual physical qualities, be they man or environment in determining the capabilities and limitations affected in a man/environment interaction. The project deals with the general objectives of a disabled pedestrianism improvement program, studying procedures and techniques and some methods of plan
implementation.
The following pages of matrices and outlines detail the performance criteria, within the full spectrum of the pedestrian environment that this thesis attempts to analyze and evaluate in regards to the disabled pedes-trian.
ENVIRONMENTAL FRAMEWORK
Pedestrian Environment Environment Elements Environmental Inventr
Corridor Movement Pattern
Circulation Planning Edge
Vegetation Landform Building
Interchange Nodal Elements
Interaction Banking Urban Design View Panorama Feature Enclosed Focal Intermittent Components Distribution of Generators Vehicle Storage Identifiability Incidental Activities Elements Intrinsic (already standing) Dependent (direct result
of pedestrian path) Visual Diversity Intensity of Path Choice of Route Supports Terminal area Supports Decision Points internal external enclosure supports supports supports
Road surfaces, slopes, gradient, percent and degree
widthlengthtimesigning -
direc- tionalsituationalfunctional,lo-cationalauxilliary
squaresblockspace,parksmini-parks, plazamallsturn lots, information centers,public transit stop
coordination of major links along networks
interrelated location of major
generators
Major Parking Lots
development of landmarksaccentua
tion of distinctive or unique architectural of typographic features
street functions - benches,kiosk,
sidewalk stands, impediments
display - bus
stop,vendors,bill-boardsnewstand,
sidewalk features -
graphicssign-postingtelephonesfireplugs, mailboxes,trash receptacles,
plantinglightingtraffic control devices
Mo 0 6.0 0 0 0o 0 PO M H C N O CO 0 0 0H0mo0 o rt 0 C rtCDm' o C M IM O H- W 0 a, P Ft 0 o C o I H Ht C3o H- H H- M %4 Ct 4 F- 0 : 0 m C HH- rp H Po M ) H _ H- Fl H- H- t o H. Ft o* 0 t 0 -t 0 M CD * p. e
e
e e eC * * I. * * * O 0. 1P0 S.. * ** A*1*
CD m o oo C o o -Co t H. "i Ft t-h Co H "r 0 W F- M -r M o H- C H CDt 03M _k4rtco F P- H- t- rt F-t o CD -F 0 m . -H. o r Co t CD FAM 0O r t Ft0 -- - ---- -a ee * e o Coa -4 F t iCo 0 t %4 C -' H- Ft F- H. H -' F- 0--c C o ci m H_ -0 H- 0 so H CO t H' C F- M 0 P- C o F-H' S Os *e S S S S U * O6D C 5.60 @6 be * *Se * e.g S 0 9 S S jet 0 S Co (D M M 0 M:jCA Co tnvironment Sub-System Components {open space intensity of path choice of route.parks squares places malls transit
stops linkages routine coordination sidewalk furniture traffic device signs ..
signing lighting benches concession
area
vendor newstand kiosks materials
handling air control --- air temp -surfacing materials
windows doors roofs storage
system -energy sources energy distribution space dividers exterior walls communication system information system Ft CD C-d rt t 0 0 Ft 0 0 rt Ft- CD FtA 0
U 1-d > 14 > U H M 0 0 10 M rt " rt <| c -0 ) CD 0 H 3 l a 0) 0 0 w w)00 r1 M < et 0 r-t H. 0 0 t F -0 0 et (D F- H M -. , rH. H M H rt 0 M rt 0 Mm M~- OCD 0 :JQr 0 0 Pd J g-o .oa t a * s 0 -1 0 0 rt s.0 I-w 91 e~t Ml F" F" H H P0 0 0 Ml En 0 'CD et er M 0 La. Ma ) rt D Ii y H , Reconnaisance Study * Safety 0 e * Security e * * Convenience 0 " ' Continuity Comfort * . * System coherence Attractiveness Land Use
Origin Destination Trip
generation Travel system Traffic volumes Tickets Laws and Finance
Costs Benefits Financing Meeting
goals
Objectives Reports Meeting
*
Implementation Schedules Financing Operation
1-d I I- 0
*
0@
JO-CL (DO r1 CL:'P 0) CD "i 0 0 0t o W 0 o (D 0 a H 0 CD
IJ-Transit Auto Taxi Walk
a a Walk time Save face M Walk reliability Fatigue -D Handicaps * Exercise D wComfort CD
~Others
't -- Work -- Shop 'Business H_3 (tCultural Social Other
: Tertain Walking distance Traffic signal delay C HEnergy outputs Image interest D *Weather protection *t
Security Other Office
0
1-4 Id -P-e do0 o C 0 Id P3 H FI. rt H- (D M H O D HHi EJHHuh H 'H Htr r En W H. H H. 'dH H- H.l rt CD~ P D) D 0H OQCD M D _ CD :3 cn ' C P3 *e* 0 e 0 *0 * e 0 L.. rt 0 C) (-. CD H 0 r1 9 e User Forcasts Growth components ** 0 * * **Characteristics Personality Traffic volumes Patterns, peaks * * * 0 * * Composition Facility type Traffic type * a * * Safety * * * * *
e
Space restraints * * Economic restraints * * ** * * * Convenience * Flow charts * Service vacancies e Service time * * * * * *Working distances e e * * *Grade change * Load 0 Unload aWait Tickets Baggage Manpower Computer
simulation e e Walks 0 oDoors Stairs * e * * * Pedmovers 6 * * *0 ** WAiting space Platforms begin e* ** ***Signs Machanical aids e e * ** *eeControls 0 . * *** * Lighting * a * ***Finishes 0 0 * 0 ** Furniture I System closeness Visual aesthetics Design operability Maintainability Manpower, economics Construction phase CD 0D H CD C3 F-4. 9l C p C C p 09 C So *9 Ge CC * C 0C I. 0 e
THE PEDESTRIAN PLANNING PROCESS DEFINE GOALS OBJECTIVES Reconnaisance STANDARDS _ Studies IrSafety, Security, DE.-- - -Convenience,
STUDY DESIGN Coatinuity,
- ---- Comfort .
RdSystea Cohereuce,
INVENTORY AND\
'~AT CLLCTO r gin an Destination Trip Generation
Travel Patterns
* IYR Traffic Volumes(
AND ,~, Trends - Past & Future
-- -Laws, Financesj Revise ' BRefine e PRSETAIO Reportsx*awl CeNetGToY APPROVALSOMeeti AD PLNSLECTION -Financing, I Operation * rvlPten
PEDESTRIAN TRIP VARIABLES \- a - - N MODE OF ARRIVALi. Auto AT START NODE x Walk-Walk Time
1Save Fare
(Walk Reliability IPERSONAL _ _ ____________Fatigue, Handicapsi
VARIABLES Exercise --- aComfort Qther -Wor'k Shop [TR P PUPOSEBusiness\
TIP PURPOSE Cultural \
1
Social
Other
Tlerrain
Walking Distance Traffic Signal Delay
r
...
-
-TrafficConflicts
PATH VARIABLES Energy Output
Image, Interest Weather Protection )Security O0ther - Office IStore lIndustrial -Theater, Museum1
LAND USE _ _Government
I
END NODE Historical1 1) School tResidential tOther . ftft- . -0 .0-0.
lie;
.ELEMENTS OF PEDESTRIAN DESIGN Building and Street Spaces
PRELIMINARY PLAN r f- -0fw f
OBJECTGOES ADUrowth Componens,
.-- -Characteristics,-.-
Seasonality,
) Traffic-Volumes
PEDESTRIAN jPatterns, Peaks,
TRAFFIC Composition.
DEMAND -
-DES GFacility Type,
Traffic Type, STA S Safety, Space Restraints Economic Restraint' Convenience. rFlow Charta, Service Sequences, - -....
I
Service Times,SYSTEM ) Walking Distance,
REQUIREMENTS Grade Change,
-- - *-Load, Unload, Wa icketsBagg ge, Manpower , Computer Simulationk Wlks, Doors, .Stairs, Pedmovers
FUNCTIONALI Waiting Spaces,
ELEMENTS Platforms, Sig"&
--- . -
iMechanical
Aids,rvis Controls, Lightin
Finishes, Furnitur
Refine ... ,-.. ...
System Coherence,
S Visual, Aesthetic
SPACE DESIGN - ein prWi3
Design, OperaM~kity
A Maintainability, Manpower, Economic
Construction L
FINAL SPACE ) Phase
THE MODEL
The process of development of our pedestrian environment for human use was essentially one of evolution. Through the use of that particular space it was possible to identify its deficiencies and to modify that space accordingly, so that the next generation of environments would better serve its purpose in actual use. Experience then was the primary basis for improvement and further adaption.
But today's built environments have been modified to respond to the adaption level of those individuals who can be considered the average ani-thropometric measure of man. (Anani-thropometric meaning having prescribed physiological measure of performance and competence in getting around a mobility state). While we frequently hear of the "average" or "typical" man this is in one sense, an illusive, will of the wisp concept. In the domain of human anthropometric there are probably few, if any, people who can qualify as average - average in each and every respect. The average is a numerically devised arithmetic means of some quantitative measure (height, weight, etc.). While the average man is then something of a myth and if average is recognized for what they are (arithmetic mean), there are however, certain types of design problems which can optimally be re-solved by designing the facility, environment, or equipment for the average person who is expected to utilize it. However, there are certain
circum-stances in which these designs based on the average person would not be satisfactory. Thus, if there is any "limiting" factor in the situations limiting in the sense that persons below or above a given standardization
(physiological fit) dimension could not be accommodated -- we must employ
a different principle of designing to accommodate and suit those body needs charactized by the standardized population stereotype.
To optimize the procedures for urban analysis and design, one must know the dimensions of the limiting factors of the user groups involved in the process. What planning and design that has been done has tended to restrict the performance levels of those user groups whose anthropo-metric make up is not compatible with those standardized measures of man. Thus this thesis tends to analyze the concept of human factors as applied to urban analysis and design. The emphasis will focus on the disabled pedes-trian. (disability refers to those persons handicapped in their mobility due to conditions resulting from chronic organ or neurological impairment, birth defects, orthopedic injuries and age induced phenomena) The develop-ment of a body of information and principles that would be applicable to these and other problems is primarily dependent upon research, judgmental factors, experience and design simulation process. At present there is very little information available about some areas of human performance of the disabled as related to man/environment interaction, and at least partial information about certain others, but in most areas the information available are almost virtual information voids. Such design deficiencies can be
attributed to two systems -- the human dysfunction system and the environ-mental dysfunction system. The deficiencies can be attributed in part, to the fact that such systems being more elaborate than that which people pre-viously had used created human factor problems than were characteristics of previous systems. And since some environments are designed and produced
spontaneously and from scratch there was no opportunity to benefit from previous experience in the use of earlier models, and lastly the evolution process failed to evolve new users to new technologies and methods.
The purpose of analyzing the human factors associated with the dis-abled pedestrian are to develop a set of urban analysis system per-formance criteria. The focus of assessment will assess the levels of performance of those afflicted with mobility, limitations to identify the corresponding environmental framework to support that identified limitation.
The problem arises can one design a system to design a model without first knowing what the designed system is to be, and not finally but suf-ficiently. A design system should meet the requirements of those for whom it is designed. It was in this latter point that I defined the purpose.
I realized I needed to know for whom I was constructing a model and obviously for what use.
It was felt that a valid argument was made that the focus and integrating force of the model should be the human performance factors of the disabled pedestrian. A literature survey reinforced that belief since these
consi-derations were excluded in the basic design goals of most of the literature. But, if I were to develop a model to whom should I address it? Should it be used by those who design, those who maintain, those who workiand. live on them, or all three?
A concerned public can do little unless it is informed. An informed public can support positive environmental change and attempt to suppress negative environmental change only if it knows which is which. Activist groups, sensing possible flows in the system, have opposed in-city branches of the interstate highway system. College students have effectively
dis-rupted the educational system of universities. In one case there is a resistance to a proposed innovation in the environment. In the other case there is an attempt to disrupt an entire system without suggesting the focuse the environmental replacement will take. Neither kind of activity will in the long run, produce useful results unless it is based on some logic of desired change. That is the public picture, The private picture is that the individual who creates environmental designs, on the one hand, and the individual who live with these designs, on the other, would be better served if all were better informed. This study has me convinced that designers are not attempting to create functional environ-ments which support the normal activities of its users; rather they are attempting to create eye-catching products which suggest an image of status and success -- and which will sell despite its level of convenience. A designer should know all the things a user group will need and do or want to do as Deasy12 suggests: a user should know all the things his user group does and he should know what he can expect from the built product in terms of those activities. Knowing these things both can improve the environment, one by creating designs, the other, b9 knowing how to use the designed environment effectively.
What do we need to know about the system? We need to know how the design of the man/environment system for the disabled pedestrian relates to achivement of objectives. Not behaviorial objectives but physical objec-tives. Appearing tolave been somewhat lengthy making these points as back-ground for a statement of purpose of the model; it is because this is a large issue, widely discussed and not discussed in the current literature
and is necessary to set the stage for an objective which is as much a human factor objective, as a methodological objective, as an reality or learning and communication objective at any pragmatic level.
First we must define the elements of and criteria for human per-formance evaluation. Within the man/environment system, there are four relatively distinct types of criteria which in various context may be pertinent indication of human behavior. These are human performance measures, physiological issues and indices subjective responses, and
accident frequences.Fruin
(1) Human performance measures - In a strict sense human performance must be considered in terms of various sensor, mental, and motor activities.
For specific environmental situations, however, it is usually difficult if , not impossible to measure human performance in strictly human activity terms since such performance is inextricably intertwined with performance characteristics of the physical equipment being used. Thus
the wheeling performance of a wheelchair user is not entirely the function of the wheeler, but is also in part the consequence of the wheelchair.
(its make correction size, etc.) To illustrate two sets of system with the same objective namely that of traversing 1/2 mile in the shortest space of time. One of the systems is a "walker" and the other is a "wheelchair user". The likelihood that (perhaps inevitability that the walker system would get there first tells us only which system is fastest - this would be a system performance criteria). It tells us nothing about human performance, it could be that the wheelchair user system is doing a better job of wheeling
(in terms of human motor and coordination) than the walker is in walking.
The strictly human performance can be so inextricably mixed up with the physical properties of the system and specific physical activities it requires that it is virtually impossible in such a situation to separate strictly human performance criteria from performance of the total system of which the individual is a part.
The state of affairs does not mean that we can never obtain useful information about human performance abilities. For many practical purposes performances may be measured and rated under conditions in which the task and any associated equipment and procedures are constant. Thus we can compare the relative wheeling abilities of several wheelers but for such a purpose they should all use the same or comparable wheelchairs. When
the physical aspects of the system are held constant,differences in the man/equipment system performance may be presumed to reflect individual
differences in the human performance levels of the system. Since human performance is in large part a function of the characteristics of the system being used, the primary emphasis in human factors investigation is in terms
of measuring systems performance, and the objective is that of developing systems that are reasonably optimal in the scores.
There are, however, some circumstances where it is possible and appro-priate to utilize what are more nearly "pure human performance measures;
-those that are less influenced by the characteristics of any physical system. Such as traffic studies which check the time pedestrians will wait for a light to turn before starting to cross a street against the red light. Such behavior in a broad sense can be considered as performance criteria. In terms of conventional psychological research with human subjects, human
performance can be ascertained in terms of such activities (criteria) as visual discrimination (usually expressed in terms of visual angle of the
samllest detail that can be discriminated), auditing thresholds, net power, and reaction time in selecting the appropriate responses from any of a specified set of possible alternatives. Such human performance and in-formation can be useful in designing systems in order to capitalize on man's strength's and to compensate for his limitations. So it becomes
possible to describe human performance quantitatively in such operational
environmental terusAit will then be possible to compare man's abilities
with those cE the environmental components on the basis of comparable (en-vironmental support) criteria.
(2) Physiological indices - For some purposes indices of various phys-iological correlations are pertinent criteria in connection with man/
environment interaction. Such possible indices include heart rate; blood
pressure, skin response, respiration rate and many other measures. Some of these and other physiological variables are used as indices of the physiological effects on the people of various methods of activity, of activity performed with equipment of various designs, of activity periods and of activity performed and various enviromental conditions such as hot and cold.
(3) Subjective response -
In some cases)occasions obtaining subjective
responses of people are in order. These may be of varied types and obtained by different methods. As an example, ratings provide systmatic means of obtaining judgments of people; such ratings can range over a wide gamut,including ratings of people and their performance, of the quality of ob-jects, of the disability of different features of a system and of the importance of different types of information for use in a system. Any method of obtaining data may be useful criteria.
(4) Accident frequency - In pedestrian systems the safety of human beings are important criteria by which a system should be evaluated. Thus the number of injuries or deaths, would be useful in comparing one system with another. As with many criteria it is possible that a criteria of accident frequencies is not necessarily an exclusive indi-cator of the relative accident liabilities of two or more systems that are being compared for some circumstances and to some degree, Individual dif-ferences in the accident susceptibility of people can affect the accident indices in making cross-system comparisons (for example, the transportation system criteria).
In connection with the human factor aspects of such systems therefore, it is important that in the initial design of systems, human factor con-siderations be taken fully into account. What is meant by taking human factor considerations into account during the design stage. Such questions could include the following: should a particular warning be visual or auditory? The solution to the question and many, many other kinds of questions should be based on the availability of pertinent information about human capabilities and limitations. In a practical design problem, if pertinent information is not yet available regarding some human per-formance characteristics, there are two or three alternatives from which to choose.
1. One can pick answers out of thin air, this is obviously
pretty risky business, although it is unfortunately a fairly common practice.
2. It may be possible to carry out some research.
3. It is possible to solicit the judgment of experts.
Therefore the purposes of our model are these:
1. To develop and to integrate data about man/environment
re-lationships (focus on pedestrianism) for the disabled.
2. To develop and to integrate and to implement environmental design concepts - the objectives of which are to improve the relative scales (especially the micro components) in the construction of
pedestrian environments for the disabled in the direction of physical (human) performance capacities, capabilities and
limi-tations.
3. To develop a framework for analyzing pedestrian systems to optimize
use.
4. To develop and guarantee the principles and standards for
environmental street design.
5. To do these things in a generally comprehensible language.
The credo of functionalism which emerged in the earlier part of this century as an operational goal seemed to offer the diagram and clear and rational program for effective action. The comfortable notion of cause and effect suggest is "form follows function" was and is an
been systematically addressed: function of what? Among disciplines bound to a more rigorous use of such terms, a functional relationship
connotes something quite precise. It connotes a specified relation-ship between empiracally identifiable independent and dependent vari-ables. Other designers, such as Le Corbusier, while definitely pre-occupied with problems of "form" have also spoken of "human measure" in general terms. While their artifacts have never been systematically analyzed or verified in this regard the effect of their expressed intention has been to keep alive the possibility and obligation to formulate "human-oriented" design goals. Out of this has grown a serious, even if con-fused, effort to systematically probe what designers have surreptitously referred to a "human need". What we really seek is a discipline which addresses itself not singularly to inside or outside,to small or large domains, but one which is technically committed to environment as an
in-ternal aspect of human biological and non-biological systems. What is required of course, is not a "redefinition of terms", but an entirely new taxonomy of problem formulation -- one based upon the systems of performance criteria to be accommodated.
Models of the Man/Environment Relationship
There are many design-oriented models of man/environment relationships (we use the term model to describe some formal statement of principles of relationships). Possibly the most sophisticated is Studer's1 "behavior-contingent phsyical systems" model. Studer2 has also suggested a formal
context for environmental problem formualtion. Alexander3,4,5'
has
sug-gested a variety of models basic to the design of cities. Chapin and Hightower6 have suggested a structure of "household activity systems" to describe the living patterns and attitudes of urban residents that relate to their use of city spaces. Barker has described the man/en-vironment relationship in terms of "behavior setting." Hall8 and Sommer9 and many others have described basic principles of man's use of space. Schowalter and Malone10 suggest design models for lunar habitability and Nohwill examines the role of stimulus control as central to
design. These and many other models were examined, none of these models seemed to suit the project purpose, in that (1) none was microscopic enough to incorporate the total man/environment relationship as needed to be envisioned, (2) if it was general enough, it depended upon data and concepts not yet available, and (3) none seemed to be capable of incor-porating the observations and design concepts of the literature. Very basically these models were behavior contingent models. Thus relating mans needs and use for and of space on a level of use relationships de-pendent in behavioral human factors. (culture, sociological implications exterterresterial, time centralizing, etc.) Whereas my model is trying to understanding the construction composition which goes into the design and organizqtion of space fitted with its elements as determined by human performance. The qualitative difference in analysis would depend
on the work's organization and composition. Since in my eyes the organization model is more of a macro-analysis while some get to term it micro and the com-postion model is reflective of a micro-analysis. Thus my model reflects the later.
Regardless of whether you are designing a man/environment inter-active system from scratch or merely giving it a product of face lifting, the follwoing general steps are considered and noted for-a successful problem solution:
Information phase: acquire snfficent information
requirements of constraints, environmental con-ditions, and type of people who will use the design to be able to state positive and concise objectives for the applied design.
Planning phase: explore alternative approaches for stated objectives, keeping in mind such factors as economics, reli-ability of product, ease of maintenance.
Selection phase: select the design which seems to optimize all factors tested in Information and Planning phases. Proceed utilizing human engineering factors.
Test phase: Develop, construct and analyze models using
factors to evaluate and to test the model against stated objectives.
Field Test phase: depending upon the nature of the design it may be necessary to test your final designs under actual operating conditions - using actual personnel who will eventually use the end item.
Having defined the performances to be accommodated, the next problem is that of specifying the characteristics of the correlated physical system. These variables which the designer manipulates fall
into two categories: (1) those which support certain behavioral topo-graphics through maintenance of appropriate physiological states and (2) thosexhich don't, i.e., the requirements of the appropriate physical system explicitly specified.
If the architectural environment is to support the behavioral scheme in any effective way, it must be an integral aspect. What is required then is a system which includes the following characteristics.
(Study)
Identify and Legibility
Comfort and Protection
Accessibility
(1) Well fitting, i.e. maximally integral with and supporting, the behavioral scheme required, and in equilbrium with externally upbringing variables.
(2) Highly adaptive, i.e. responsive to the changes in behavioral design to experi-mentally manipulations and to external
constraints. (climatic and other uses) (3) Capable of higher levels of initial
adaptability, i.e. exhibiting a broader range of manipulations.
Flexibility and Adaptability
Economy
(4) Open-ended, i.e., the ability to add to, or subtract from the total system with-out causing serious disequilibrium. (5) Economically feasible, i.e. in terms of
both construction and maintenance. What I have attempted to conceptualize is the general characteristics of an environment which is in constant change and capable of several im-portant functions. There is no reason to assume that the real physical
system will be "ugly". Whatever that may mean; it will be "reinforcing" because that is a requirement of its behavior - contingency.
1. Raymond G. Studer, "The Dynamics of Behavior - Contingent Physical Systems," Paper presented at the Portsmouth College of Technology Sym-posium on Design Methods, Portsmouth, England, December 4, 1967.
2. Raymond G. Studer, "On Environmental Programming," The Architectural Association Journal (May 1966).
3. C. Alexander, "The Determination of Components for an Indian Village," Conference on Design Methods (New York: MacMillan Company, 1963), pp. 83-114. 4. Christopher Alexander, "The City as a Mechanism for Sustaining Human
Contact," Environment for Man: The Next Fifty Years, edited by William R. Ewald, Jr. (Bloomington, Indiana: Indiana University Press, 1967).
5. C. Alexander, Notes on the Synthesis of Form (Cambridge, Mass.: Harvard University Press, 1964).
6. F. Stuart Chapin, Jr. and Henry C. Hightower, Household Activity Systems - A Pilot Investigation (Chapel Hill: Center for Urban and Regional Studies, University of North Carolina, May 1966).
7. Roger Barker, Ecological Psychology (Stanford, California: Stanford Univeristy Press, 1968).
8. Edward T. Hall, "Proxemics," Current Anthropology, Vol. 9, No. 2-3 (April-June 1968), pp. 83-95.
9. Robert Sommer, Personal Space: The Behavioral Basis of Design (Englewood Cliffs, New Jersey: Prentice-Hall, Inc., 1969).
10. David T. Schewalter and Thomas B. Malone, The Development of a Lunar Habitability System (Alexandria, Va.: Matrix Research Company, March 12, 1970).
11. Jochim F. Wohlwill, "Man as a Seeker and Neutralizer of Stimulation," Paper presented at Institute of Environmental Quality Management, University of Connecticut, Storrs, Conn., December 12-13, 1968).
12. C.M. Deasy, People in the Streets -- People in the Parks (Los Angeles: Deasy and Bolling, 1967).
13. Raymond G. Studer, "The Dynamics of Behavior - Contingent Physical Systems," op. cit.
14. Kenneth H. Craik, "Environmental Conditions and Human Behavior," Paper presented at meeting of the American Association for the Advancement of Science, December 31, 1968.
15. D.C. McClelland, The Achieveing Socity (Princeton: D. Van Nostrand Co., Inc., 1961).
16. Ralph G. H. Siu, "Role of Technology in Creating the Environment Fifty Years Hence," Environment and Change: The Next Fifty Years, edited by William R. Ewald, Jr. (Bloomington, Indiana: Indiana University Press,
1968), p. 83.
17. Robert D. Campbell, "Personality as an Element of Regional Geography," Annals of the Association of American Geographers, Vol. 58, No. 4 (December
1968), pp. 748-759.
18. A. F. C. Wallace, Culture and Personality (New York: Random House, Inc., 1961).
19. A. F. C. Wallace, "The Psychic Unity of Human Groups," Studying Personality Cross-Culturally, edited by B. Kaplan, (Evanston, Illinois:
Row, Peterson and Co., 1961), pp. 139-140.
20. A. F. C. Wallace, Culture and Personality, op. cit. 21. Hall, op. cit.
22. C. Alexander, Notes on the Synthesis of Form, op.cit.
23. Stephen Carr, "The City of the Mind," Environment for Man: The Next Fifty Years, edited by William R. Ewald, Jr. (Bloomington, Indiana:
Indiana University Press, 1968).
24. Richard Myrick, Planning Study: Behavioral Factors in Dental School Design (Washington, D.C.: The George Washington University, October 1965). 25. C.M. Deasy, Social Psychological Considerations in Architectural
Planning (Los Angeles: Deasy and Bolling, Architects, 1966).
DEFINING THE MARKET
Referenced:
Edited in cooperation with Jeffrey L. Cooper, Department
of Architecture, M.I.T., The Marketing of Adaptive Housing to the Physically Handicapped, Thesis, M.I.T.
DEFINING THE MARKET
Introduction
This chapter attempts to define the size and character of the
dis-abled market. 1 Firstly, some definitions
are in order. The words "handicapped" and "disabled" are used
inter-changeably in this study to refer to persons with limited mobility due
to the incidence of one or more chronic health impairments.
Not being able to move freely these persons are thus confined in
carrying out their activities of daily living. Many are in need of
special mobility aids such as wheelchairs, crutches, braces, etc.
The inability to 1m-ove freely can result from any one of a number of chronic neuro-muscular or skeletal diseases, (such as kultiple
Sclerosis, Cerebral Palsy, Muscular Dystrophy, Arthritis, Parkinson's
Disease, Polio, Myasthenia Gravis, Spina Bifida), from heart condition, from damage due to stroke, or simply from accidental injury.
As a first step towards familiarizing the reader with the nature
and prevalence of these myriad causes of mobility impairment, we shall now turn to a brief description of the most prevalent of these. Each description will be followed by a numerical estimate of the number of Americans suffering from that affliction.
A. The Nature and Prevalence of Mobility Impairing Diseases
(see Figure lA, p.40 )
Paraplegia and Quadraplegia (see Figure 1B, p.4
4)
or partial paralysis of the lower extremities. Quadraplegia is the complete or part paralysis of both the upper and lower extremities. The terms
"paraplegia" and "quadraplegia" are generic terms, and not diseases in themselves. Paraplegia and quadraplegia may result from any number of causes, as mentioned above.
"Traumatic Paraplegia" or "Quadraplegia" refers to the onset of paralysis due to injury from a disastrous occurance. Damage in such
cases (diving accident for example) is usually to the spinal cord it-self - the location and severity of the lesion being directly related to
the location and severity of the paralysis. Almost all traumatic
paraplegics or quadraplegics are "Spinal Chord injured.".
In 1965 there were an estimated 1,516,000 persons suffering from paralysis of all types, and all degrees. Approximately 116,000 .of
these were paraplegics and quadraplegics. Of this latter population, approximately 25% suffered their disability due to spinal chord injury. The incidence of spinal chord injury is approximately 3,000 persons per year, or 15 per million in the population. (National Health Survey
No. 1000, Series 10, Number 48). (see Figure 1B, p.4I ).
Using this rate, it can be estimated that there are approximately 53,000 spinal chord injured persons in the U.S. at this time.
Multiple Scle.rosis
Multiple Sclerosis is a disease of the central nervous system. By in large it affects people in their prime years, between 18 and 45. As the disease progresses, myelin, a cellular coating of the nerves begins to disintegrate and is replaced by scar tissue. The exact cause is
-known. No cure has been developed.
Depending on the stage of development M.S. can seriously impair the ability to move, eat or even talk. Many of the persons afflicted with M.S. are confined to wheelchairs. There are an estimated 500,000 victims of M.S. in the U.S. (Multiple Sclerosis Society, 1968).
Cerebral Palsy
Cerebral Palsy refers to the impairment of muscle and power co-ordination due to brain damage. As a rule, damage occurs before or at birth.
Many of the victims of Cerebral Palsy are wheelchair bound.
There are an estimated 550,000 victims in the U.S., with 25,000 new victims being born each year. (National Institute for Neurological
Diseases and Blindness, NINDB).
Muscular Dystrophy
Muscular Dystrophy is a non-contagious disease cf unknown cause,
in which there is a gradual but irreversible deterioration of the muscles. There are an estimated 200,000 persons suffering from Muscual
Dystrophy in the U.S. (NINDB).
Arthritis
Arthritis refers to the inflamation of the joints. Rheumatoid Arthritis, the most common variety, is a chronic disease marked by
inflamation in the synovial membrane of the joint and rarefication of the bone. The disease is a progressive one, affecting primarily the elderly. Approximately 17,000,000 Americans suffer some form of Arthritis (Arthritis Foundation, AF). 250,000 of these are completely disabled as a result.
Parkinson's Disease
Parkinson's Disease is a progressive nervous disease of the later years. It is characterized by muscular tremors (especially in the hands), a general slowing of movement, partial facial paralysis and
impaired motor control.
There are approximately 500,000 victims of Parkinson's Disease in the U.S. (NINDB).
Poliomyelitis
Polio is a viral infection, affecting the motor neurons of the spinal chord. It is a degenerative disease. In other words, as it progresses, it destroys live cells. Primarily polio affects children. Although there is no cure for the disease in its advanced stage, pre-ventative vaccines have existed for some time now, and the incidence of the disease has been drastically reduced. There are an estimated
451,000 victims of polio in the U.S., a portion of whom are totally
disabled.
Myasthenia Gravis
Mysathenia Gravis is a syndrone of the muscular system. Progression of the disease results in progressing severity of paralysis. At advanced
stages, victims are bound to either wheelchair or bed. There are an
estimated 30,000 victims of M.G. in the U.S. (NINDB).
Spina Bifida
Spina Bifida refers to a congenital defect in the spinal column which prevents norial development and growth, As the disease progresses
mobility can deteriorate to eventual incapacitation. There are an estimated 30,000 victims in the U.S. (NINDB).
Stroke
"Stroke" is the degeneration of a portion of the brain resulting from clotting in or rupturing of a blood vessel. Severity of damage can
range from "unnoticeable" to partial or complete paralysis and, in some cases, death.
There are presently, 2,000,000 living victims of stroke. (NINDB).
Respiratory Ailments
This is a general term referring to chronic conditions of the
respiratory system. Such chronic conditions as Tuberculosis or Bronchitis can severely limit energy expenditure and thus general mobility of the
individual afflicted. In 1967, 757.,000 Americans suffered limitation of activity due to Respiratory Ailments.
Heart Condition
"Heart condition" is a general term referring to a large number of chronic conditions that impair the functioning of the cardio-vascular system. As a result of this the c-v system is excessively vulnerable
to malfunction, or heart attack. This excessive vulnerability impairs ability to expend energy and degrades freedom of mobility. Approximately
3,600,000 Americans suffer degrees of heart conditions serious enough to impair their daily activities. (National Heart Survey, Series 10, Number
Now that the reader has been familiarized with the most prevalent causes of mobility impairment, we will now turn to data from the
National Health Survey and attempt to explore the mobility handicapped
FIGURE 1A
THE NATURE AND PREVALENCE OF MOBILITY IMPAIRING DISEASES
(1968)
*
Spinal Chord Injury Multiple Sclerosis Cerebral Palsy Muscular Dystrophy Arthritis Parkinson's Disease Poliomyelitis Myasthenia Gravis Spina Bifida Stroke Respiratory Ailments Heart Condition ______________________________________________________________I __________________________________________________________________________________________
I
__________________________________________________________________-J
_______________________________________________________________________ zixmhIIIz __________________________________________________________________________________________________ ______________________________________________ 1 100 * Estimated 1973. 1,000 (In thousands) 10 (in millions) 1004
a
i fFIGURE 1B
THE PREVALENCE AND NATURE OF PARALYSIS (from all causes)
(1968) 1,500,000
-1,000,000
-500,000
-I' - ~-Paralysis (all types, all sever-ities) I Para-and Quadra-plegics Spinal Chord InjuryI
I
B. The National Health Survey
The National Health survey contains statistics on persons limited in activity and mobility due to chronic health conditions. It is based on data collected in household interviews of the civilian, non-in-stitutionalized population of the U.S. during the period July, 1965 to June, 1967.
Thus, the estimates it gives do not include those handicapped persons who are hospitalized or in the care of nursing homes or other private agencies. For this reason the numbers presented are actual underestimates of the prevalence of chronic mobility limitation in the U.S. However, for the same reason, these numbers to present a more accurate picture of the true private disabled market for adaptive household appliances.
As a first step towards analyzing the prevalence and severity of mobility limitation, we will turn to data concerning the use of special
mobility aids.2
The Use of Mobility Aids (see Figure 1C, p.4j)
It is estimated that a total of 6,226,000 persons are in need of "special aids" to help them move. This includes wheelchairs, crutches and walkers (four-legged supports) as well as artificial limbs.
An estimated 409,000 persons are wheelchair users, with 50% of that number being bound to their wheelchair all of the time. 443,000 depend on the use of crutches to move, while another 404,000 depend on "walkers".
FI GURE 1C
USE OF MOBILITY AIDS (1968)
Wheelchair Crutches Walkers Arti- Arti- Others ficial ficial Limbs Limbs ( leg (arm or or foot) hand) 500,000 400,000 300,000 200,000 100,000
We will now analyze the Mobility Handicapped Market by the six following categories.
1. Impairment by Chronic Condition Causing Limitation
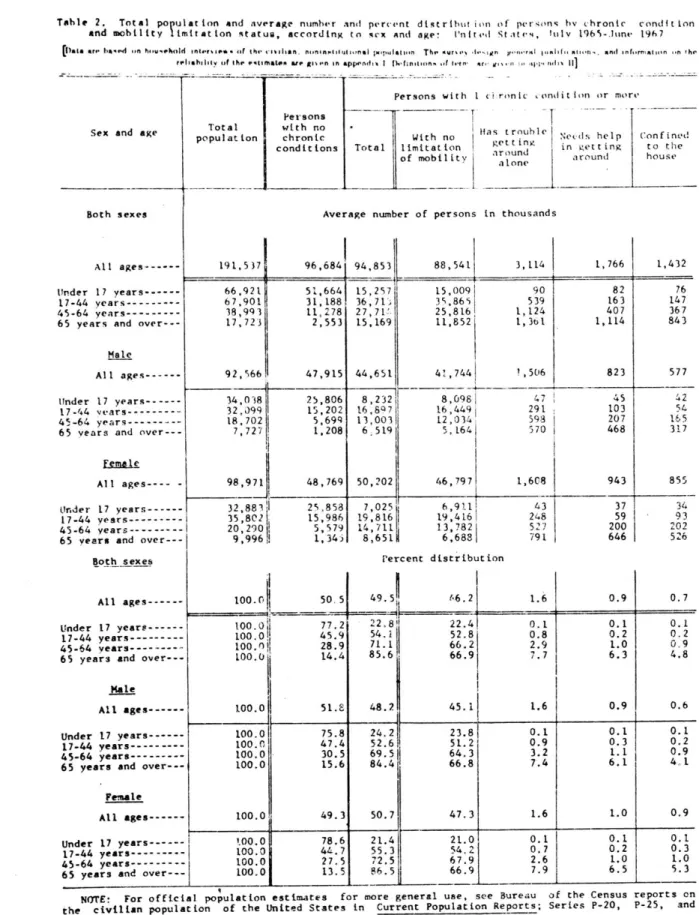
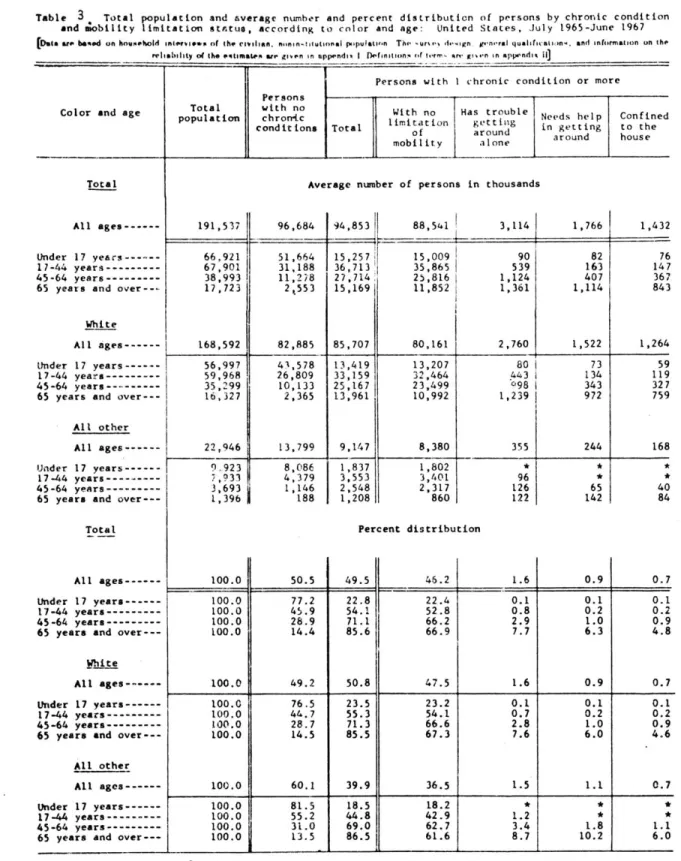
2. Impairment by Sex and Age 3. Impairment by Race and Age
4. Impairment by Family Income and Age 5. Impairment of Employment Status
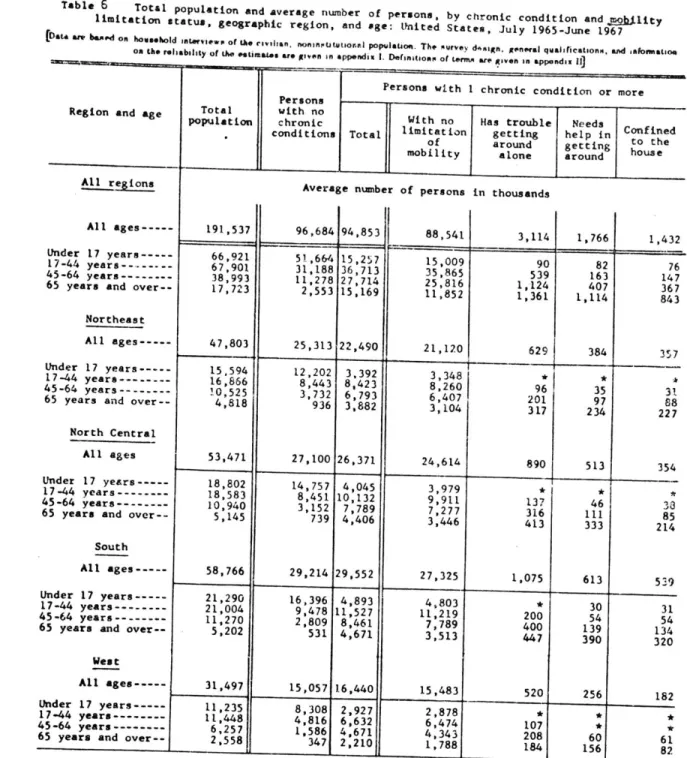
6. Impairment by Geographical Distribution
1. Impairment by Chronic Condition (see Figure 1 and Table 1, pp
444
Table 1 shows us the leading causes of mobility limitation in the U.S. Many of the specific causes of mobility impairments, as dealt with in the first part of this chapter, are considered together in this
table under such general categories as "other diseases of muscles, bones
and joints", or "impairment of back or spine". This is unfortunate as
it prevents us from assessing the extent to which these various diseases impair the mobility of those afflicted. However, we can still draw
some valuable conclusions from this data as it is presented.
Firstly, it is clear that arthritis and heart condition are the leading causes of severe mobility limitation, being each responsible for 20.5 per cent of the disabled population's "confinement to the house". Paralysis, complete or partial, is the next largest category, being re-sponsible for the confinement of 13.0% of the disabled population. Thus, these three categories combined account for 54% of the population con-fined to the house. Impairments of the back or spine contributed more to the less severe types of mobility impairment (i.e., "Has trouble getting around alone) than conditions of the circulatory system or con-ditions of the genitourinary system. The reverse was true for the more severe types of mobility limitation.
TABLE 1
PREVALENCE OF IMPATRMfENT BY
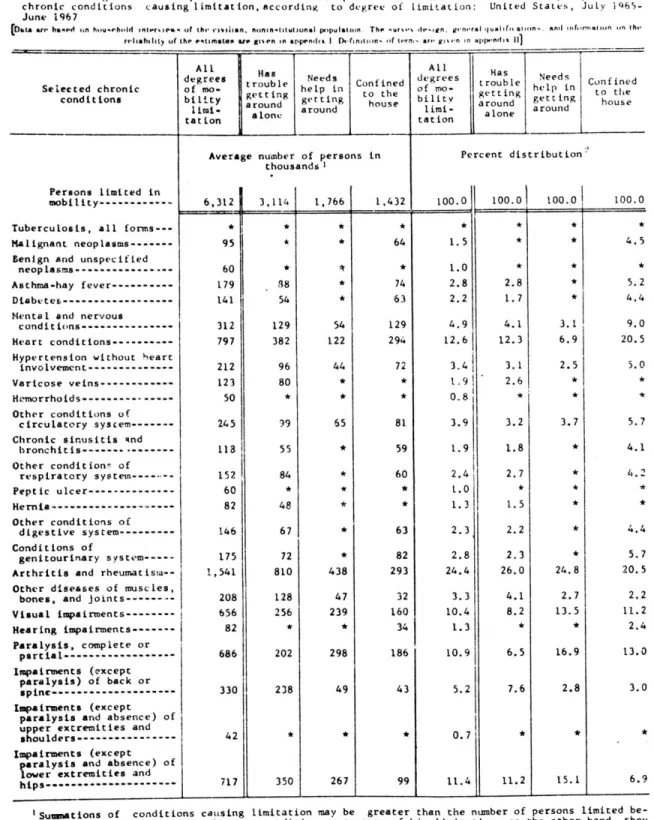
Table 1. Average number and percent distribution of persons with limitation of mobility by selected chronic conditions causing limitation,according to degree of limitation: United States, July 1065-June 1967
[Data are ha d on hu.ehtold intervc-A of the ci ilan, nonin-Mtutional population. The -arm den en. ge-n.ral qualt aoion. and informani n on the
relabihlty of the etimatel ae guten in appendaI i D finition. of term are gi n in app..ndix II)
All All Ha
degrees troble Needs Confined degrees S Needs
Selected chronic of ma- tting help in to the of mo- gtetting help in to thie conditions bility around getting house bility around getting house
limi- alon around limi- alone around house
tation a tation
Average number of persons in Percent distribution"
thousandsI Persons limited in
mobility--- 6,312 3,114 1,766 1,432 100.0 100.0 100.0 100.0
Tuberculosis, all forms * * * * * * * *
Malignant neoplasms --- 95 * * 64 1.5 * * 4.5
Benign and unspecified
neoplasms--- 60 * * 1.0 * * *
Asthma-hay fever--- 179 ,88 74 2.8 2.8 * 5.2
Diabetes--- 141 54 * 63 2.2 1.7 * 4.4
Mental and nervous
conditions--- 312 129 54 129 4.9 4.1 3.1 9.0
Heart conditions--- 797 382 122 294 12.6 12.3 6.9 20.5
Hypertension without heart
involvement--- 212 96 44 72 3.4 3.1 2.5 5.0
Varicose veins--- 123 80 * * 1.9 2.6 * *
Hemorrhoids--- 50 * * * 0.8 * * *
Other conditions of
circulatory system --- 245 99 65 81 3.9 3.2 3.7 5.7
Chronic sinusitis and
bronchitis--- 118 55 * 59 1.9 1.8 * 4.1 Other conditionn of respiratory system--- 152 84 * 60 2.4 2.7 * 4.2 Peptic ulcer--- 60 * * * l.0 * * * Hernia--- 82 48 * * 1.3 1.5 * * Other conditions of digestive system--- 146 67 * 63 2.3 2.2 * 4.4 Conditions of genitourinary system--- 175 72 * 82 2.8 2.3 * 5.7 Arthritis and rheumatisma-- 1,541 810 438 293 24.4 26.0 24.8 20.5
Other diseases of muscles,
bones, and joints--- 208 128 47 32 3.3 4.1 2.7 2.2 Visual impairments--- 656 256 239 160 10.4 8.2 13.5 11.2 Hearing impairments --- 82 * * 34 1.3 * * 2.4 Paralysis, complete or partial--- 686 202 298 186 10.9 6.5 16.9 13.0 Impairments (except paralysis) of back or spine--- 330 238 49 43 5.2 7.6 2.8 3.0 Impairments (except
paralysis and absence) of upper extremities and
shoulders--- 42--42 0.7
Impairments (except paralysis and absence) of lower extremities and
hips--- 717 350 267 99 11.4 11.2 15.1 6.9
t
Summations of conditions causing limitation may be greater than the number of persons limited be-cause a person can report more than one condition as a be-cause of his limitation; on the other hand, they
may be less because only selected conditions are shown.
-Percentages may add to more than 100 because a person can report more than one condition as a cause
of his limitation; on %he other hand, they may add to less than 100 because only selected conditions
are shown.