HAL Id: hal-00304631
https://hal.archives-ouvertes.fr/hal-00304631
Submitted on 1 Jan 2001HAL is a multi-disciplinary open access archive for the deposit and dissemination of sci-entific research documents, whether they are pub-lished or not. The documents may come from teaching and research institutions in France or abroad, or from public or private research centers.
L’archive ouverte pluridisciplinaire HAL, est destinée au dépôt et à la diffusion de documents scientifiques de niveau recherche, publiés ou non, émanant des établissements d’enseignement et de recherche français ou étrangers, des laboratoires publics ou privés.
Gothenburg Protocol on surface water chemistry using
the dynamic MAGIC model at acid sensitive sites in the
UK
A. Jenkins, J. M. Cullen
To cite this version:
A. Jenkins, J. M. Cullen. An Assessment of the potential impact of the Gothenburg Protocol on surface water chemistry using the dynamic MAGIC model at acid sensitive sites in the UK. Hydrology and Earth System Sciences Discussions, European Geosciences Union, 2001, 5 (3), pp.529-542. �hal-00304631�
An Assessment of the potential impact of the Gothenburg
Protocol on surface water chemistry using the dynamic MAGIC
model at acid sensitive sites in the UK
A. Jenkins and J.M. Cullen
Centre for Ecology and Hydrology, Wallingford, OX10 8BB, UK
Email for corresponding author: [email protected]
Abstract
The MAGIC model has been systematically calibrated to 12 sites in the UK, which form part of the UK Acid Waters Monitoring Network, using best available data. The model successfully simulates observed changes in major ions and acid neutralising capacity over the period 1988 to 2000. Predictions for the future are made assuming no further emission reductions from present day (constant deposition at current level) compared to reduced sulphur and nitrogen emission agreed under the Gothenburg Protocol (reduced sulphur dioxide emission by c.80%, nitrogen oxides by c.45% and ammonia by 20% by 2010). In addition, uncertainty in our understanding of future nitrogen dynamics is assessed using ‘best’ and ‘worst’ cases of nitrogen leaching in the model. The results clearly indicate the need to achieve further emission reductions in sulphur and nitrogen beyond present day levels to prevent continued surface water acidification. The predictions further indicate that if the emission reductions agreed under the Gothenburg Protocol are achieved by 2010 this will promote a recovery in acid neutralising capacity by 2020 at all sites. Differences between ‘best’ and ‘worst’ case nitrate leaching are relatively small, emphasising the need to achieve the sulphur reductions in the shorter term. In the longer term, beyond 2020, increased nitrogen leaching under the ‘worst case’ leading to further acidification is likely indicating a need for further reduction of nitrogen emissions.
Keywords: acidification, recovery, model, Gothenburg Protocol, nitrogen
Introduction
Soils and surface waters in areas considered geologically sensitive to acidic deposition have become increasingly acidified since the onset of major industrialisation in the mid-nineteenth century (Haines, 1986) as a result of anthropogenic sulphur (S) and nitrogen (N) emissions. Reported impacts include forest decline (Smith, 1974), acidification of soils and surface waters (Likens et al., 1979) and loss or impoverishment of freshwater biota (Muniz, 1991).
Recognition of the continental scale of the problem and the requirement for international solutions prompted the establishment, in 1979, of the Convention on Long Range Transboundary Air Pollution (LRTAP) under the auspices of the United Nations Economic Commission for Europe (UN-ECE). The Convention adopted its first Protocol in 1985, which set targets of reducing national emissions of S by 30% by 1993, based on a datum of 1980. Further legislation was also passed by the European Community in 1986, the Large Combustion Plants Directive, whereby S
emissions from large power stations were to be reduced by 60% by 2003, based on a datum of 1980. These approaches were not targeted at protecting the most severely acidified regions.
The Protocol on Further Reductions of Sulphur Emissions (Second S Protocol) signed in 1994 agreed a reduction in S emission for the UK of about 70% by 2005 and 80% by 2010 (based on 1980 levels). This Protocol used for the first time, an “effects based” strategy, the “critical loads” approach (Posch et al., 1997) aimed at reducing emissions to a level that does not cause harm to the ecosystem in the long term. This utilises the understanding of emission transport and deposition at a regional scale coupled with the sensitivity of ecosystems as defined by their calculated critical loads. Critical loads, for both soils and surface-waters, are based upon the empirical link between present day soil and water chemistry and an assumption of steady-state; that is, they are long term and not dynamic.
eutrophication and ground-level ozone was adopted in Gothenburg in 1999. This recognised the interactive effects of four key atmospheric pollutants, S, nitrogen oxides (NOx), volatile organic compounds and ammonia (NH3), and sets emission ceilings. The ceilings to be achieved by each country by 2010 were negotiated on the basis of pollution affects, via critical loads assessment and abatement options, via integrated assessment modelling, to optimise and target the emission reductions across Europe. When fully implemented, Europe’s S emissions will be reduced by at least 63%, NOx by 41% and NH3 by 17% compared to the levels in 1990 (already substantially reduced from the 1980 baseline used in earlier agreements). In Europe, it is estimated that this will lead to the area of exceedance of critical load for acidity being reduced from 93 million ha in 1990 to 15 million ha in 2010 and exceedance of critical loads for eutrophication falling from 165 to 108 million ha (UN-ECE, 2000). In the UK, implementation of the Protocol will involve reduction in S emissions to c.20%, NOx to
c.55% and NH3 to c.80% of 1990 levels.
The static models for critical loads on which these agreements have been based, however, neglect the time component of acidification. This precludes processes, namely sulphate (SO4) adsorption and short term soil buffering by cation exchange (Reuss and Johnson, 1985), that act to delay both the onset of acidification and recovery (Cosby et al., 1986; Hornberger et al., 1986). Dynamic models, on the other hand, offer the opportunity to determine the deposition reduction required to achieve a given water chemistry target (for example, acid neutralising capacity (ANC) of zero µeq l-1 to ‘protect’ brown trout (Salmotrutta))
within a given time frame). These models, therefore, recognise that surface water acidity may not decrease for many years following the decrease of the deposition flux below the steady-state critical load and so the area where critical load is not exceeded does not equate to the area where the ecosystem has ‘recovered’ except over a very long timescale (possibly hundreds of years or more). Dynamic models can identify this time lag and assess the chemistry expected in areas where the critical load is still exceeded, or indeed those areas where the critical load is no longer exceeded. In this way, dynamic models can be used to predict the future consequences of policy decisions undertaken today. Dynamic modelling assessments undertaken at regional scale have been widely reported in Europe (e.g. Cosby and Wright, 1998; De Vries et al., 1989; Forsius et
al., 1998; Jenkins et al., 1998; Warfvinge et al., 1992; Wright et al., 1994).
The results of an application of a process based model, the Model of Acidification of Groundwater In Catchments (MAGIC, Cosby et al., 1985a,b, 2001), describing long term
changes in soil and surface water acidification status at the catchment scale are presented here. The model is applied to 13 of the sites in the UK Acid Waters Monitoring Network (AWMN, Patrick et al., 1991), for which suitable data is available, to predict the potential recovery under the latest agreement controlling S and N emissions throughout Europe. The MAGIC model was calibrated previously to the UK AWMN sites (Jenkins et al., 1997) and the calibrated suite of models was then used to assess changes in surface water chemistry to 2041 in response to the Second S Protocol. For this study, the model has been recalibrated using a base year of 1988, tested against observations to 2000, thereby incorporating observed reductions in S deposition since 1995 (Fowler and Smith, 2000) and then used to assess the changes in surface water chemistry in response to the predicted emissions under the Gothenburg Protocol to 2020. In addition, ‘best’ and ‘worst’ cases of future catchment N retention are also assessed using a recently modified version of N dynamics in the model (Cosby et al., 2001).
The MAGIC model
MAGIC is a process-oriented, intermediate-complexity dynamic model for the long term reconstruction and future prediction of soil and surface water acidification at the catchment scale (Cosby et al., 1985a,b). The model consists of (1) soil-soil solution equilibria equations in which the chemical composition of the soil solution is assumed to be governed by simultaneous reactions involving SO4 adsorption, cation exchange and dissolution and speciation of inorganic and organic carbon (C), and (2) mass balance equations in which the fluxes of major ions to and from soil and surface water are assumed to be governed by atmospheric inputs, mineral weathering, net uptake by biomass and loss to streamwater.
MAGIC uses a lumped parameter approach to (1) aggregate the complex chemical and biological processes active at the catchment scale into a few readily described processes, and (2) represent the spatial heterogeneity of soil properties throughout the catchment. Dynamic simulation of soil and surface water chemistry is achieved by coupling the equilibria equations with the dynamic mass balance equations for each of the major cations: calcium (Ca), magnesium (Mg), sodium (Na), potassium (K) and anions chloride (Cl), SO4 and nitrate (NO3). Sulphate has an adsorbed phase in the soil compartment of the model which is concentration dependent and described by a Langmuir isotherm (Hornberger et al., 1986). The MAGIC model has been extensively tested on catchments in the USA (Cosby
et al., 1986), Scandinavia (Wright et al., 1994) and the UK
In the original formulation of MAGIC (MAGIC5) there were no process-based mechanisms for N retention in soils and first order uptake coefficients were calibrated to represent catchment immobilisation such that input matched output. These uptake coefficients were then assumed to remain constant into the future. This can be assumed to represent a ‘best’ case of N leakage into the future since catchments that do not currently leak N will not leak in the future as N deposition is reduced.
In the light of research reported in the 1990s (NITREX), however, it was clear that the potential for soils to continue immobilising or retaining N at the current level may decline as soils become enriched in N relative to C (Emmett et al., 1998; Gundersen et al., 1998; Wright and van Breemen, 1995). This process of N saturation and breakthrough has been incorporated into MAGIC (MAGIC7: Cosby et al., 2001) and represents a ‘worst case’ of future N retention since NO3 leaching can increase despite reduction in N deposition. The new N dynamics included in MAGIC7 are based conceptually on an empirical model described by Gundersen et al. (1998) whereby the soil C/N controls the amount of incoming inorganic N which is leached. MAGIC7 simulates two species of inorganic N in soil and surface waters: NO3 and ammonium (NH4). The major processes affecting these ions in soils have been incorporated explicitly or implicitly into the model: atmospheric deposition, nitrification, denitrification, mineralisation, uptake by plants, immobilisation into soil organic matter and export in discharge water. The inclusion of dynamic equations for N cycling within the model required the introduction of a soil organic matter compartment for each soil compartment being simulated. As with the acid/base components of MAGIC, the organic matter compartment is aggregated in space and time.
In MAGIC7, immobilisation of inorganic N into the soil organic matter is controlled by the C/N ratio of the soil organic compartment. If the C/N ratio is greater than a given threshold value (CNUP), then complete immobilisation of incoming inorganic N occurs at that time step with no net leaching. If the C/N ratio is below a lower threshold value (CNLO), no immobilisation of inorganic N occurs and all incoming N is leached to the surface water. The percentage of inorganic N immobilised is assumed to vary linearly from 100% to 0% as the C/N ratio of the organic matter compartment declines from CNUP to CNLO. The inorganic N immobilised from soil solution is added to the organic N in the organic matter compartment, lowering the C/N ratio and causing a decline in the C/N ratio as N from deposition is accumulated. As the declining C/N crosses the upper threshold, leaching of inorganic N begins and gradually increases as C/N declines further (Jenkins et al., 2001). The
C pool in the soil organic compartment is assumed to remain constant in time and no account is taken of the potential for increased growth as a result of an increased pool of N which would tend to reduce N leakage.
Data sources and model calibration
The UK AWMN was established in 1988 to monitor surface water chemistry at a range of sites across the UK (Fig. 1). The network encompasses all upland regions of the UK, spanning a gradient of acidic deposition and incorporating regional variations in geological sensitivity and land-use. The frequency of sampling is monthly at stream sites and quarterly at lake sites; analysis is undertaken for a full suite of chemical determinands (Monteith and Evans, 2000). The most acidified sites in the UK AWMN experience high levels of critical load exceedance (Harriman et al., 1995) and are characterised by poor fish populations as a result (Patrick
et al., 1995). Most sites have highest NO3 concentrations in surface waters during the winter but at some, elevated summer concentrations suggest that reduced retention of N in the terrestrial catchment is contributing to enhanced acidification (Jenkins et al., 1996). It remains to be determined whether this reflects N saturation according to the classification of Aber et al. (1989) or reflects variation in other system driving variables such as climate.
Since the application of MAGIC7 requires spatially aggregated information describing the soil C and N pools, only 13 sites of the UK AWMN are used here as these data are not currently available for all sites (Fig. 1, Table 1). Surface water chemistry characteristics of the sites used in this analysis spans a range of acid status, however, with mean pH from 5.2 to 6.4 (Table 2). Data required for the MAGIC calibration procedure include mean annual water chemistry characteristics, estimates of deposition chemistry for all major cations and anions, catchment-scale lumped soil characteristics for exchangeable base cation fractions, depth, cation exchange capacity and bulk density, and mean surface water chemistry.
Calibration of the model to ‘present day’ requires an estimate of mean annual chemistry. From the recent analysis of the AWMN chemistry data (Monteith and Evans, 2000), the recent trends towards decreased non-marine sulphate (xSO4) preclude the use of mean data for the whole monitoring period as a calibration target. Consequently, the mean of the 1988 – 1993 period, when no significant trends were observed, was used for calibration.
Wet deposition of all major ions is routinely measured on a weekly basis at a network of sites across the UK, formally the UK Acid Deposition Monitoring Network (ADMN; RGAR, 1990) and these are either co-located with those of
Table 1. The UKAWMN sites used in this study. Critical load exceedance (keq ha-1 yr-1) related to the 10 km square in which
the site is located and is for 2010 under the Gothenburg Protocol predicted deposition (Curtis, 2001). The FAB steady-state model is used to calculate the critical load. The number in parentheses relates to the requirement for further reducing N or S to achieve the critical load, as defined by the critical load function (3 = reduce both S and N; 4 = reduce N and then S or N; 5 = reduce S or N).
Site Site Name Grid Ref. Area % Main Critical
(ha) Forestry Planting Load
Dates Exceedance
1 Loch Coire na Arr NG 808422 897 <1 - 0.11 (5)
2 Allt a’Mharcaidh NH 881045 998 2 -
-3 Allt na Coire nan Con NM 793688 790 42 1970
-4 Lochnagar NO 252859 92 0 - 0.42 (4)
5 Loch Chon NN 421051 1470 44 1951-1968 0.71 (4)
6 Loch Tinker NN 445068 112 0 - 0.71 (4)
7 Round Loch of Glenhead NX 445068 95 0 - 1.31 (3)
8 Loch Grannoch NX 542700 1287 70 1962, 1998 0.83 (4) 9 Dargall Lane NX 449786 210 0 - -15 Llyn Llagi SH 649483 157 0 - 0.73 (4) 16 Llyn Cwm Mynach SH 678238 152 55 1967-1973 0.45 (4) 17 Afon Hafren SN 844876 358 50 1949, 1964 1.09 (4) 18 Afon Gwy SN 824854 210 0 - 1.09 (4)
Fig. 1. The sites in the UK AWMN used in this study. Site numbers
refer to Table 1
Table 2. Observed (mean 1988-93) and simulated (1988)
surface water chemistry characteristics at the sites modelled. Units are µeq l-1
Site Ca Calib SO4 Calib Cl Calib
Obs Obs Obs
1 42 43 41 42 274 275 2 42 43 44 49 109 115 3 59 61 62 63 284 321 4 29 30 61 64 87 87 5 76 78 72 74 223 226 6 86 87 53 53 163 163 7 35 36 68 71 224 223 8 52 52 98 102 284 282 9 52 55 82 86 208 208 15 67 66 62 64 222 224 16 95 98 88 91 343 342 17 49 49 67 67 171 171 18 48 52 83 87 222 226
the AWMN or are in close proximity. The most suitable wet deposition collector for each site was determined on the basis of proximity, altitude and sea-salt characteristics (Jenkins
et al., 1997). Dry deposition is not measured directly but is
assumed to represent the difference in input–output flux for SO4 and Cl which are assumed to be conservative at each time step (see later). Dry deposition of base cations is estimated on the basis of marine ratios with Cl. For N, dry deposition represents a considerable fraction of the total N deposition flux but this cannot be estimated on the basis of input-output fluxes because of the high level of retention within the catchment. For N species, the mean UK 20 × 20 km deposition data (Fowler and Smith, 2000) for the grid containing each catchment was assumed to represent total deposition and the dry fraction was calculated as the difference between the total deposition estimate and the observed flux from the nearby wet deposition collector. The historical deposition sequences for SO4, NO3 and NH4 are estimated by scaling currently observed deposition to reconstructions of S emissions (Warren Spring Laboratory, 1983; 1987) and N emissions (Wright et al., 1998) for the UK.
Lumped soil characteristics (Table 3) were derived from mapped information and catchment values were based upon depth and spatial weighting across the catchment to aggregate the heterogeneity observed in catchment soils (Ferrier et al., 1995; Jenkins et al., 1997). Estimation of the weighted catchment soil C and N pools (Table 3) were based upon a combination of mapped information and, where possible, new soil samples collected from the upper organic layers within the catchments (Helliwell et al., 1998).
At forested sites, management information, including felling and planting operations were determined to 2000. Evapotranspiration is assumed to vary between 10% for a moorland catchment and 20% for a fully forested catchment, scaled linearly relative to the percentage forestry (Jenkins and Cosby, 1989; Robson et al., 1991). Net uptake of ions into tree biomass is modelled relative to the age and spatial coverage of forest within the catchment (Ferrier et al., 1995) to account for the changing nutritional requirement of older trees relative to younger trees and for the increased recycling of nutrients in litter as the trees mature (Miller, 1984). Enhanced deposition to the forest canopy is also scaled by adjusting the dry deposition of S and sea-salts in proportion to the percentage mature forest cover in the catchment at the calibrationn stage (see later). Future predictions assume felling of each stand at 50 years age and immediate replanting.
Model calibration procedure
The calibration of MAGIC at each site is carried out in a sequential manner. Firstly, surface water concentrations of Cl and SO4 are simulated by assuming that Cl and SO4 fluxes in surface water are in steady-state with respect to atmospheric inputs since Cl in the model has no adsorbed phase and SO4 adsorption is assumed to be low and currently at maximum capacity. Wet deposition of Cl and SO4 for the period 1988–1993 was obtained from the nearest site in the ADMN and dry deposition of S was added to match observed surface water SO4 concentrations for the same time period for each site (Jenkins et al., 1997). For Cl, dry
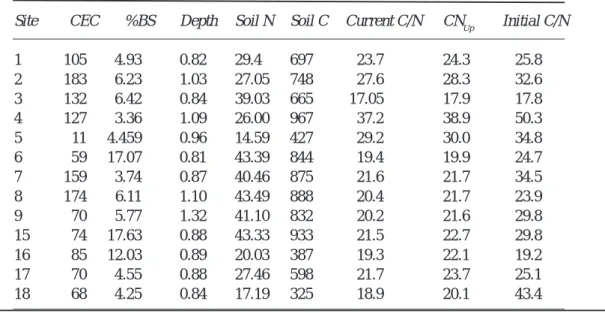
Table 3. Soil characteristics used in the model. Units are meq m-3 for CEC, % for base
saturation (BS), m for depth and mol m-3 for C and N.
Site CEC %BS Depth Soil N Soil C Current C/N CNUp Initial C/N
1 105 4.93 0.82 29.4 697 23.7 24.3 25.8 2 183 6.23 1.03 27.05 748 27.6 28.3 32.6 3 132 6.42 0.84 39.03 665 17.05 17.9 17.8 4 127 3.36 1.09 26.00 967 37.2 38.9 50.3 5 11 4.459 0.96 14.59 427 29.2 30.0 34.8 6 59 17.07 0.81 43.39 844 19.4 19.9 24.7 7 159 3.74 0.87 40.46 875 21.6 21.7 34.5 8 174 6.11 1.10 43.49 888 20.4 21.7 23.9 9 70 5.77 1.32 41.10 832 20.2 21.6 29.8 15 74 17.63 0.88 43.33 933 21.5 22.7 29.8 16 85 12.03 0.89 20.03 387 19.3 22.1 19.2 17 70 4.55 0.88 27.46 598 21.7 23.7 25.1 18 68 4.25 0.84 17.19 325 18.9 20.1 43.4
deposition was added to match observed surface water concentrations and Ca, Mg, Na and K were added in line with marine ratios.
Secondly, for MAGIC5 (‘best case’), the NO3 and NH4 concentrations are calibrated by adjusting first-order uptake functions to match observed surface water concentrations. For MAGIC7 (‘worst case’) N calibration, the present day soil organic N pool and mean surface water NO3 concentration are the calibration targets (Table 3). Soil organic C pool is assumed to remain constant through time and the total N deposition flux to present day is described by the present N deposition fluxes and the historical deposition sequences at each site. Nitrification is assumed to be complete at each timestep. The relationship between C/N ratio of the soil organic pool and the fraction of incoming inorganic N leakage from the soil that describes net immobilisation in the model is assumed to be consistent with the empirical data presented by Gundersen et al. (1998) at all sites. The historical N pool and the position of CNUP (see earlier) are then adjusted to match the present day observed soil N pool and stream NO3 concentration.
Having calibrated the surface water strong acid anion concentrations (SO4, Cl and NO3) the final step is to calibrate the base cations. This requires fitting the results of long-term model simulations to observed soil and water base cation data (target variables). The target variables consist of surface water concentrations of Ca, Mg, Na, K and soil exchangeable fractions of Ca, Mg, Na and K (catchment weighted average). The target variables thus comprise a vector of measured values, all of which must be reproduced by the model if a calibration is to be successful. The use of multiple, simultaneous targets in an optimisation procedure provides robust constraints on model calibration (Cosby et
al., 1986). Those physico-chemical soil and surface water
characteristics measured in the field are considered “fixed” parameters in the model and the measurements are used directly in the calibration procedure. Base cation weathering rates and base cation selectivity coefficients for the soils are not directly measurable and are adjusted to match the soil and surface water base cation targets.
The calibrations were performed on simulations run from 1848 to 1988 using the mean of the 1988-93 surface water chemistry to define the base cation targets. This removes the influence of annual ‘extremes’ of some ions during individual years on the model calibration. After each historical simulation, the model variables in 1988 are compared to the observed mean data for 1988-1993, the adjustable parameters are modified as necessary to improve the fit and the historical simulation is re-run. The procedure is repeated until no further improvement in the fit is achieved.
From 1988 to 2000, annual deposition fluxes from the appropriate ADMN collector for each site are used to drive the model. In each year, Cl and SO4 are adjusted to account for dry and sea-salt inputs using the same factor as calculated for the mean 1988–1993 data used in the calibration. Dry deposition of N is similarly added by scaling the observed annual wet deposition with the mean total deposition from the UK 20 × 20 km database.
The impact of the Gothenburg Protocol emission reductions on UK S and N emissions by the year 2010, together with the expected reduction in European emissions, is assessed using an atmospheric transport/deposition model to translate reduction in emission to reductions in deposition flux at each of the UK AWMN sites. The Hull Acid Rain Model (HARM; Metcalfe and Whyatt, 1995) is a source-receptor Lagrangian model linking emissions to deposition for all major point sources in the UK; the model also uses European inputs from the EMEP grid (250 × 250 km). The model incorporates the chemistry of major ions that contribute to acidic deposition, namely SO2, NOx, NHx and HCl. The model is driven by a simple representation of meteorology and operates at a spatial resolution of 20 × 20 km.
Future forecasts were run for two scenarios; the Gothenburg Protocol and constant deposition at present level. Future deposition estimates for S and N for the Gothenburg Protocol were derived from HARM model outputs. Deposition reduction factors for use in MAGIC were then derived from HARM as the ratio of HARM 2010: HARM 1995. In addition, two different model structures were used to describe future N dynamics under the Gothenburg Protocol deposition reduction (e.g. Jenkins et
al., 2001). The best case assumes that the current retention
of N will continue into the future as a proportion of input (MAGIC5). The worst case utilises a finite store of N within the soil and an empirical relationship to describe the proportion of N leakage in relation to the store size and the deposition flux (MAGIC7) as described earlier. The size of this store at each site is determined from the observed soil N, C and depth characteristics.
Results
The calibrated model successfully matches mean 1988-1992 major ion chemistry (Table 2) and pH (Fig. 2) at all sites and there is no systematic bias in the calibrated determinands. Comparison with observed ANC (not calibrated) also shows broad consistency from site to site (Fig. 2). Inconsistencies between observed and simulated data at individual sites result mainly from the uncertainty incorporated in the calibration of the base cations, namely
the “windows” used to describe the soil and surface water base cation concentration target. Nevertheless, the observed relationship between pH and ANC across the suite of sites (Fig. 2) is closely matched by the model simulations.
For model testing, mean annual deposition has been used to drive the model from 1988–1999. The comparison of simulated ANC trends to observed annual mean data through that period (Fig.3) shows that the model is capable of following observed trends at most sites although it fails to
capture the extreme values. This is probably due to the deposition estimation to the sites which is based upon the nearest wet deposition collector. Since all of the sites are located in mountainous areas and deposition is known to vary sharply with altitude, it is likely that deposition to each catchment is over or under-estimated. In addition, observed annual mean water chemistry is based on monthly samples for streams and quarterly for lakes and it is possible that the mean values, therefore, do not reflect adequately the annual chemistry. Comparison of the simulated and observed mean ANC for two years at the end of the test period (1998–1999) provides an encouraging match (Fig. 4) since at all sites the observed and simulated ANC is within +/- 10 ueq l-1, except
at Loch Tinker (site 6) and Loch Grannoch (site 8). Both of these sites are characterised by very high mean ANC in 1999 (Fig. 3) which the model is unable to reproduce given the observed deposition in that year.
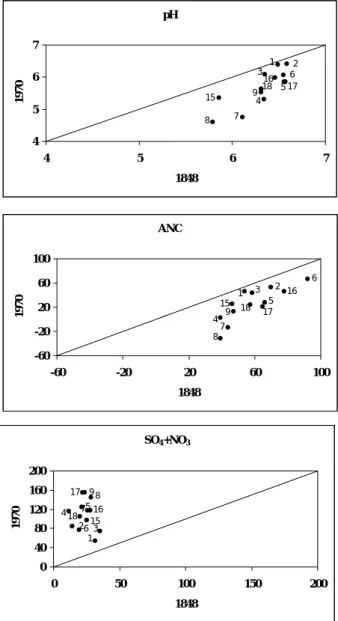
The historical simulations from background (1848) to 1970, representing approximately the peak of S deposition across the UK, show the degree of acidification that is predicted to have occurred (Fig. 5). Sulphate concentrations in surface waters have increased over the period although not uniformly, but reflecting the location of the site in relation to emission sources (Fig. 5). For example, at the two sites in NW Scotland (Loch Coire nan Arr – site 1 and Loch Coire nan Con – site 3) SO4 concentrations have increased much less than in SW Scotland (Loch Grannoch – site 8 and Dargal Lane – site 9). This pattern, however, does not directly reflect location in relation to emission sources because SO4 deposition is also increased by afforestation. Sites with significant conifer afforestation are Loch Coire nan Con (site 3), Loch Chon (site 5), Loch Grannoch (site 8), Llyn cwm Mynach (site 16) and Afon Hafren (site 18).
The historical acidification is demonstrated by the simulated changes in surface water pH and ANC (Fig. 5). In general, the biggest decrease in ANC and pH is predicted to have occurred at those sites with the lowest mean initial pH and ANC and, hence, the biggest sensitivity to acidic inputs. All sites, however, have acidified to some extent, except for the reference site in NW Scotland (Loch Coire nan Arr – site 1). Two other sites in N. Scotland (Allt a’ Mharcaidh – site 2 and Allt Na Coire Nan Con – site 3) currently receive relatively low levels of S deposition and show little historical acidification.
Since the 1970s, SO4 concentrations in surface waters have decreased (Fig. 6). This decrease is in line with the c.60% reduction in UK SO2 emissions since 1970 and the c.70% reduction in European emissions (Ferrier et al., 2001) and decreases in S deposition across the UK (Fowler and Smith, 2000).
Fig. 2. Observed and simulated ANC (top) and pH (middle)
characteristics at each site and the observed (solid diamonds) against modelled (open diamonds) pH v ANC relationship (bottom)
-40 -20 0 20 40 60 80 -40 -20 0 20 40 60 80
Observed ANC (µeq l-1)
Simulated ANC (µeq l
-1 ) 4 5 6 7 4 4.5 5 5.5 6 6.5 7 Observed pH Simulated p H 4 5 6 7 -40 -20 0 20 40 60 80 100 ANC (µeq l-1) pH
Fig. 3. Comparison of simulated (line) and
observed (dots) mean annual ANC (µeq l-1) at each of the sites for the period 1988–2000. Model simulations use observed deposition
data L o c h C o ir e n a n A r r - s ite 1 20 30 40 50 60 70 80 198 5 198 6 198 7 198 8 198 9 199 0 199 1 199 2 199 3 199 4 199 5 199 6 199 7 199 8 199 9 200 0 AN C ( u e q l -1) A llt a M h ar caid h - s ite 2 40 50 60 70 80 90 198 5 198 7 198 9 199 1 199 3 199 5 199 7 199 9 AN C ( u e q l -1) A llt n a C o ir e n an C o n - s ite 3 0 10 20 30 40 50 60 70 80 198 5 198 6 198 7 198 8 198 9 199 0 199 1 199 2 199 3 199 4 199 5 199 6 199 7 199 8 199 9 200 0 AN C ( u e q l -1) L o c h n ag ar - s ite 4 -10 -5 0 5 10 15 20 25 198 5 198 6 198 7 198 8 198 9 199 0 199 1 199 2 199 3 199 4 199 5 199 6 199 7 199 8 199 9 200 0 AN C ( u e q l -1) L o c h C h o n A NC - s ite 5 0 10 20 30 40 50 60 70 198 5 198 7 198 9 199 1 199 3 199 5 199 7 199 9 AN C ( u e q l -1) L o c h T in k e r - s ite 6 50 60 70 80 90 100 110 120 130 140 198 5 198 6 198 7 198 8 198 9 199 0 199 1 199 2 199 3 199 4 199 5 199 6 199 7 199 8 199 9 200 0 AN C ( u e q l -1) Dar g a ll L an e - s ite 9 0 5 10 15 20 25 30 198 5 198 7 198 9 199 1 199 3 199 5 199 7 199 9 AN C ( u e q l -1) L ly n L lag i - s it e 15 0 10 20 30 40 198 5 198 7 198 9 199 1 199 3 199 5 199 7 199 9 AN C ( u e q l -1) L ly n C w m M y n a ch - s ite 16 -20 0 20 40 60 198 5 198 7 198 9 199 1 199 3 199 5 199 7 199 9 AN C ( u e q l -1) A fo n Haf r e n - s it e 17 -20 0 20 40 60 198 5 198 7 198 9 199 1 199 3 199 5 199 7 199 9 AN C ( u e q l -1) A fo n Gw y - s ite 18 0 10 20 30 40 50 60 70 198 5 198 7 198 9 199 1 199 3 199 5 199 7 199 9 AN C ( u e q l -1)
Despite substantial reduction in SO4 concentration, however, few sites are predicted to have increased ANC and pH over the period (Fig. 6). ANC is predicted to have increased slightly at Round Loch of Glenhead (site 7) and Lochnagar (site 4) and this is in line with observations from 1988-2000 (Evans and Monteith, 2001). Many of the sites, on the other hand, are predicted to have further acidified since 1970 but all of these have undergone significant afforestation. The interpretation of changes at two points in time also masks the fact that some recovery in ANC is predicted to have occurred in recent years.
Future predictions to 2020 assume two different deposition
Fig. 4. Comparison of simulated and observed 1998-1999 mean
ANC (µeq l-1)
Fig. 5. Simulated changes in surface water SO4 + NO3 (µeq l-1), ANC (µeq l-1) and pH between 1848 and 1970
Fig. 6. Simulated changes in surface water SO4 + NO3 (µeq l
-1),
ANC (µeq l-1) and pH between 1970 and 2000
pH 16 3 6 5 17 1 2 18 4 9 15 7 8 4 5 6 7 4 5 6 7 1848 1970 ANC 8 7 15 9 4 18 2 1 17 5 6 3 16 -60 -20 20 60 100 -60 -20 20 60 100 1848 1970 SO4+NO3 8 7 15 9 4 18 2 1 17 5 6 3 16 0 40 80 120 160 200 0 50 100 150 200 1848 1970 pH 16 3 6 5 17 1 2 18 4 9 15 7 8 4 5 6 7 4 5 6 7 1970 2000 ANC 8 7 15 9 4 18 2 1 17 5 6 3 16 -60 -20 20 60 100 -60 -10 40 90 1970 2000 SO4+NO3 8 7 15 184 9 2 1 17 5 6 3 16 0 50 100 150 200 0 50 100 150 200 1970 2000 5 16 7 17 4 918 6 2 1 3 15 8 -60 -20 20 60 100 -60 -20 20 60 100
Observed ANC (µeq l-1)
Simulated ANC (µeq l
scenarios for S; constant deposition at the current level and reduced deposition as predicted by HARM in response to the Gothenburg Protocol. The reductions are assumed to be achieved by the year 2010. These changes in S deposition are reflected in reduced SO4 concentrations in surface waters at all sites (Fig. 7), again with relatively smaller reductions in those areas currently receiving low deposition. Under constant future S deposition, changes in SO4 concentrations are the result of the assumptions in the model regarding re-afforestation. The two different models of N dynamics lead to different surface water NO3 concentrations (Fig. 8). The deviation in ANC between ‘best’ and ‘worst’ cases is entirely the result of N leaching (Fig. 9). For constant deposition at current levels, only the ‘worst case’ N leaching scenario is presented (Fig. 8) on the basis that this represents the highest concentrations that can occur. Assuming that N emission
reductions are achieved in line with those agreed under the Gothenburg Protocol, however, future NO3 concentrations are predicted to increase by 2020 at all sites, relative to present day, but to remain lower than under constant deposition. Only under the ‘best case’ of N retention are NO3 concentrations predicted to be lower in future than currently observed, at all sites.
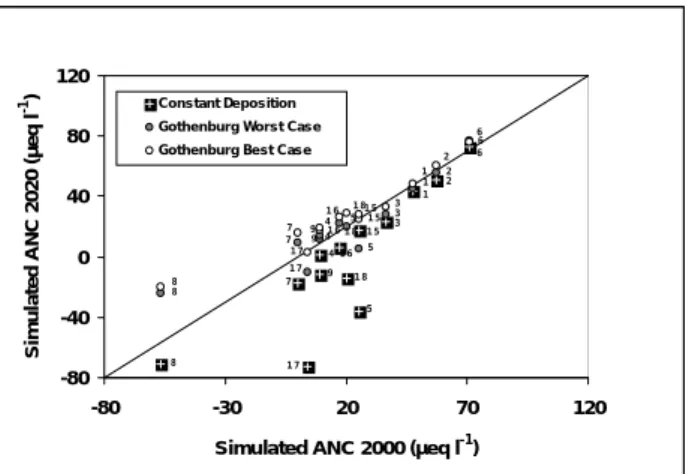
The assumptions made regarding N leaching in the model and the constant and reduced deposition scenarios for N and S promote a wide range of ANC responses both within and between sites (Fig. 9). At the higher ANC, less sensitive sites, the predicted ANC concentration shows little change under all three scenarios. At these sites, soil buffering processes (ion exchange) dominate and lower concentrations of acid anions are accompanied by decreased concentrations of base cations and, hence, little change in ANC or pH (high F-factor). At the lower ANC, acid sensitive sites, a substantial further decrease in ANC is predicted for the constant deposition scenario whereas a modest recovery is predicted under the Gothenburg Protocol scenario. In all cases, the predicted ANC in 2020 under ‘best’, and ‘worst’ case N leaching is rather similar.
Discussion and conclusions
The simulations for the whole suite of sites clearly demonstrate the benefit of achieving the emission reductions in both S and N agreed under the Gothenburg Protocol over making no further emission reductions. Under constant deposition and assuming the worst case of N leakage, NO3 concentrations increase (Fig. 8), SO4 concentrations remain stable (Fig. 7), although with some variation at the forested sites as the canopy growth influences dry deposition, and
Fig. 7. Simulated changes in surface water SO4 concentrations (µeq l-1) under constant deposition and Gothenburg Protocol
scenarios, 2000-2020
Fig. 8. Simulated changes in surface water NO3 concentrations (µeq l-1) under constant deposition assuming ‘worst’ case NO
3 leaching and under the Gothenburg Protocol assuming both ‘best’
and ‘worst’ case NO3 leaching, 2000-2020
Fig. 9. Simulated changes in surface water ANC concentrations
(µeq l-1) under constant deposition assuming ‘worst’ case ANC leaching and under the Gothenburg Protocol assuming both ‘best’
and ‘worst’ case ANC leaching, 2000-2020
1 5 6 4 3 1 2 1 7 9 1 8 7 5 1 6 8 1 7 9 1 6 5 7 8 1 8 3 1 5 6 4 1 2 0 20 40 60 80 100 120 0 20 40 60 80 100 120 Simulated SO4 2000 (µeq l -1 ) Simulated SO 4 2020 (µeq l
-1) Constant Depos ition Gothenburg Bes t Case
9 1 5 3 1 6 2 1 6 1 7 8 4 1 8 5 7 9 1 5 3 1 6 2 7 5 1 8 4 8 1 7 1 6 9 26 1 3 7 5 1 8 1 5 4 1 7 8 1 6 0 20 40 60 0 5 10 15 20 Simulated NO3 2000 (µeq l -1 ) Simulated NO 3 2020 (µeq l
-1) Constant Depos ition Gothenburg Worst Cas e Gothenburg Best Case
8 1 7 7 4 5 1 8 6 9 1 5 1 2 3 1 6 8 6 7 5 1 2 1 5 1 8 9 3 4 1 7 1 6 8 6 2 1 1 5 1 8 9 3 5 4 7 1 7 1 6 -80 -40 0 40 80 120 -80 -30 20 70 120
Simulated ANC 2000 (µeq l-1)
Simulated ANC 2020 (µeq l
-1) Cons tant De pos ition
Gothenburg Wors t Cas e Gothenburg Be st Cas e
ANC (Fig. 9) decreases further at all sites. It is clear, therefore, that current levels of S and N emission, whilst substantially reduced from their peak levels in the mid-1970s, must be further reduced to protect freshwaters from further acidification.
In the UK, the role of plantation forestry has further complicated the acidification and reversibility process (Nisbet et al., 1995). A UK Forestry Commission and Department of the Environment workshop in 1990 agreed that forestry had a minimal impact on acidification status in areas of low acidic deposition. In areas of high acidic deposition, however, forests may contribute to enhanced acidification, largely through their ability to filter atmospheric pollutants and thereby enhance inputs of acidic oxides (DOE and Forestry Commission, 1991). The model predictions indicate that significant further reductions in N and S are required to promote recovery of surface waters in forested catchments.
Under the Gothenburg Protocol, SO4 concentrations decrease significantly at all sites (Fig. 7). This promotes a general improvement in ANC which, as expected, is most marked at sites with the lowest ANC (Fig. 9). This implies that the agreed levels of S emission go beyond prevention of future acidification to promote a recovery towards pre-acidification conditions.
Furthermore, the ‘best’ and ‘worst’ cases for N leaching have a less significant impact on predicted ANC than the agreed S reductions (Fig. 9). This emphasises the importance of actually achieving the agreed S emission reductions by 2010 to promote chemical recovery from acidification over the next 20 years. Uncertainty over the future retention of N remains, however, and beyond 2020 decreasing catchment retention could lead to NO3 becoming the dominant anion and leading potentially to further acidification in the longer term.
In terms of critical loads, the dynamic model results point to the problems inherent in the steady-state methods for calculation. These have formed the basis of the UK surface water critical loads analysis using the FAB model (Curtis et
al., 1998). Only at the Allt a Mharcaidh (site 2), Allt na
Coire nan Con (site 3) and the Dargal Lane (site 9) are critical loads (Table 1) not exceeded under the predicted Gothenburg Protocol deposition and based on an ANC target of zero µeq l-1 (Curtis, 2001). The dynamic model predicts,
however, that even under the ‘best case’ for N leaching, the Dargal Lane will not have recovered ANC of zero µeq l-1
by 2020. This demonstrates the time delay in achieving the critical load and the recovery of the surface water system. The ANC at both sites 2 and 3 is already significantly greater that zero µeq l-1 and so future exceedance of the critical load
is unlikely.
At the Round Loch of Glenhead (site 7), the FAB analysis indicates that both S and N deposition are still too high in 2010 and exceed the critical load. This implies that the slight recovery to 2020 predicted by the dynamic model will not be sustained and the target of zero µeq l-1 ANC will not be
achieved in the longer-term without further reductions. At all other sites, the critical load is still exceeded in 2010, largely as a result of the high levels of N leaching assumed in FAB (Curtis et al., 1998). The dynamic model results are only assessed to 2020 but show a general recovery in ANC under the ‘best case’ for N leaching (Fig. 9). The FAB critical load exceedance, however, implies that this recovery is temporary and that further acidification is likely beyond 2020. This is supported by the dynamic model output under the ‘worst case’ scenario for N leaching whereby ANC generally remains the same as present in 2020, despite the reductions in N and S deposition (Fig. 9).
Clearly, a rigorous comparison of the steady-state and dynamic critical load methods and predictions is required in reviewing the need for further emission reductions beyond the Gothenburg Protocol levels. These results also further emphasise the need to understand the dynamics and controls on N leaching at catchment scale.
Reductions in N deposition are likely to become increasingly important at many sites if further reductions in S, beyond those already agreed under the Gothenburg Protocol, prove difficult. This is of particular importance at sites where elevated NO3 concentrations in surface waters are already observed and where the NO3 contribution to the total anion load is significant (Jenkins et al., 1996). The degree to which recovery can be achieved by reducing either S or N beyond the agreed requirements of the Gothenburg Protocol, is site specific and will depend on the relative current deposition fluxes of S and N, the accumulated historical S and N fluxes and the current status of N saturation as reflected in the level of NO3 concentration in surface water. The negotiation of future S and N emission reductions require that further regional dynamic model simulations be undertaken and that methods be developed to scale-up the predictions to interface with European scale Integrated Assessment Models.
Acknowledgements
This work was supported in part by the UK Department of the Environment (under contract Nos EPG1/3/117 and EPG1/3/133), the Department of the Environment Northern Ireland, the Commission of the European Communities under the RECOVER:2010 project (EVK1-CT-1999-00018) and the Centre for Ecology and Hydrology. We also thank Dr. Sarah Metcalfe (University of Edinburgh) and Dr.
Duncan Whyatt (University of Hull) for contributing the HARM predictions. These contributions are gratefully acknowledged and any misinterpretation of their data is in no way attributable to them. We thank all those in the AWMN for the provision water chemistry data, NETCEN for the provision of deposition data and MLURI for soils data.
References
Aber, J.D., Nadelhoffer, K.J., Steudler, P. and Mellilo, J.M., 1989. Nitrogen saturation in northern forest ecosystems. Bioscience,
39, 378–386.
Cosby, B.J. and Wright, R.F., 1998. Modelling regional response of lakewater chemistry to changes in acidic deposition: the MAGIC model applied to lake surveys in southernmost Norway 1974-1986-1995. Hydrol. Earth Syst. Sci., 2, 563–576. Cosby, B.J., Hornberger, G.M, Galloway, J.N. and Wright, R.F.,
1985a. Modelling the effects of acid deposition: Assessment of a lumped parameter model of soil water and stream water chemistry. Wat. Resour. Res., 21, 51–63.
Cosby, B.J., Hornberger, G.M., Galloway, J.N. and Wright, R.F., 1985b. Time scales of acidification: A quantitative model for estimating freshwater acidification. Environ. Sci. Technol., 19, 1144–1149.
Cosby, B.J., Hornberger, G.M., Wright, R.F. and Galloway, J.N., 1986. Modelling the effects of acid deposition: Control of long term sulphate dynamics by soil sulphate adsorption. Wat. Resour.
Res., 22, 1283–1291.
Cosby, B.J., Ferrier, R.C., Jenkins, A. and Wright, R.F., 2001. Modelling the effects of acid deposition: refinements, adjustments and inclusion of nitrogen dynamics in the MAGIC model. Hydrol. Earth Syst. Sci., 5, 499–517.
Curtis, C. (Ed.), 2001. Critical Loads for Acidity and Metals,
Volume 1. Final report under contract to the Department of the
Environment, Transport and the Regions. DETR, London, 321 pp.
Curtis, C., Allott, T.E.H., Reynolds, B. and Harriman, R., 1998. The prediction of nitrate leaching with the first-order acidity balance (FAB) model for upland catchments in Great Britain.
Water Air Soil Pollut., 105, 205–215.
Department of the Environment (DOE) and Forestry Commission, 1991. Forests and surface water acidification. Forestry Commission, Edinburgh.
De Vries, W., Posch, M. and Kamari, J., 1989. Simulation of the long-term soil response to acid deposition in various buffer ranges. Water Air Soil Pollut., 48, 349–390.
Emmett, B.A., Boxman, D., Bredemeier, M., Moldan, F., Gundersen, P., Kjonaas, O.J., Schleppi, P., Tietema, A. and Wright, R.F., 1998. Predicting the effects of atmospheric nitrogen deposition in conifer stands: evidence from the NITREX ecosystem-scale experiments. Ecosystems, 1, 352–360. Evans, C.D. and Monteith, D.T., 2001. Chemical trends at lakes and streams in the UK Acid Waters Monitoring Network, 1988-2000. Hydrol. Earth Syst. Sci., 5, 351–366.
Ferrier, R.C., Wright, R.F., Cosby, B.J. and Jenkins, A., 1995. Application of the MAGIC model to the Norway spruce stand at Solling, Germany. Ecol. Model., 83, 77–84.
Ferrier, R.C., Jenkins, A., Wright, R.F., Schöpp, W. and Barth, H., 2001. Assessment of recovery of European surface waters from acidification 1970-2000: An introduction to the special issue. Hydrol. Earth Syst. Sci., 5, 274–282.
Forsius, M., Guardans, R., Jenkins, A., Lundin, L. and Nielsen, K.E. (Eds.), 1998. Integrated Monitoring: Environmental Assessment Through Model and Empirical Analysis. The
Finnish Environment, 218. Finnish Environment Agency,
Helsinki, 172 pp.
Fowler, D. and Smith, R., 2000. Spatial and temporal variability in the deposition of acidifying species in the UK between 1986 and 1997. In: UK Acid Waters Monitoring Network: 10 Year
Report, D.T. Monteith and C.D. Evans (Eds.), 13–27. ENSIS
Publishing, London.
Gundersen, P., Emmett, B.A., Kjonaas, O.J., Koopmans, C.J. and Tietema, A., 1998. Impact of nitrogen deposition on nitrogen cycling in forests: a synthesis of NITREX data. Forest Ecol.
Manage., 101, 37–55.
Haines, T.A., 1986. Fish population trends in response to surface water acidification. In: Acid deposition, long term trends, 300– 334. National Academy Press, Washington DC.
Harriman, R., Allott, T.E.H., Battarbee, R.W., Curtis, C., Hall, J. and Bull, K., 1995. Critical load maps for UK freshwaters. In:
Critical loads of acid deposition for UK freshwaters, 19–24.
Report for DoE.
Helliwell, R.C., Ferrier, R.C., Evans, C.D. and Jenkins, A., 1998. A comparison of methods for estimating soil characteristics in regional acidification models; an application of the MAGIC model to Scotland. Hydrol. Earth Syst. Sci., 2, 509–520. Hornberger, G.M., Cosby, B.J. and Galloway, J.N., 1986.
Modelling the effects of acid deposition: uncertainty and spatial variability of long term sulphate dynamics in a region. Wat.
Resour. Res., 22, 1293–1302.
Jenkins, A. and Cosby, B.J., 1989. Modelling surface water acidification using one and two soil layers and simple flow routing. In: Regional acidification models, J. Kamari, D.F. Brakke, A. Jenkins, S.A. Norton and R.F. Wright (Eds.). Springer, Berlin.
Jenkins, A., Boorman, D. and Renshaw, M., 1996. The UK Acid Waters Monitoring Network: an assessment of chemistry data, 1988-93. Freshwater Biol., 36, 169–178.
Jenkins, A., Renshaw, M., Helliwell, R.C., Sefton, C., Ferrier, R.C. and Swingewood, P., 1997. Modelling surface water
acidification in the UK: application of the MAGIC model to sites in the UK Acid Waters Monitoring Network. IH Report
No. 131, Wallingford, UK, 54 pp.
Jenkins, A., Helliwell, R.C., Swingewood, P.J., Sefton, C., Renshaw, M. and Ferrier, R.C., 1998. Will reduced sulphur emissions under the Second Sulphur Protocol lead to recovery of acid sensitive sites in the UK? Environ. Pollut., 99, 309– 318.
Jenkins, A., Ferrier, R.C. and Helliwell, R.C., 2001. Modelling nitrogen dynamics at Lochnagar, N.E. Scotland. Hydrol. Earth
Syst. Sci., 5, 519–527.
Likens, G.E., Wright, R.F., Galloway, J.N. and Butler, T.J., 1979. Acid Rain. Sci. Amer., 241, 43–51.
Metcalfe, S.E. and Whyatt, J.D., 1995. Modelling future acid deposition with HARM. In: Acid rain and its impact: The critical
loads debate, R.W. Battarbee (Ed.), 27–36. ENSIS Publishing,
London.
Miller, H.G., 1984. Dynamics of nutrient cycling in plantation ecosystems. In: Nutrition of plantation forests, G.D. Bowen and E.K.S. Nambiar (Eds.), 53-78. Academic Press, London. Monteith, D.T. and Evans, C.D. (Eds.), 2000. UK Acid Waters
Monitoring Network: 10 Year Report. Analysis and
Interpretation of Results, April 1988–March 1998. ENSIS Publishing, London, 363 pp.
Muniz, I.P., 1991. Freshwater acidification: its effects on species and communities of freshwater microbes, plants and animals.
Nisbet, T.R., Fowler, D. and Smith, R.I., 1995. Use of the critical loads approach to quantify the impact of afforestation on surface water acidification. In: Acid rain and its impact: the critical
loads debate, R.W. Battarbee. (Ed.). ENSIS Publishing, London
183 pp.
Patrick, S.T., Juggins, S., Waters, D. and Jenkins, A., 1991. The
United Kingdom Acid Waters Monitoring Network. Site description and methodology report. ENSIS Publishing,
London, 63 pp.
Patrick, S.T., Monteith, D. and Jenkins, A., 1995. UK Acid Waters
Monitoring Network: The First Five Years. ENSIS Publishing,
London, 320 pp.
Posch, M., Hettelingh, J-P, de Smet, P.A.M. and Downing, R.J., 1997. Calculation and Mapping of Critical Thresholds in
Europe: CCE Status Report 1997. RIVM Report 259101007,
National Institute for Public Health and the Environment, Bilthoven, Netherlands, 161 pp.
RGAR, 1990. Acid Deposition in the United Kingdom, 1986–1988.
UK Review Group on Acid Rain, 3rd Report. Department of the
Environment, London, 124 pp.
Reuss, J.O. and Johnson, D.W., 1985. Effects of soil processes on the acidification of water by acid deposition. J. Environ. Qual.,
14, 26–31.
Robson, A., Jenkins, A. and Neal, C., 1991. Towards predicting episodic changes in stream water chemistry. J. Hydrol., 125, 161–174.
Smith, W.H., 1974. Air pollution — effects on the structure and function of temperate forest ecosystems. Environ. Poll., 6, 111– 129.
UN-ECE, 2000. Protocol to Abate Acidification, Eutrophication
and Ground-Level Ozone. http://www.unece.org/env/Irtap.
Warfvinge, P., Holmberg, M., Posch, M. and Wright, R.F., 1992. The use of dynamic models to set target loads. Ambio, 21, 369– 376.
Warren Spring Laboratory, 1983. Acid deposition in the United
Kingdom. Warren Spring Laboratory, Stevenage, 72 pp.
Warren Spring Laboratory, 1987. Acid deposition in the United
Kingdom 1981-1985. Warren Spring Laboratory, Stevenage, 104
pp.
Wright, R.F. and van Breemen, N., 1995. The NITREX project: an introduction. Forest Ecol. Manage., 71, 1–5.
Wright, R.F., Cosby, B.J., Ferrier, R.C., Jenkins, A., Bulger, A. and Harriman, R., 1994. Changes in acidification of lochs in Galloway, southwestern Scotland, 1979-1988: The MAGIC model used to evaluate the role of afforestation, calculate critical loads and predict fish status. J. Hydrol., 161, 257–285. Wright, R.F., Emmett, B.A. and Jenkins, A., 1998. Acid deposition,
land-use change and global change: MAGIC7 model applied to Aber (NITREX project) and Risdalsheia, Norway (RAIN and CLIMEX projects). Hydrol. Earth Syst. Sci., 2, 385–397.