HAL Id: hal-00633779
https://hal.archives-ouvertes.fr/hal-00633779
Submitted on 16 Jun 2017HAL is a multi-disciplinary open access
archive for the deposit and dissemination of sci-entific research documents, whether they are pub-lished or not. The documents may come from teaching and research institutions in France or abroad, or from public or private research centers.
L’archive ouverte pluridisciplinaire HAL, est destinée au dépôt et à la diffusion de documents scientifiques de niveau recherche, publiés ou non, émanant des établissements d’enseignement et de recherche français ou étrangers, des laboratoires publics ou privés.
New products for a better characterisation of smoke
plume and gas/aerosol dispersion from boreal eurasian
forest fires: the ALANIS Smoke Plume project
J.-P. Muller, V. Yershov, D. Fisher, M. Krol, W. Peters, J. San-Miguel, I.
Palumbo, F. Sedano, P. Strobl, Cathy Clerbaux, et al.
To cite this version:
J.-P. Muller, V. Yershov, D. Fisher, M. Krol, W. Peters, et al.. New products for a better characterisa-tion of smoke plume and gas/aerosol dispersion from boreal eurasian forest fires: the ALANIS Smoke Plume project. Biogeosciences Discussions, European Geosciences Union, 2011, 8 (5), pp.9747-9761. �10.5194/bgd-8-9747-2011�. �hal-00633779�
BGD
8, 9747–9761, 2011The ALANIS Smoke Plume project J.-P. Muller et al. Title Page Abstract Introduction Conclusions References Tables Figures J I J I Back Close
Full Screen / Esc
Printer-friendly Version Interactive Discussion Discussion P a per | Dis cussion P a per | Discussion P a per | Discussio n P a per | Biogeosciences Discuss., 8, 9747–9761, 2011 www.biogeosciences-discuss.net/8/9747/2011/ doi:10.5194/bgd-8-9747-2011
© Author(s) 2011. CC Attribution 3.0 License.
Biogeosciences Discussions
This discussion paper is/has been under review for the journal Biogeosciences (BG). Please refer to the corresponding final paper in BG if available.
New products for a better characterisation
of smoke plume and gas/aerosol
dispersion from boreal eurasian forest
fires: the ALANIS Smoke Plume project
J.-P. Muller1, V. Yershov1, D. Fisher1, M. Krol2, W. Peters2, J. San-Miguel3, I. Palumbo3, F. Sedano3, P. Strobl3, C. Clerbaux4, M. George4, J. Helbert5, and B. Guillaume5
1
University College London, Mullard Space Science Laboratory, Holmbury St. Mary, Surrey, RH5 6NT, UK
2
Wageningen University and Research Center, Meteorology and Air Quality, Atlas building, Droevendaalsesteeg 4, 6708 PB, Wageningen, The Netherlands
3
Joint Research Centre, Institute for Environment and Sustainability, Via Fermi s/n, Ispra (VA), 21027, Italy
4
Laboratoire Atmosph `eres, Milieux, Observations Spatiales, Universit ´e P & M Curie, 4 place Jussieu, 75252 Paris Cedex 05, France
5
Noveltis, 2 avenue de l’Europe, 31520 Ramonville Saint Agne, France
Received: 22 July 2011 – Accepted: 8 August 2011 – Published: 29 September 2011 Correspondence to: J.-P. Muller ([email protected])
BGD
8, 9747–9761, 2011The ALANIS Smoke Plume project J.-P. Muller et al. Title Page Abstract Introduction Conclusions References Tables Figures J I J I Back Close
Full Screen / Esc
Printer-friendly Version Interactive Discussion Discussion P a per | Dis cussion P a per | Discussion P a per | Discussio n P a per | Abstract
The ALANIS (Atmosphere-LANd Integrated Study) Smoke Plume project is an on-going study funded by the ESA’s Support to Science Element (STSE) dedicated to the monitoring of the fire aerosol and trace gases dispersion over Eurasia from multi-mission EO-based data, in link with the scientific issues of land-atmosphere processes
5
in the iLEAPS community. The injection and dispersion of the smoke plumes are per-formed with the TM5 model from several new products (burnt areas and forest fire emis-sions amounts, smoke plumes injection heights) derived from the MERIS and AATSR products and from the validated IASI CO products.
A first study focused on the Russian wildfire events of the summer of 2010 has
10
shown the potential of the European missions to assess the forest fire emissions and the aerosols/gases injection and transport over Eurasia. The release of the integrated model, including the new products still under development, is planned for the summer of 2011.
1 Introduction
15
Biomass burning events in boreal Eurasia have proven a significant impact on atmo-spheric chemistry. Indeed, besides increased air pollution due to direct emissions from fires, intense burning has been causing a decrease of carbon storage, which can potentially convert these ecosystems from carbon sinks to net sources, in turn con-tributing to global warming (Turquety et al., 2007). Vegetation fires vertically displace
20
their emissions through convection induced by the heat and moisture released by the fire. Ambient meteorological conditions, fire released energy and moisture determine the injection height of fire plumes in the atmosphere (Langmann et al., 2009). Most of the fires deposit their emissions into the atmospheric boundary layer (i.e. below about 2 km). However, under high atmospheric instability and high energy release, fire
emis-25
BGD
8, 9747–9761, 2011The ALANIS Smoke Plume project J.-P. Muller et al. Title Page Abstract Introduction Conclusions References Tables Figures J I J I Back Close
Full Screen / Esc
Printer-friendly Version Interactive Discussion Discussion P a per | Dis cussion P a per | Discussion P a per | Discussio n P a per |
the atmospheric lifetime of most trace gases and aerosols is substantially enhanced and their effects last longer affecting greater regions (IPCC, 2007). This happens in particular at northern high latitudes.
Understanding the impacts of fires on air quality and climate requires the use of transport models, which must be initialized with reliable estimations of smoke plume
5
injection height and validated against plume dispersion measurements over time. Un-fortunately, due to the lack of auxiliary data, often rather arbitrary assumptions are used (e.g. fixed vertical injection levels, see Turquety et al., 2007).
Satellite remote sensing may provide useful information on variable and widespread boreal fires and may be used to monitor regional to global dispersion of fire-related
10
aerosols and trace gases. In this context, the main objective of the ALANIS Smoke Plumes project is to exploit the complementary capabilities offered by multi-mission EO data for improving current large-scale dispersion forecasts of emitted compounds. In particular, three novel products will be developed and validated, especially (i) a smoke-plume injection height product based on a recent methodology combining Envisat
15
AATSR and ERS-2 ATSR-2 stereo retrievals with plume-height information extracted from the Envisat MERIS O2 band, (ii) a burnt areas and emission product based on MERIS reflectance images, and (iii) a large scale plume-dispersion tracking product derived from near-real-time MetOp-A IASI retrievals. These novel products will be inte-grated into the TM5 land-atmosphere coupled model with 4D-var assimilation scheme
20
capable of explicitly simulating the main processes characterizing fire-plume disper-sion.
Finally, an experimental dataset will be generated including both the aforementioned target products engendered for a consistent number of fire events occurred between August 2008 and August 2011 over the whole boreal Eurasia, as well as the
corre-25
sponding emission dispersion forecasts obtained by employing the developed land-atmosphere coupled model.
The ALANIS Smoke Plume project is run by a consortium lead by Noveltis (www. noveltis.fr/alanis/), including the Wageningen University Research Centre, the Institute
BGD
8, 9747–9761, 2011The ALANIS Smoke Plume project J.-P. Muller et al. Title Page Abstract Introduction Conclusions References Tables Figures J I J I Back Close
Full Screen / Esc
Printer-friendly Version Interactive Discussion Discussion P a per | Dis cussion P a per | Discussion P a per | Discussio n P a per |
for Environment and Sustainability of the JRC, the University College of London, and LATMOS.
2 Methodology and first results
A preliminary study has been conducted on the Russian fire events which occurred in summer 2010 to show the potential outcomes of the project for emission estimates and
5
plume tracking.
2.1 CO plume tracking
The IASI instrument onboard the MetOp platform measured increased levels of CO during the fire events (Clerbaux et al., 2009; George et al., 2009). Figure 1 illustrates the CO total columns observed for 3 consecutive days, for the 09:30 local time orbit.
10
The CO distribution is obtained from the IASI thermal infrared radiance data using the ULB/LATMOS FORLI algorithm to retrieve concentrations. CO total columns and corresponding retrieval errors and averaging kernel information can be derived in near real time, with a global coverage twice a day. The CO product includes a set of flags that can be used to assess the quality of the measurement.
15
2.2 Smoke plume injection height
SPIHs have been derived from AATSR stereo images for 10 dates from 26 July 2010– 15 August 2010 using the automated stereo matching techniques being developed at UCL-MSSL (see Muller et al., 2007, for a previous example). Due to the limited swath width of AATSR data over the Moscow fire region AATSR data are only available every
20
few days. For each date, a three-dimensional height field was derived from the AATSR nadir and forward view along with a smoke-plume mask from the AATSR forward view generated using the multispectral clustering technique. The AATSR forward view is employed due to the 57◦ viewing angle showing more smoke present. An example
BGD
8, 9747–9761, 2011The ALANIS Smoke Plume project J.-P. Muller et al. Title Page Abstract Introduction Conclusions References Tables Figures J I J I Back Close
Full Screen / Esc
Printer-friendly Version Interactive Discussion Discussion P a per | Dis cussion P a per | Discussion P a per | Discussio n P a per |
for 26 July 2010 is shown in Fig. 2 of the nadir and forward view, the corresponding height field and a binary smoke mask generated from the AATSR forward view. Two techniques are under development, one which emphasizes speed whilst sacrificing some quality (called M6) whilst the other is 15 times slower but emphasizes quality (called GotchaS). M6 will be employed for the generation of large area time series
5
whilst GotchaS (developed under a NERC-NCEO funding) will be employed together with manual stereo measurements for validating the fast technique. The NASA MISR instrument uses a manual approach to plume mask digitisation followed by an auto-mated stereo matcher originally developed at UCL within a tool called MINX. Several years of MISR data have been manually processed for North America (Val Martin et al.,
10
2010). The results from ALANIS will be highly complementary to these MISR results. Unfortunately there are no precise match-ups in time between Envisat and NASA Terra so it is not feasible to employ MISR manual SPIHs to assess AATSR automated SPIHs except at the qualitative level.
In addition to AATSR stereo, an assessment is being made of the potential of MERIS
15
Oxygen A-band for retrieving SPIHs. Dubuisson et al. (2009) showed a simulation of how aerosol top heights could be retrieved over a dark surface with an error less than 10 %. The difficulty with the Moscow fires is that at the NIR wavelengths employed for Oxygen A-band, the surface reflectance is high so the errors are likely to be around 30 %. Figure 3 shows a ratio of within-band to band-wing which clearly demonstrates
20
that plumes can be detected.
For each date, the AATSR SPIH and Smoke Plume Mask (SPM) will be provided as a geocoded dataset as well as a height histogram in the grid-box needed for subsequent numerical simulation studies.
2.3 Burnt areas and fire emission estimates
25
Burnt area estimates in this case study are based on the rapid processing of MODIS data during the peak of the fire season. Due to the persistent smoke cover in the area of Moscow, where this study case was carried out, it was not possible to perform the
BGD
8, 9747–9761, 2011The ALANIS Smoke Plume project J.-P. Muller et al. Title Page Abstract Introduction Conclusions References Tables Figures J I J I Back Close
Full Screen / Esc
Printer-friendly Version Interactive Discussion Discussion P a per | Dis cussion P a per | Discussion P a per | Discussio n P a per |
daily mapping and update of forest fire perimeters through traditional spectral image classification. The burnt area mapping methodology in ALANIS smoke plumes will, in fact, be based on the spectral classification of time series images of MERIS. In this case study, an approximation of the burnt area perimeters was obtained using the MODIS thermal anomaly product over the study areas. Daily cumulative hot spots (thermal
5
anomalies) over the area were mapped and the final perimeter of the burnt areas was extracted through a spatial buffering of the hot spots. In general, the approximation of burnt area perimeters with this procedure obtains estimates with an error below 20 %, which was acceptable for real-time estimates. The estimates are based on biomass estimates derived from the conversion of the Global Land Cover dataset (JRC, 2003)
10
into fuel types, and assuming that the biomass in the burnt areas is consumed.
2.4 Injection and dispersion modelling
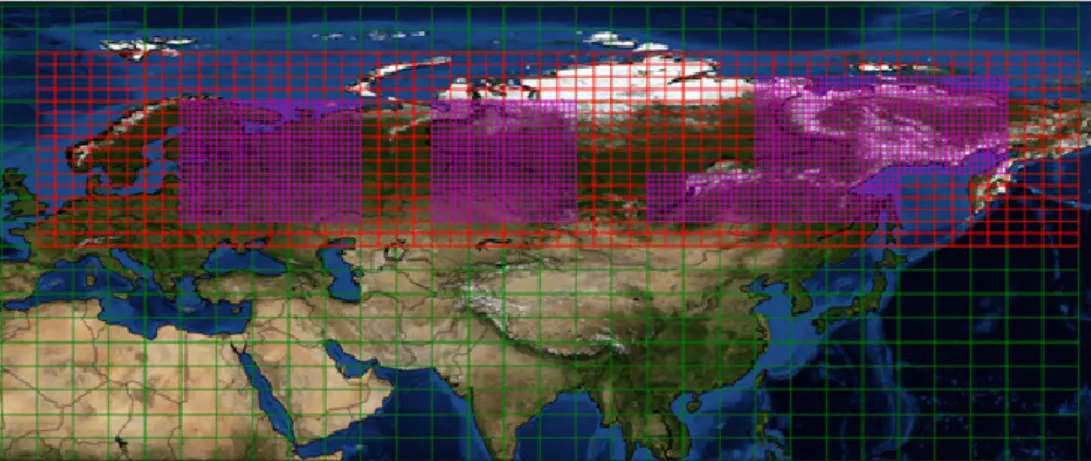
The TM5 model will be used to simulate the dispersion of CO and other air pollutants from Eurasian biomass burning. TM5 has the capability to zoom in over specific regions and Fig. 5 shows the proposed model geometry in the ALANIS project. Note that the
15
Moscow area is one of the regions that will be simulated at higher (1◦× 1◦) horizontal resolution.
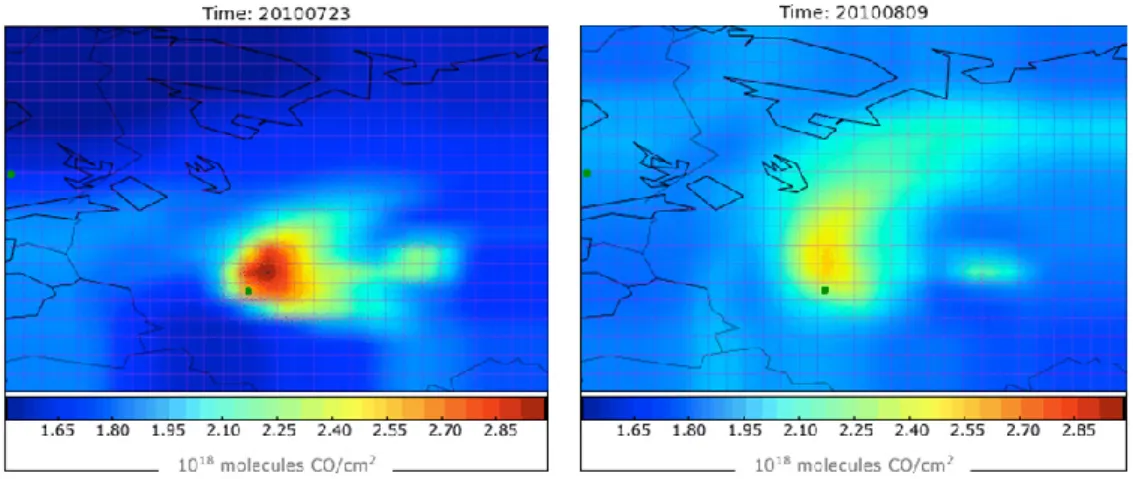
The TM5-4DVAR system will be used to infer CO emissions from a combination of surface measurements (NOAA/ESRL) and IASI CO measurements (see Fig. 6). The daily estimates of biomass burning will be optimized to obtain an optimal agreement
20
between atmospheric measurements and model simulations. In a next step the opti-mized fire emissions will be used in a forward simulation with full chemistry. Results of these simulations will be validated with atmospheric measurements. As an exam-ple of such validation measurements we show in Fig. 7 preliminary results from the HUMPPA campaign that was conducted in the summer of 2010 during the Russian fire
25
event. Clear signals of biomass burning are observed in the last week of July 2010, and around 9 August.
BGD
8, 9747–9761, 2011The ALANIS Smoke Plume project J.-P. Muller et al. Title Page Abstract Introduction Conclusions References Tables Figures J I J I Back Close
Full Screen / Esc
Printer-friendly Version Interactive Discussion Discussion P a per | Dis cussion P a per | Discussion P a per | Discussio n P a per | 3 Conclusions
These preliminary results obtained over the Moscow area for the summer of 2010 show the high potential of the EO-missions for the tracking of smoke plumes. The novel products derived from existing AATSR and MERIS products, as well as CO concentra-tions assessed from IASI, will be injected into the TM5 model to simulate the emission
5
dispersion over Eurasia. A comparison of the simulated concentrations with in situ atmospheric measurements will then be performed in order to validate the products.
The release of these new products will represent a high added-value for the scientific communities studying pollutant emission from biomass burning and dispersion into the atmosphere.
10
Acknowledgements. The authors thank ESA’s Support to Science Element (STSE) for the
funding of this project.
References
Clerbaux, C., Boynard, A., Clarisse, L., George, M., Hadji-Lazaro, J., Herbin, H., Hurtmans, D., Pommier, M., Razavi, A., Turquety, S., Wespes, C., and Coheur, P.-F.: Monitoring of
atmo-15
spheric composition using the thermal infrared IASI/MetOp sounder, Atmos. Chem. Phys., 9, 6041–6054, doi:10.5194/acp-9-6041-2009, 2009.
Dubuisson, P., Frouin, R., Dessailly, D., Dufor ˆet, L., Leon, J.-F., Voss, K., and Antoine, D.: Es-timating the altitude of aerosol plumes over the ocean from reflectance ratio measurements in the O2 A-band, Remote Sens. Environ., 113, 1899–1911, 2009.
20
George, M., Clerbaux, C., Hurtmans, D., Turquety, S., Coheur, P.-F., Pommier, M., Hadji-Lazaro, J., Edwards, D. P., Worden, H., Luo, M., Rinsland, C., and McMillan, W.: Carbon monoxide distributions from the IASI/METOP mission: evaluation with other space-borne remote sen-sors, Atmos. Chem. Phys., 9, 8317–8330, doi:10.5194/acp-9-8317-2009, 2009.
IPCC, The Physical Science Basis, available at: http://www.ipcc.ch/ipccreports/ar4-wg1.htm,
25
2007.
JRC, Global Land Cover 2000 database, European Commission, Joint Research Centre, avail-able at: http://bioval.jrc.ec.europa.eu/products/glc2000/glc2000.php, 2003.
BGD
8, 9747–9761, 2011The ALANIS Smoke Plume project J.-P. Muller et al. Title Page Abstract Introduction Conclusions References Tables Figures J I J I Back Close
Full Screen / Esc
Printer-friendly Version Interactive Discussion Discussion P a per | Dis cussion P a per | Discussion P a per | Discussio n P a per |
Langmann, B., Duncan, B., Textor, Ch., Trentmann, J., and van der Werf, G. R.: Vegetation fire emissions and their impact on air pollution and climate, Atmos. Environ., 43, 107–116, 2009.
Muller, J.-P., Denis, M.-A., Dundas, R. D., Mitchell, K. L, Naud, C., and Mannstein, H.: Stereo cloud-top heights and cloud fraction retrieval from ATSR-2, Int. J. Remote Sens., 28, 1921–
5
1938, 2007.
Turquety, S., Logan, J. A., Jacob, D. J., Hudman, R. C., Leung, F. Y., Heald, C. L., Yantosca, R. M., Wu, S. L., Emmons, L. K., Edwards, D. P., and Sachse, G. W.: Inventory of boreal fire emissions for North America: the importance of peat burning and pyroconvective injection, J. Geophys. Res., 112, D12S03, 2007.
10
Val Martin, M., Logan, J. A., Kahn, R. A., Leung, F.-Y., Nelson, D. L., and Diner, D. J.: Smoke injection heights from fires in North America: analysis of 5 years of satellite observations, Atmos. Chem. Phys., 10, 1491–1510, doi:10.5194/acp-10-1491-2010, 2010.
BGD
8, 9747–9761, 2011The ALANIS Smoke Plume project J.-P. Muller et al. Title Page Abstract Introduction Conclusions References Tables Figures J I J I Back Close
Full Screen / Esc
Printer-friendly Version Interactive Discussion Discussion P a per | Dis cussion P a per | Discussion P a per | Discussio n P a per |
Fig. 1. IASI CO total column measurements (in molecules cm−2) over Europe, averaged over 3 days (9–11 August 2010).
BGD
8, 9747–9761, 2011The ALANIS Smoke Plume project J.-P. Muller et al. Title Page Abstract Introduction Conclusions References Tables Figures J I J I Back Close
Full Screen / Esc
Printer-friendly Version Interactive Discussion Discussion P a per | Dis cussion P a per | Discussion P a per | Discussio n P a per |
Fig. 2. AATSR input images (upper left: 0.55 µm nadir observation; upper right: 0.55 µm for-ward view) together with stereo height retrievals (lower left) and smoke plume injection height (lower right) over the east of the Moscow on 26 July 2010. Note the higher amount of smoke detected in the forward view when compared with the nadir view which leads to areas which do not observe the same smoke mask in both views.
BGD
8, 9747–9761, 2011The ALANIS Smoke Plume project J.-P. Muller et al. Title Page Abstract Introduction Conclusions References Tables Figures J I J I Back Close
Full Screen / Esc
Printer-friendly Version Interactive Discussion Discussion P a per | Dis cussion P a per | Discussion P a per | Discussio n P a per |
Fig. 3. MERIS False colour composition (red: band 6, green: band 13, blue: band 1) taken at the same time as AATSR on 26 July 2010 (left panel) and Oxygen A-band ratio [band 10/band 11] (right panel) showing plumes which can be observed in the previous fig-ure but over a wider area. Note the different behaviour of clouds cf. smoke and the lack of any spectral “smile” correction to date.
BGD
8, 9747–9761, 2011The ALANIS Smoke Plume project J.-P. Muller et al. Title Page Abstract Introduction Conclusions References Tables Figures J I J I Back Close
Full Screen / Esc
Printer-friendly Version Interactive Discussion Discussion P a per | Dis cussion P a per | Discussion P a per | Discussio n P a per |
Fig. 5. The TM5 geometry that will be used in the ALANIS project. Globally, a resolution of 6◦× 4◦ (longitude × latitude) will be used (green). The entire boreal Eurasian continent will be simulated at 3◦× 2◦ horizontal resolution (red) and over specific areas the resolution will be further enhanced to 1◦× 1◦ (magenta). These regions have been classified as “interesting” from a biomass burning point of view, the border between Russia and China is such a region.
BGD
8, 9747–9761, 2011The ALANIS Smoke Plume project J.-P. Muller et al. Title Page Abstract Introduction Conclusions References Tables Figures J I J I Back Close
Full Screen / Esc
Printer-friendly Version Interactive Discussion Discussion P a per | Dis cussion P a per | Discussion P a per | Discussio n P a per |
Fig. 6. Examples of CO concentrations simulated by the TM5 model over the Moscow area on the 23 July 2010 (left) and 9 August 2010 (right). Moscow is represented by the green dot below the centre of the figure.
BGD
8, 9747–9761, 2011The ALANIS Smoke Plume project J.-P. Muller et al. Title Page Abstract Introduction Conclusions References Tables Figures J I J I Back Close
Full Screen / Esc
Printer-friendly Version Interactive Discussion Discussion P a per | Dis cussion P a per | Discussion P a per | Discussio n P a per |
Fig. 7. Preliminary results of the HUMPPA (Hyyti ¨al ¨a United Measurements of Photochemistry and Particles in the Air) campaign that was conducted in the summer of 2010 in Finland. The upper panel shows in blue the formaldehyde concentration as a function of time. The middle panel (red) depicts the measured Acetonitrile concentrations. Acetonitrile is a clear marker for biomass burning. The lower panel (green) shows the measured CO concentrations. Note the clear correlation between CO and acetonitrile. Figure made from preliminary data that were kindly provided by the HUMPPA team (Jonathan Williams).


![Fig. 3. MERIS False colour composition (red: band 6, green: band 13, blue: band 1) taken at the same time as AATSR on 26 July 2010 (left panel) and Oxygen A-band ratio [band 10/band 11] (right panel) showing plumes which can be observed in the previous fi](https://thumb-eu.123doks.com/thumbv2/123doknet/14769316.590101/12.918.59.652.165.392/meris-false-colour-composition-oxygen-showing-observed-previous.webp)